Daily Technical Report
April 01, 2013
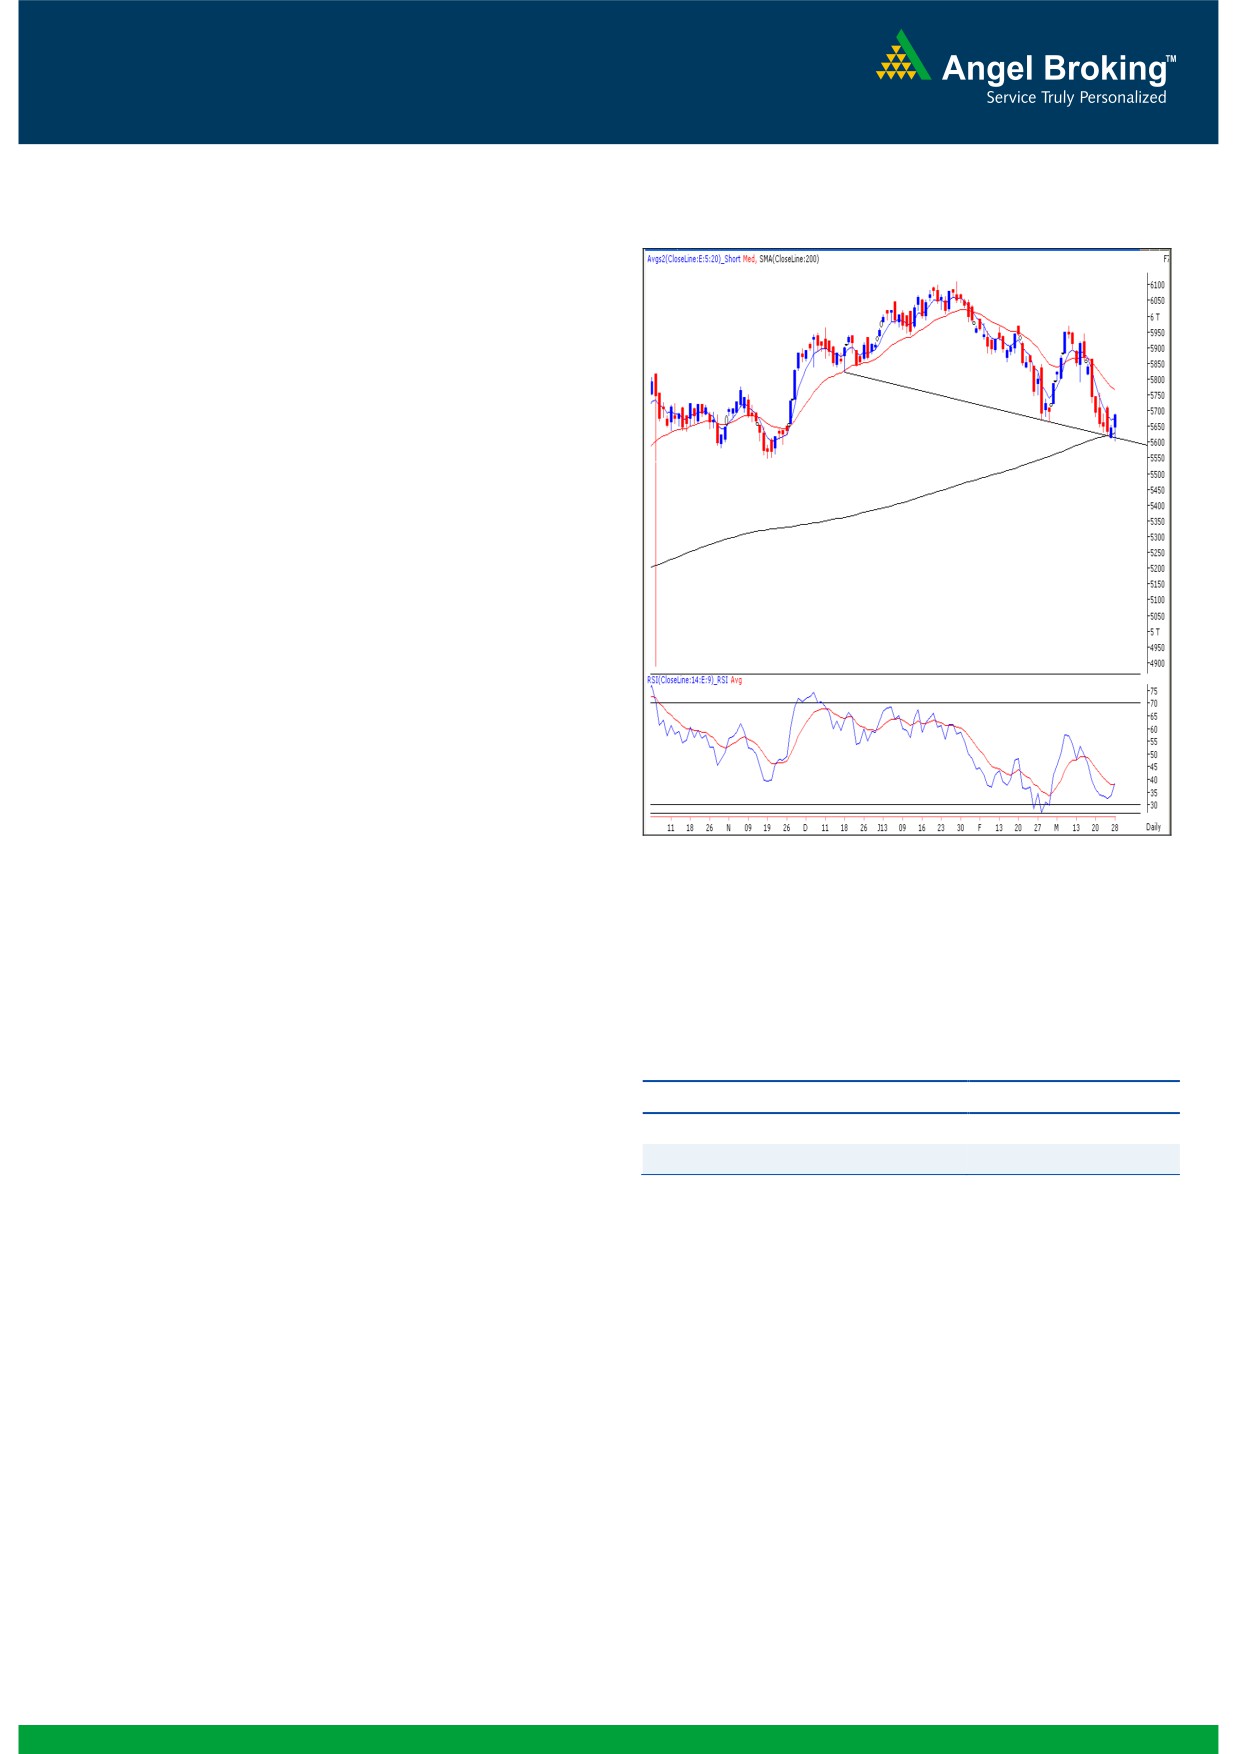
Exhibit 1: Nifty Daily Chart
Sensex (18836) / NIFTY (5683)
On Thursday, our benchmark indices opened on a flat note
and nearly tested the 5600 mark during the first half of the
session. However, a short covering rally during the latter half
led the indices to close in the positive territory. Most of the
sectors ended on a gaining side except for Auto counters
which ended with marginal losses. The advance to decline
ratio was in favor of advancing counters (A=1625 D=1149)
Formation
The ’20-day EMA’ and the ’20-week EMA’ are placed at
19094 / 5766 and 19161 / 5801 levels, respectively.
The ‘200 Day SMA’ is placed at 18556 / 5627.
The ‘Lower Top Lower Bottom’ formation on weekly
chart is still intact.
We are witnessing a ‘Downward Sloping’ trend line
support drawn by joining the lows of December 18,
Source: Falcon:
2012 and March 04, 2013.
The daily momentum oscillators viz, the ‘RSI’ and
‘Stochastic’ are signaling a positive crossover.
Actionable points:
Trading strategy:
This week, we witnessed a very narrow trading range for the
View
Bullish Above 5693
benchmark indices. As mentioned in our earlier report, the
Expected Target
5766
‘Downward Sloping Trend Line’ and
‘200-day SMA’
Support levels
5655 - 5600
provided decent support to our benchmark indices. Despite a
couple of decent attempts, the bears were unsuccessful in
violating the strong support level of 18525 / 5600. In fact,
indices managed to bounce sharply during the last hour of
the week to register a weekly close marginally in the positive
territory. We are now observing that the daily ‘RSI’ and
‘Stochastic’ oscillators have signaled a positive crossover.
Hence, a move beyond Thursday’s high of 18883 / 5693
may push indices higher to test next resistance levels of
19094 - 19210 / 5766 - 5820. On the flipside, we
maintain our view that only a sustainable move below 18525
/ 5600 would justify a bear case scenario and may drag
indices lower to test 18255 - 17800 / 5548 - 5441 levels.
1
Daily Technical Report
April 01, 2013
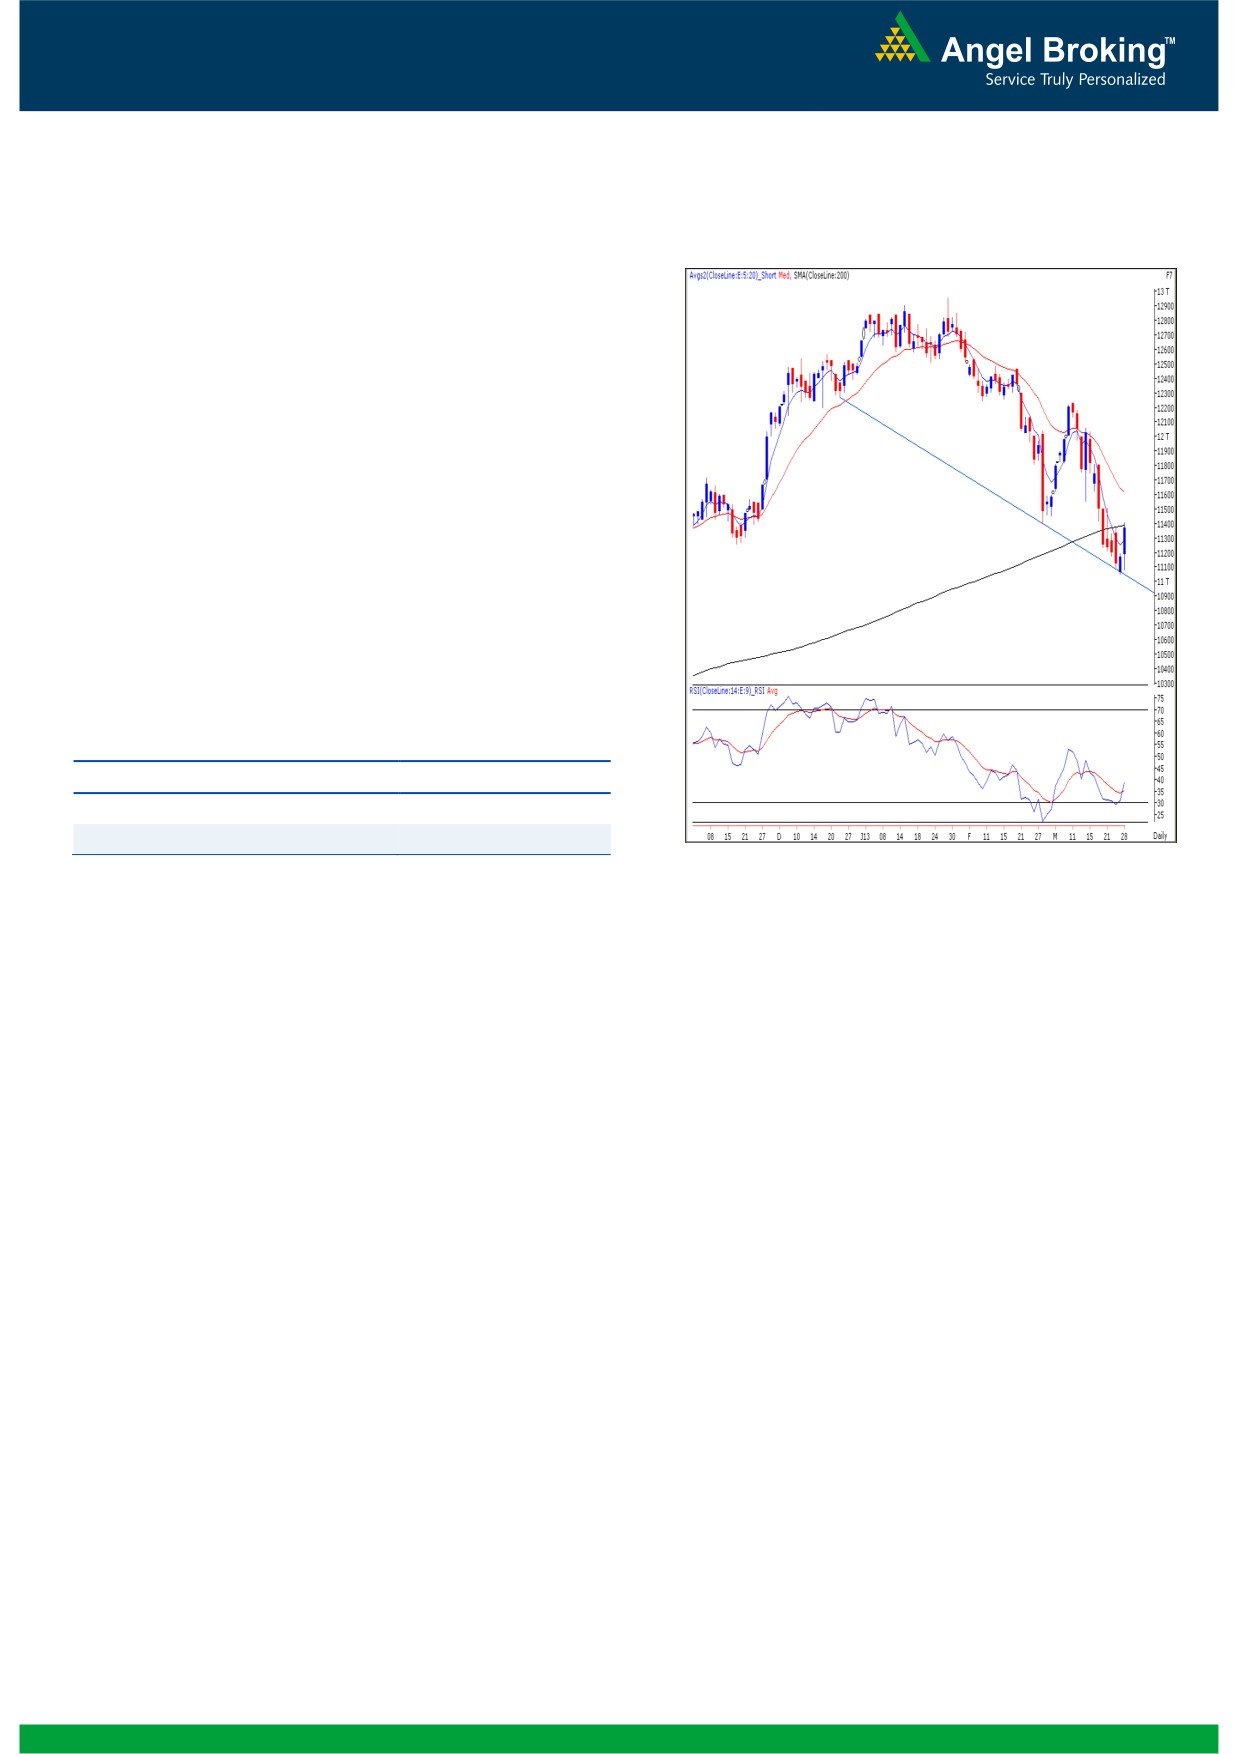
Exhibit 2: Bank Nifty Daily Chart
Bank Nifty Outlook - (11362)
On Thursday, Bank Nifty opened on a positive note and
gained strength on account of short covering to close with
a gain of 1.78%. The index has bounced back after
taking support at the trend line formed by joining the
significant lows of December 18, 2012 and February 28,
2013. In addition we are witnessing a positive crossover
in ‘RSI’ momentum oscillator on the daily chart coupled
with ‘Bullish Harami’ candlestick pattern on the weekly
chart. The effect of the above mentioned technical tools
will be seen if the index sustains above 11413 level. In
this scenario the BakNifty is likely to rally towards 11510
- 11555 levels. On the downside 11198 - 11117 levels
are likely to act as support for the day.
Actionable points:
View
Bullish Above 11413
Expected Target
11510 - 11555
Support Level
11198 - 11117
Source: Falcon:
2
Daily Technical Report
April 01, 2013
Research Team Tel: 022 - 30940000
DISCLAIMER
This document is solely for the personal information of the recipient, and must not be singularly used as the basis of any investment
decision. Nothing in this document should be construed as investment or financial advice. Each recipient of this document should make
such investigations as they deem necessary to arrive at an independent evaluation of an investment in the securities of the companies
referred to in this document (including the merits and risks involved), and should consult their own advisors to determine the merits and
risks of such an investment.
Angel Broking Limited, its affiliates, directors, its proprietary trading and investment businesses may, from time to time, make
investment decisions that are inconsistent with or contradictory to the recommendations expressed herein. The views contained in this
document are those of the analyst, and the company may or may not subscribe to all the views expressed within.
Reports based on technical and derivative analysis center on studying charts of a stock's price movement, outstanding positions and
trading volume, as opposed to focusing on a company's fundamentals and, as such, may not match with a report on a company's
fundamentals.
The information in this document has been printed on the basis of publicly available information, internal data and other reliable
sources believed to be true, but we do not represent that it is accurate or complete and it should not be relied on as such, as this
document is for general guidance only. Angel Broking Limited or any of its affiliates/ group companies shall not be in any way
responsible for any loss or damage that may arise to any person from any inadvertent error in the information contained in this report.
Angel Broking Limited has not independently verified all the information contained within this document. Accordingly, we cannot testify,
nor make any representation or warranty, express or implied, to the accuracy, contents or data contained within this document. While
Angel Broking Limited endeavors to update on a reasonable basis the information discussed in this material, there may be regulatory,
compliance, or other reasons that prevent us from doing so.
This document is being supplied to you solely for your information, and its contents, information or data may not be reproduced,
redistributed or passed on, directly or indirectly.
Angel Broking Limited and its affiliates may seek to provide or have engaged in providing corporate finance, investment banking or
other advisory services in a merger or specific transaction to the companies referred to in this report, as on the date of this report or in
the past.
Neither Angel Broking Limited, nor its directors, employees or affiliates shall be liable for any loss or damage that may arise from or in
connection with the use of this information.
Note: Please refer to the important `Stock Holding Disclosure' report on the Angel website (Research Section). Also, please refer to the
latest update on respective stocks for the disclosure status in respect of those stocks. Angel Broking Limited and its affiliates may have
investment positions in the stocks recommended in this report.
Research Team
Shardul Kulkarni
-
Head - Technicals
Sameet Chavan
-
Technical Analyst
Sacchitanand Uttekar
-
Technical Analyst
Ankur Lakhotia
-
Technical Analyst
Angel Broking Pvt. Ltd.
Registered Office: G-1, Ackruti Trade Centre, Rd. No. 7, MIDC, Andheri (E), Mumbai - 400 093.
Corporate Office: 6th Floor, Ackruti Star, MIDC, Andheri (E), Mumbai - 400 093. Tel: (022) 30940000
Sebi Registration No: INB 010996539
4