Daily Technical Report
January 01, 2013
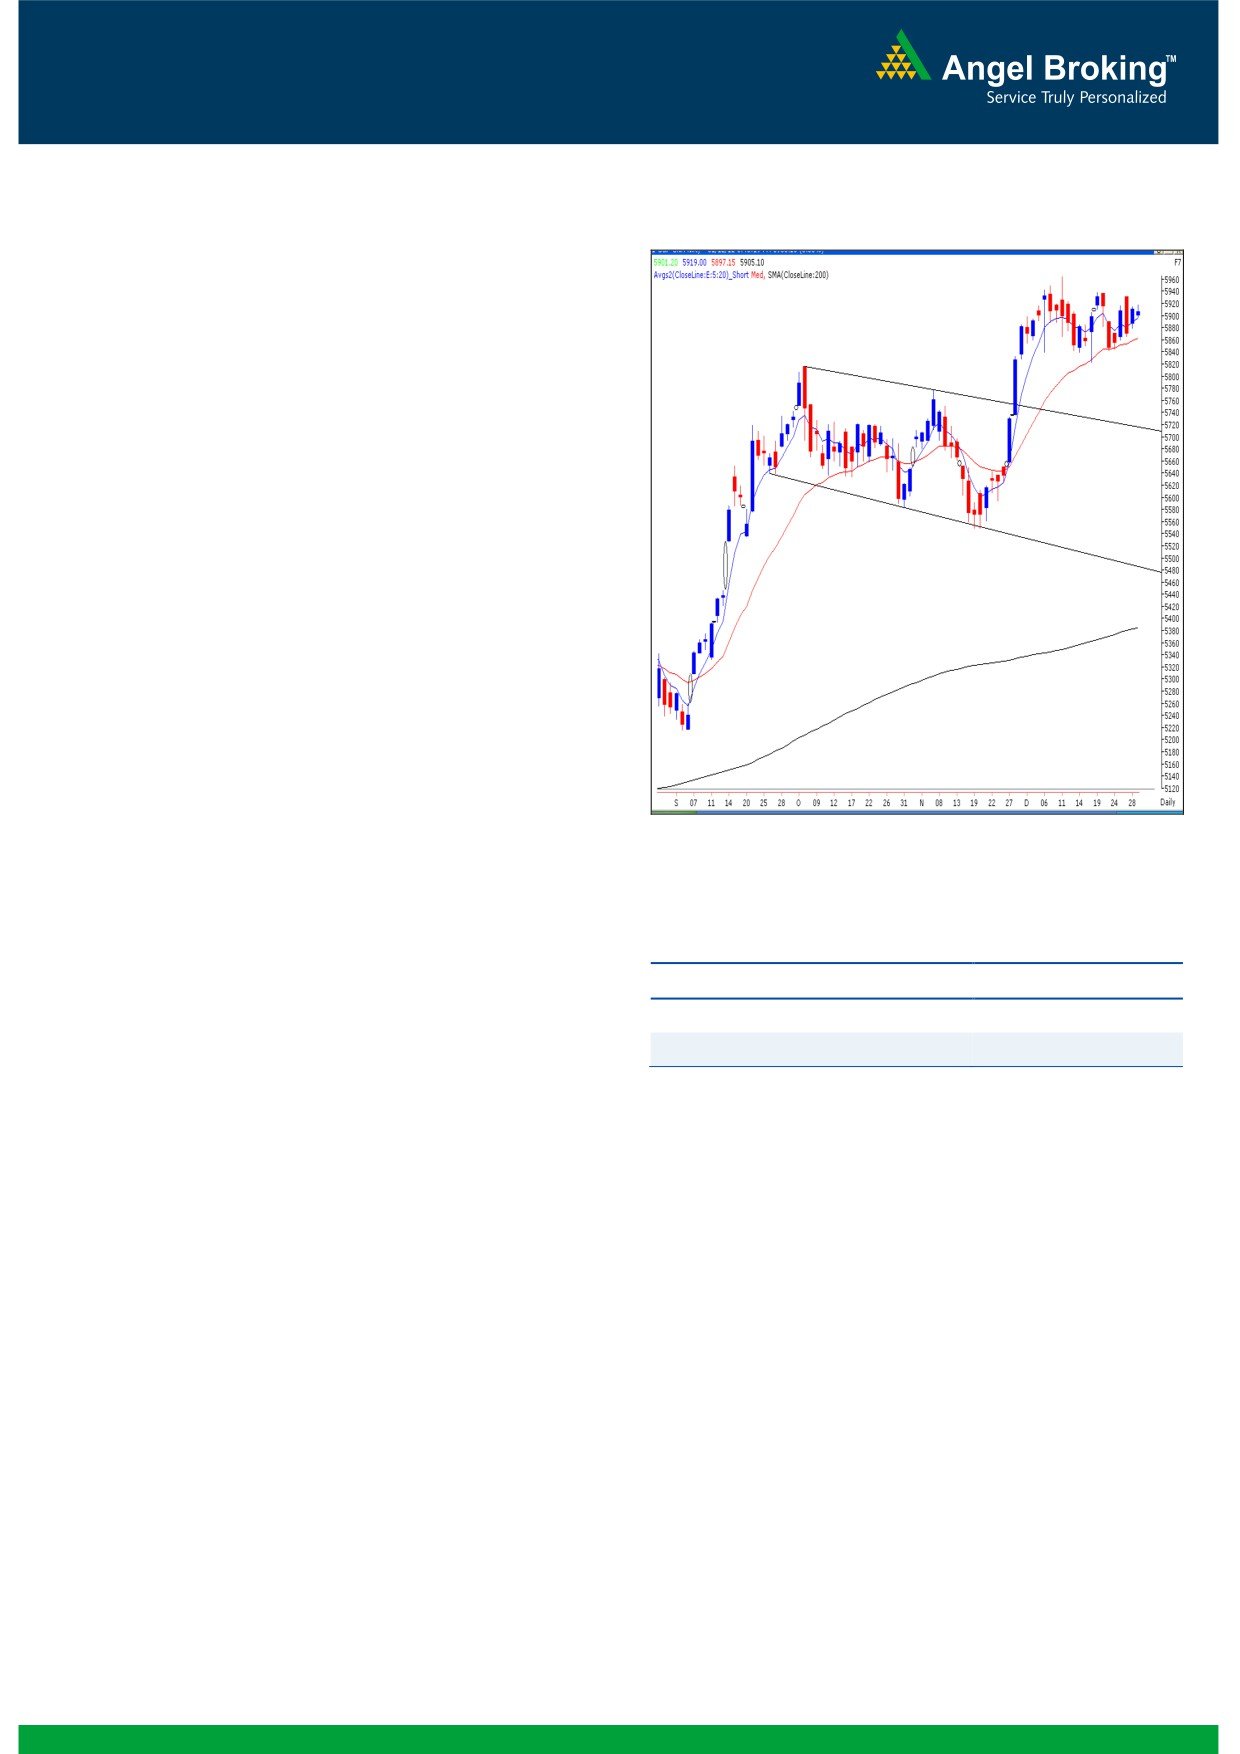
Exhibit 1: Nifty Daily Chart
Sensex (19427) / NIFTY (5905)
The last day of the year opened on a flat note in-line with
quiet global cues. The overall volumes remained below par
and indices traded in a very narrow range. During the
session, the Realty, Consumer Durables and PSU counters
showed some optimism; whereas the Capital Goods and
FMCG sectors ended with a nominal loss. The advance to
decline ratio was strongly in favor of advancing counters
Formation
The ’20-day EMA’ and the ’20-week EMA’ are placed at
19263 / 5859 and 18638 / 5662 levels, respectively.
On the weekly chart, we are witnessing a breakout from
‘Downward Sloping Trend Line’ joining two significant
swing highs of 19811 / 5944 (April 2011) and 19137 /
5815 (Oct 2012) at 19050 / 5800 level.
The 38.20% and 50% Fibonacci retracement levels of
the rise from 18255 / 5548 (low on November 20,
Source: Falcon:
2012) to 19612 / 5965 (high on December 11, 2012)
are at 19100 - 18930 / 5806 - 5755, respectively.
Trading strategy:
Actionable points:
Indices spent whole trading session oscillating less than half
View for the day
Neutral
a percent range. This was mainly on the back of very low
volumes. Since, there is no major change in the price
Resistance Levels
5931 - 5965
structure; we reiterate our view that only a sustainable
Support Levels
5860 - 5843
breakout on either side from the trading range of 19613 /
5965 - 19149 / 5823 would give a clear direction for the
Considering the overall weekly chart structure we continue to
near term. A move beyond 19613 / 5965 level would result
remain positive on the market and any corrective move towards
in an extended rally towards 20050 - 20218 / 6000 - 6070
19000 - 18900 / 5800 - 5750 levels should be used by
levels. Conversely, a closing below the lower range of 19149
positional traders as a buying opportunity.
/ 5823 may trigger short term pessimism in the market. In
such a scenario, we may witness a correction towards 19100
We wish all traders and investors a happy and profitable 2013.
- 18930 / 5806 - 5755. These levels are the 38.20% and
50% Fibonacci retracement levels of the rise from 18255 /
5548 (low on November 20, 2012) to 19612 / 5965 (high
on December 11, 2012), respectively.
1
Daily Technical Report
January 01, 2013
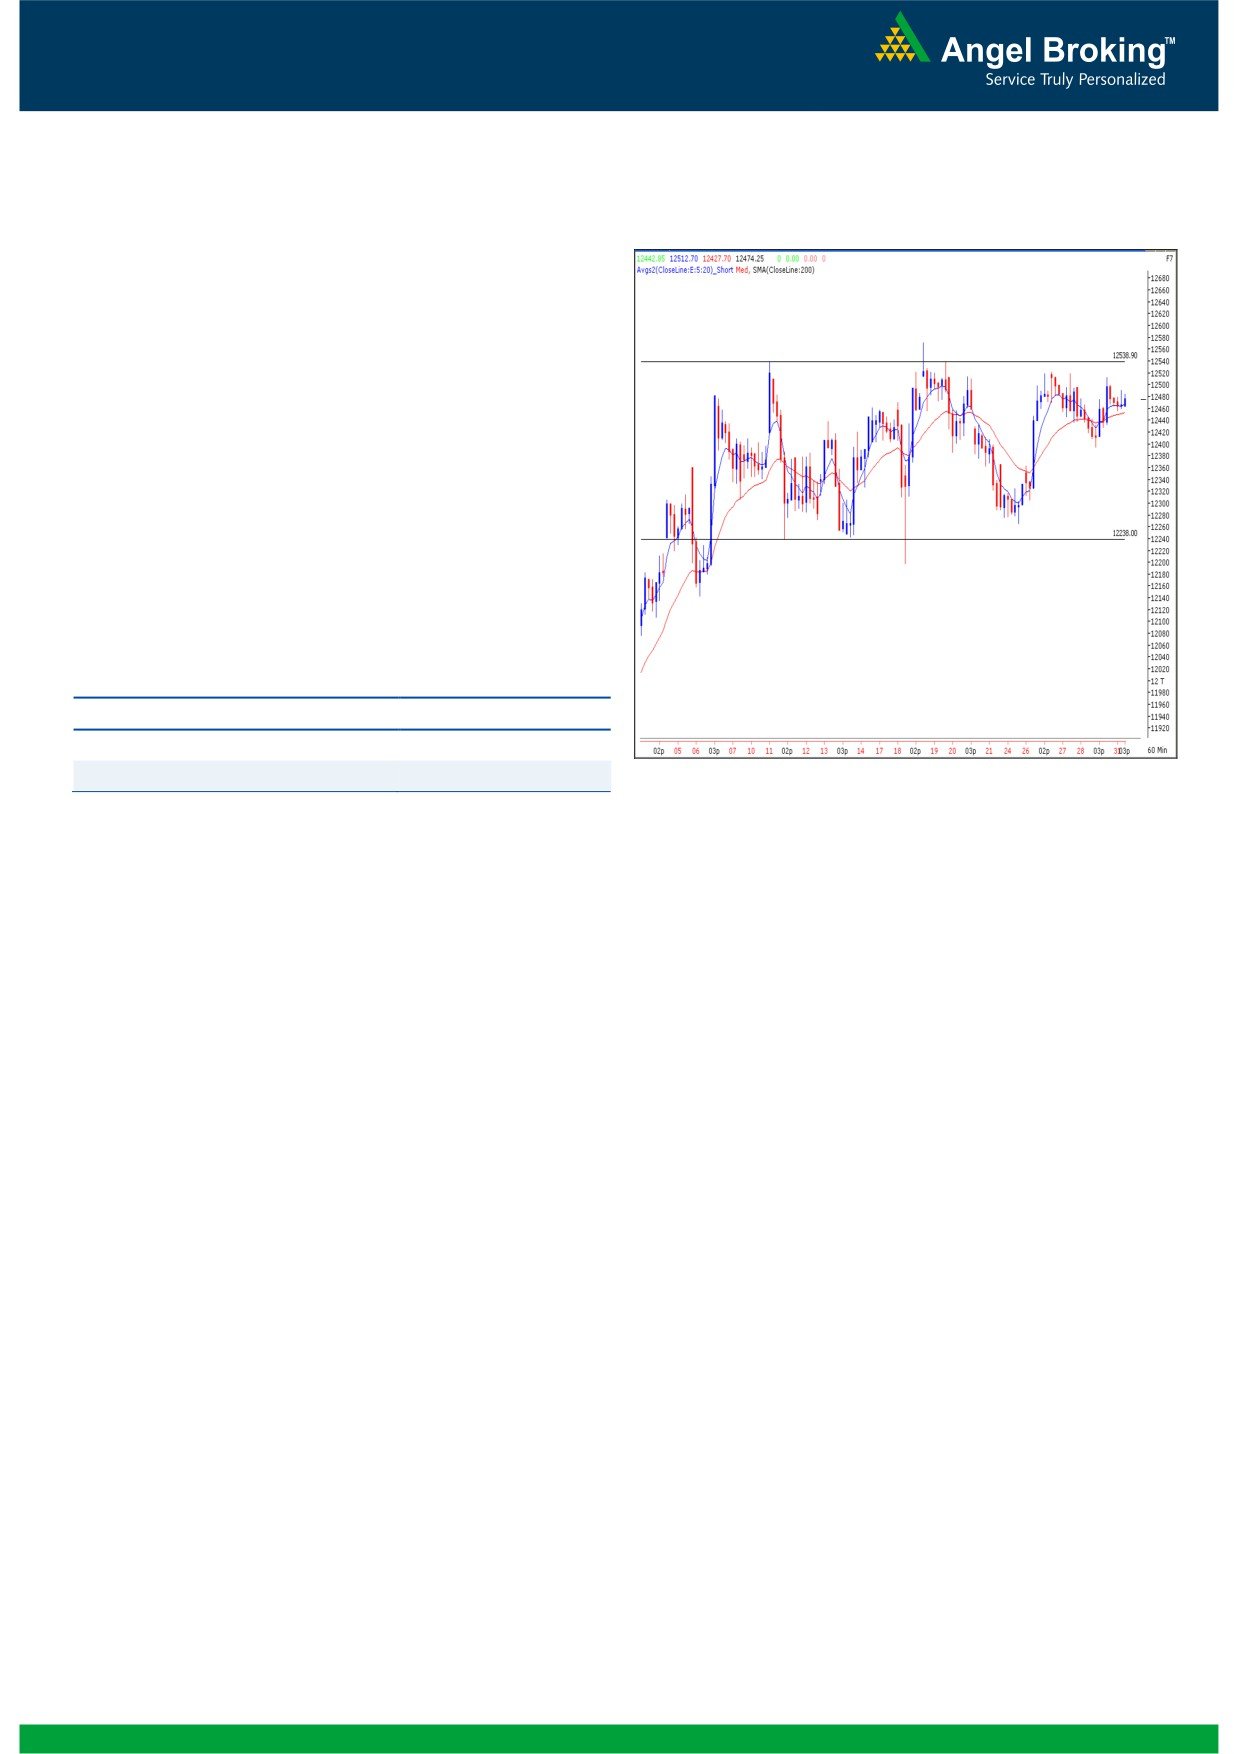
Exhibit 2: Bank Nifty Hourly Chart
Bank Nifty Outlook - (12474)
Yesterday, in line with the Benchmark Indices, the Bank Nifty
too opened on a flat and traded in a narrow range
throughout the session. For the third consecutive session the
index consolidated in a minor range and formed another
narrow range body. The index continues to trade in the
mentioned range of 12568 - 12197. As there is no change
chart structure we reiterate our view that if the index sustains
above 12540 level it is likely to rally towards 12654 - 12760
levels. On the downside 12427 - 1294 levels are likely to act
as support for the day.
Actionable points:
View for the day
Positive Above 12540
Expected targets
12654 - 12760
Support Levels
12394 - 12363
Source: Falcon:
2
Daily Technical Report
January 01, 2013
Research Team Tel: 022 - 39357800
DISCLAIMER
This document is solely for the personal information of the recipient, and must not be singularly used as the basis of any investment
decision. Nothing in this document should be construed as investment or financial advice. Each recipient of this document should make
such investigations as they deem necessary to arrive at an independent evaluation of an investment in the securities of the companies
referred to in this document (including the merits and risks involved), and should consult their own advisors to determine the merits and
risks of such an investment.
Angel Broking Limited, its affiliates, directors, its proprietary trading and investment businesses may, from time to time, make
investment decisions that are inconsistent with or contradictory to the recommendations expressed herein. The views contained in this
document are those of the analyst, and the company may or may not subscribe to all the views expressed within.
Reports based on technical and derivative analysis center on studying charts of a stock's price movement, outstanding positions and
trading volume, as opposed to focusing on a company's fundamentals and, as such, may not match with a report on a company's
fundamentals.
The information in this document has been printed on the basis of publicly available information, internal data and other reliable
sources believed to be true, but we do not represent that it is accurate or complete and it should not be relied on as such, as this
document is for general guidance only. Angel Broking Limited or any of its affiliates/ group companies shall not be in any way
responsible for any loss or damage that may arise to any person from any inadvertent error in the information contained in this report.
Angel Broking Limited has not independently verified all the information contained within this document. Accordingly, we cannot testify,
nor make any representation or warranty, express or implied, to the accuracy, contents or data contained within this document. While
Angel Broking Limited endeavours to update on a reasonable basis the information discussed in this material, there may be regulatory,
compliance, or other reasons that prevent us from doing so.
This document is being supplied to you solely for your information, and its contents, information or data may not be reproduced,
redistributed or passed on, directly or indirectly.
Angel Broking Limited and its affiliates may seek to provide or have engaged in providing corporate finance, investment banking or
other advisory services in a merger or specific transaction to the companies referred to in this report, as on the date of this report or in
the past.
Neither Angel Broking Limited, nor its directors, employees or affiliates shall be liable for any loss or damage that may arise from or in
connection with the use of this information.
Note: Please refer to the important `Stock Holding Disclosure' report on the Angel website (Research Section). Also, please refer to the
latest update on respective stocks for the disclosure status in respect of those stocks. Angel Broking Limited and its affiliates may have
investment positions in the stocks recommended in this report.
Research Team
Shardul Kulkarni
-
Head - Technicals
Sameet Chavan
-
Technical Analyst
Sacchitanand Uttekar
-
Technical Analyst
Mehul Kothari
-
Technical Analyst
Ankur Lakhotia
-
Technical Analyst
Angel Broking Pvt. Ltd.
Registered Office: G-1, Ackruti Trade Centre, Rd. No. 7, MIDC, Andheri (E), Mumbai - 400 093.
Corporate Office: 6th Floor, Ackruti Star, MIDC, Andheri (E), Mumbai - 400 093. Tel: (022) 3952 6600
Sebi Registration No: INB 010996539
4