Daily Technical Report
July 22 , 2013
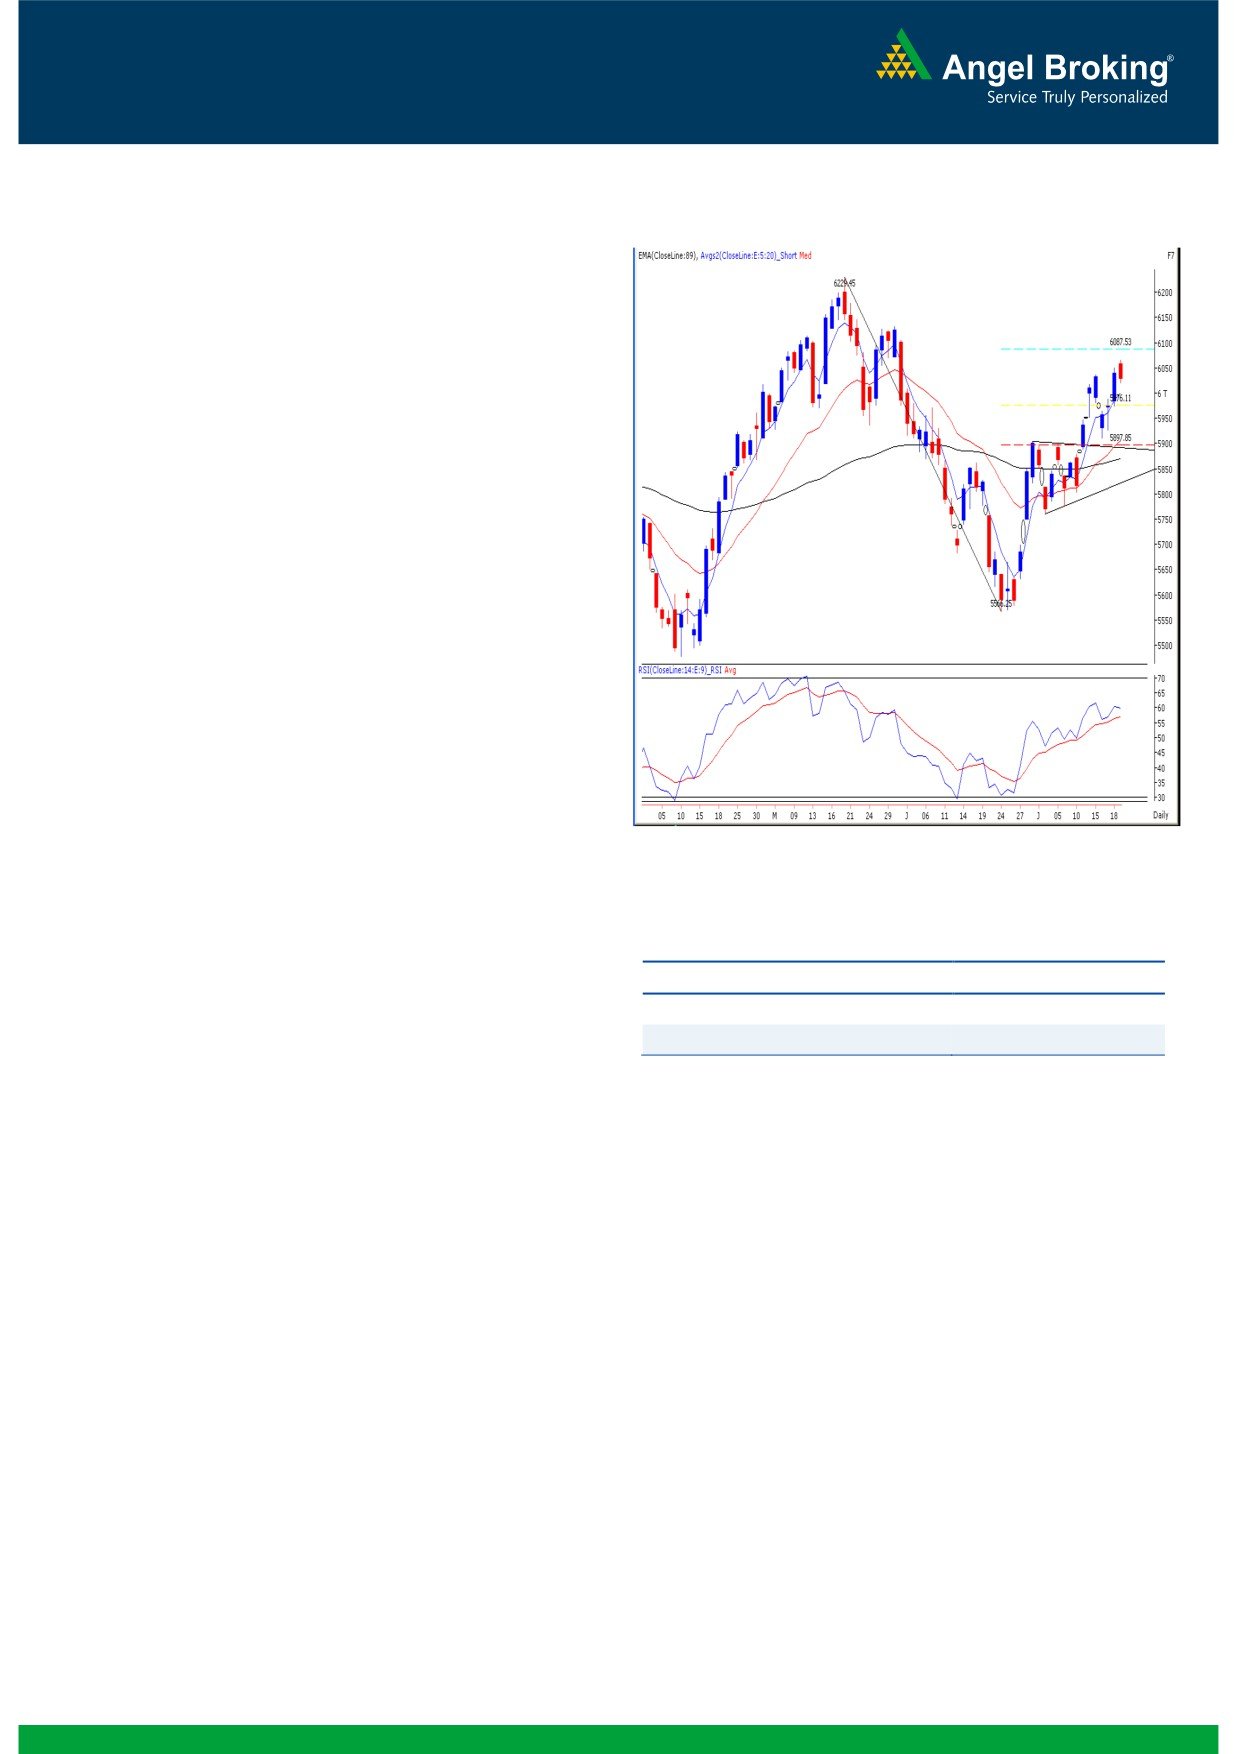
Exhibit 1: Nifty Daily Chart
Sensex (20150) / NIFTY (6029)
Yesterday, our benchmark indices opened slightly on the
higher side considering mixed global cues. During the first
half, indices traded within a narrow band. However, we
witnessed minor profit booking towards the fag end of the
session, which led to a close in negative territory. During the
session, the IT, Auto and Oil & gas counters remained in the
positive territory; whereas the Capital Goods, Banking and
Realty sectors once again ended on a pessimistic note. The
Advance to Decline ratio was in favor of declining counters.
Formation
The ’89-day EMA’ and the ’89-week EMA’ are placed at
19423/ 5870 and 18568 / 5616 levels, respectively.
The ’20-day EMA’ and the ‘20-week EMA’ are placed at
19632 / 5906 and 19462 / 5882, respectively.
The weekly momentum oscillators are still positively
poised.
Source: Falcon:
The 78.60% Fibonacci retracement level of the fall from
20444 / 6229 to 18467/ 5566 is placed at 20021 /
6088.
Actionable points:
Trading strategy:
View
Neutral
The market has ended in the positive territory for the fourth
Resistance Levels
6067 - 6088
consecutive week, although the movement was slightly range
Support Levels
6020 - 5974
bound as compared to the previous week. In-line with our
expectation mentioned in the previous weekly report, our
benchmark indices have almost met our mentioned targets
of the 78.60% Fibonacci retracement level of the fall from
20444 / 6229 to 18467 / 5566 which is placed at 20021 /
6088 (the Sensex has even crossed the
20021 level).
Considering the current momentum and the positive
placement of weekly momentum oscillators, we expect our
benchmark indices to test 20308 - 20444 / 6134 - 6230 if
they sustain above this week’s high of 20257 / 6067. On the
flipside, the concluded week’s low of 19649 / 5910 would
act as a crucial support in the coming trading sessions. Any
sustainable move below this level would apply brakes on the
current optimism. The bellwether indices might then test the
daily ’89-EMA’ level of 19423 / 5870. Traders should take
note that the benchmark indices are being led by a small list
of stocks which have a significant weight on the benchmark
indices.
1
Daily Technical Report
July 22, 2013
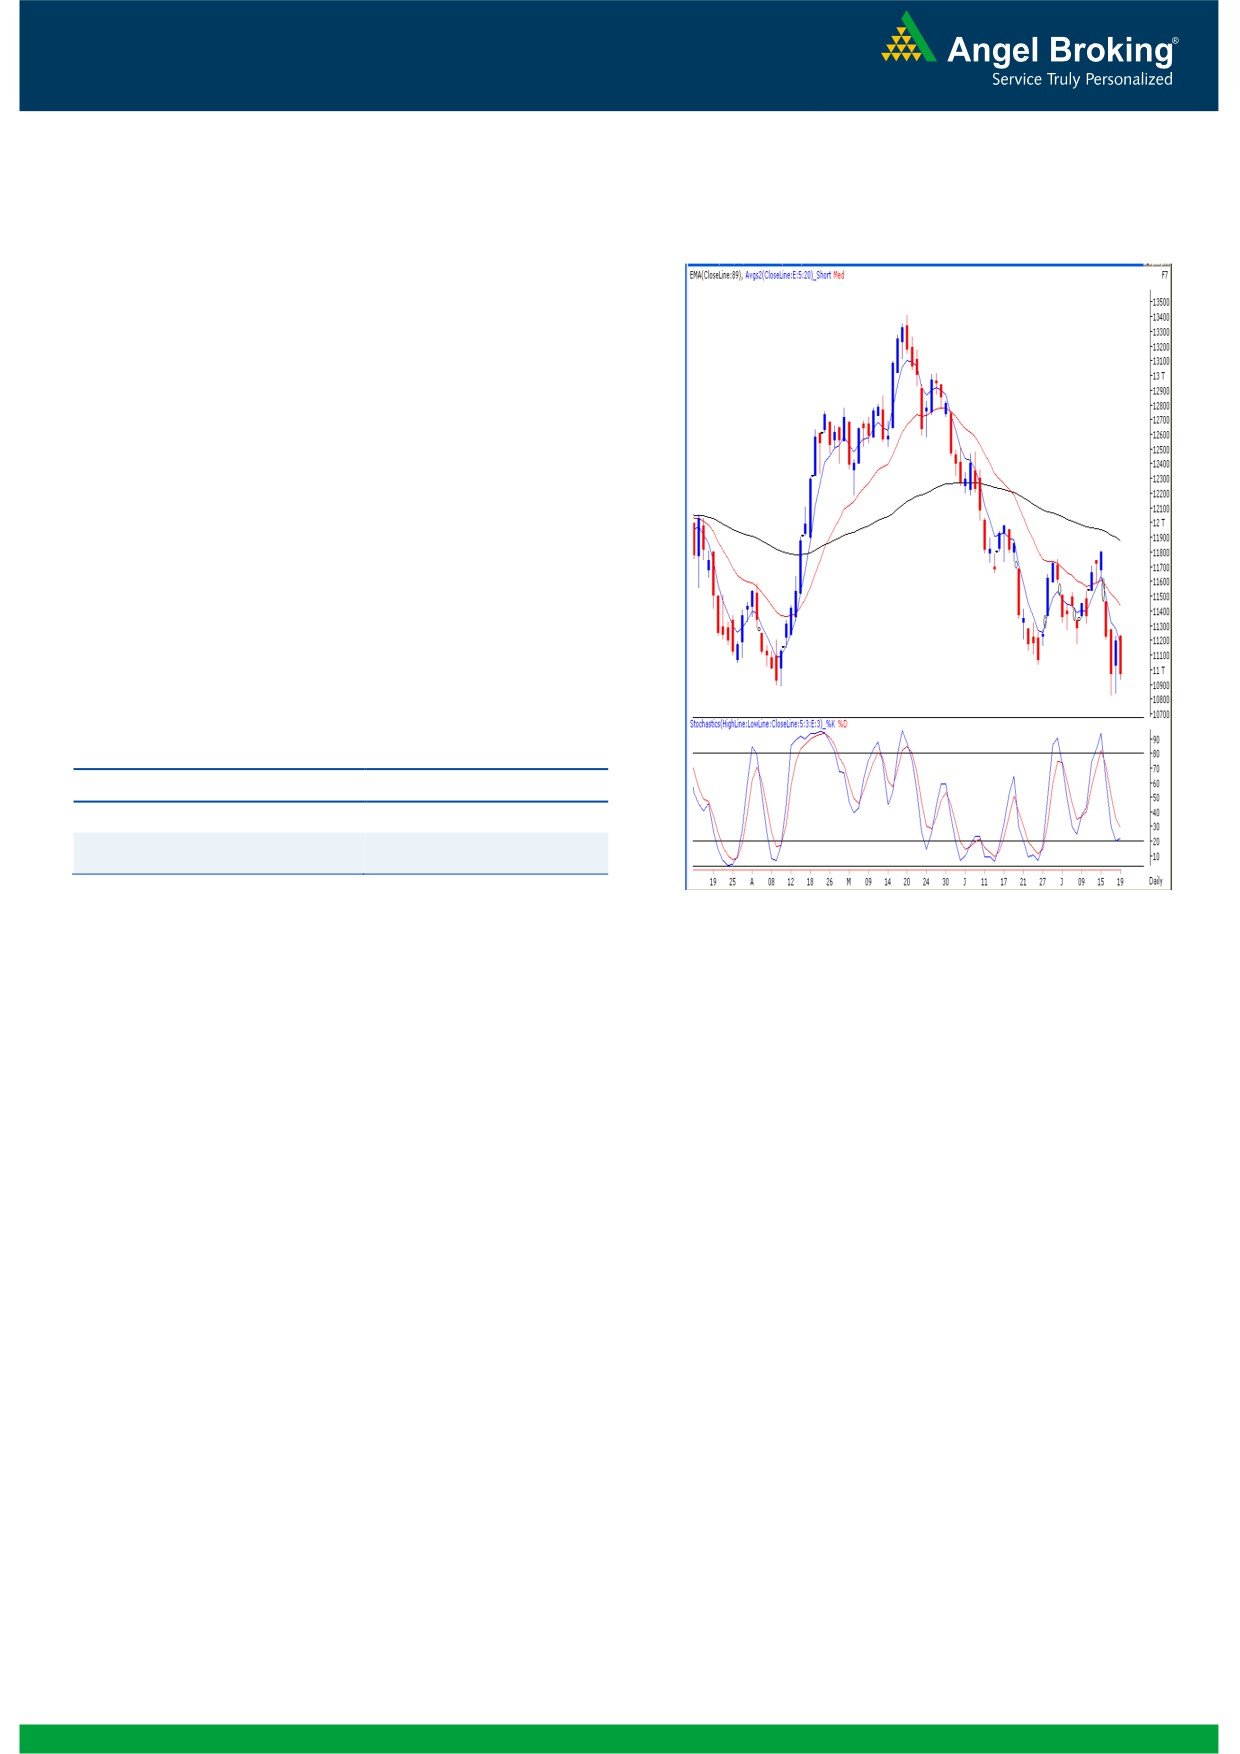
Exhibit 2: Bank Nifty Daily Chart
Bank Nifty Outlook - (10974)
On Friday, the Bank Nifty too opened marginally higher in-
line with our benchmark indices. However, the index could
not manage to hold its previous day’s gains and immediately
headed lower to end the session with more than two percent
loss. The Bank Nifty chart structure is quite contradictory to
our benchmark indices. Any attempt of a recovery by the bulls
is met with supply pressure. Going forward, Wednesday’s low
of
10829 is the key support for the Bank Nifty. Any
sustainable move below this level may open up the
possibilities for new ’52-Week Lows’. In this scenario, it may
initially test 10782 - 10640 levels. On the flip side, the Bank
Nifty must first close above 11264 to indicate any signs of
recovery.
Actionable points:
View
Neutral
Resistance Level
11264
Support Levels
10829 - 10782
Source: Falcon:
2
Daily Technical Report
July 22, 2013
Daily Pivot Levels for Nifty 50 Stocks
SCRIPS
S2
S1
PIVOT
R1
R2
SENSEX
20,027
20,088
20,173
20,234
20,318
NIFTY
5,992
6,011
6,039
6,057
6,085
BANKNIFTY
10,745
10,859
11,049
11,163
11,352
ACC
1,250
1,263
1,274
1,286
1,297
AMBUJACEM
202
204
208
211
214
ASIANPAINT
5,090
5,128
5,188
5,225
5,285
AXISBANK
1,142
1,167
1,210
1,235
1,278
BAJAJ-AUTO
1,814
1,890
1,939
2,015
2,064
BANKBARODA
547
559
568
580
588
BHARTIARTL
312
321
327
336
343
BHEL
161
167
179
185
196
BPCL
337
342
346
350
354
CAIRN
302
305
308
311
314
CIPLA
404
410
414
420
424
COALINDIA
289
293
295
300
302
DLF
162
165
170
173
178
DRREDDY
2,301
2,323
2,344
2,367
2,388
GAIL
316
325
330
338
343
GRASIM
2,767
2,792
2,809
2,833
2,850
HCLTECH
849
870
889
911
929
HDFC
766
784
808
827
851
HDFCBANK
663
671
682
690
701
HEROMOTOCO
1,703
1,738
1,766
1,801
1,830
HINDALCO
102
103
104
105
106
HINDUNILVR
661
673
691
704
722
ICICIBANK
933
946
967
981
1,002
IDFC
121
124
126
128
131
INDUSINDBK
425
435
450
460
475
INFY
2,776
2,812
2,838
2,874
2,900
ITC
362
366
369
372
375
JINDALSTEL
200
205
212
217
223
JPASSOCIAT
48
49
50
51
52
KOTAKBANK
669
680
697
708
725
LT
953
963
976
987
1,000
LUPIN
883
891
899
908
916
M&M
852
866
882
896
912
MARUTI
1,419
1,435
1,449
1,465
1,478
NMDC
104
106
107
109
110
NTPC
140
142
145
147
149
ONGC
309
313
316
320
324
PNB
611
621
632
642
653
POWERGRID
110
111
111
112
112
RANBAXY
311
318
328
335
346
RELIANCE
907
915
922
930
936
RELINFRA
370
379
388
396
405
SBIN
1,783
1,797
1,813
1,827
1,843
SESAGOA
140
143
148
151
156
SUNPHARMA
1,041
1,060
1,093
1,113
1,146
TATAMOTORS
282
289
293
299
304
TATAPOWER
90
91
92
93
94
TATASTEEL
235
238
243
246
251
TCS
1,675
1,709
1,734
1,768
1,793
ULTRACEMCO
1,900
1,915
1,925
1,940
1,950
3
Daily Technical Report
July 22, 2013
Research Team Tel: 022 - 30940000
DISCLAIMER
This document is solely for the personal information of the recipient, and must not be singularly used as the basis of any investment
decision. Nothing in this document should be construed as investment or financial advice. Each recipient of this document should make
such investigations as they deem necessary to arrive at an independent evaluation of an investment in the securities of the companies
referred to in this document (including the merits and risks involved), and should consult their own advisors to determine the merits and
risks of such an investment.
Angel Broking Pvt. Limited, its affiliates, directors, its proprietary trading and investment businesses may, from time to time, make
investment decisions that are inconsistent with or contradictory to the recommendations expressed herein. The views contained in this
document are those of the analyst, and the company may or may not subscribe to all the views expressed within.
Reports based on technical and derivative analysis center on studying charts of a stock's price movement, outstanding positions and
trading volume, as opposed to focusing on a company's fundamentals and, as such, may not match with a report on a company's
fundamentals.
The information in this document has been printed on the basis of publicly available information, internal data and other reliable
sources believed to be true, but we do not represent that it is accurate or complete and it should not be relied on as such, as this
document is for general guidance only. Angel Broking Pvt. Limited or any of its affiliates/ group companies shall not be in any way
responsible for any loss or damage that may arise to any person from any inadvertent error in the information contained in this report.
Angel Broking Pvt. Limited has not independently verified all the information contained within this document. Accordingly, we cannot
testify, nor make any representation or warranty, express or implied, to the accuracy, contents or data contained within this document.
While Angel Broking Pvt. Limited endeavours to update on a reasonable basis the information discussed in this material, there may be
regulatory, compliance, or other reasons that prevent us from doing so.
This document is being supplied to you solely for your information, and its contents, information or data may not be reproduced,
redistributed or passed on, directly or indirectly.
Angel Broking Pvt. Limited and its affiliates may seek to provide or have engaged in providing corporate finance, investment banking
or other advisory services in a merger or specific transaction to the companies referred to in this report, as on the date of this report or
in the past.
Neither Angel Broking Pvt. Limited, nor its directors, employees or affiliates shall be liable for any loss or damage that may arise from
or in connection with the use of this information.
Note: Please refer to the important `Stock Holding Disclosure' report on the Angel website (Research Section). Also, please refer to the
latest update on respective stocks for the disclosure status in respect of those stocks. Angel Broking Pvt. Limited and its affiliates may
have investment positions in the stocks recommended in this report.
Research Team
Shardul Kulkarni
-
Head - Technicals
Sameet Chavan
Technical Analyst
Sacchitanand Uttekar
-
Technical Analyst
Angel Broking Pvt. Ltd.
Registered Office: G-1, Ackruti Trade Centre, Rd. No. 7, MIDC, Andheri (E), Mumbai - 400 093.
Corporate Office: 6th Floor, Ackruti Star, MIDC, Andheri (E), Mumbai - 400 093. Tel: (022) 30940000
Sebi Registration No: INB 010996539
4