Daily Technical Report
July 18 , 2013
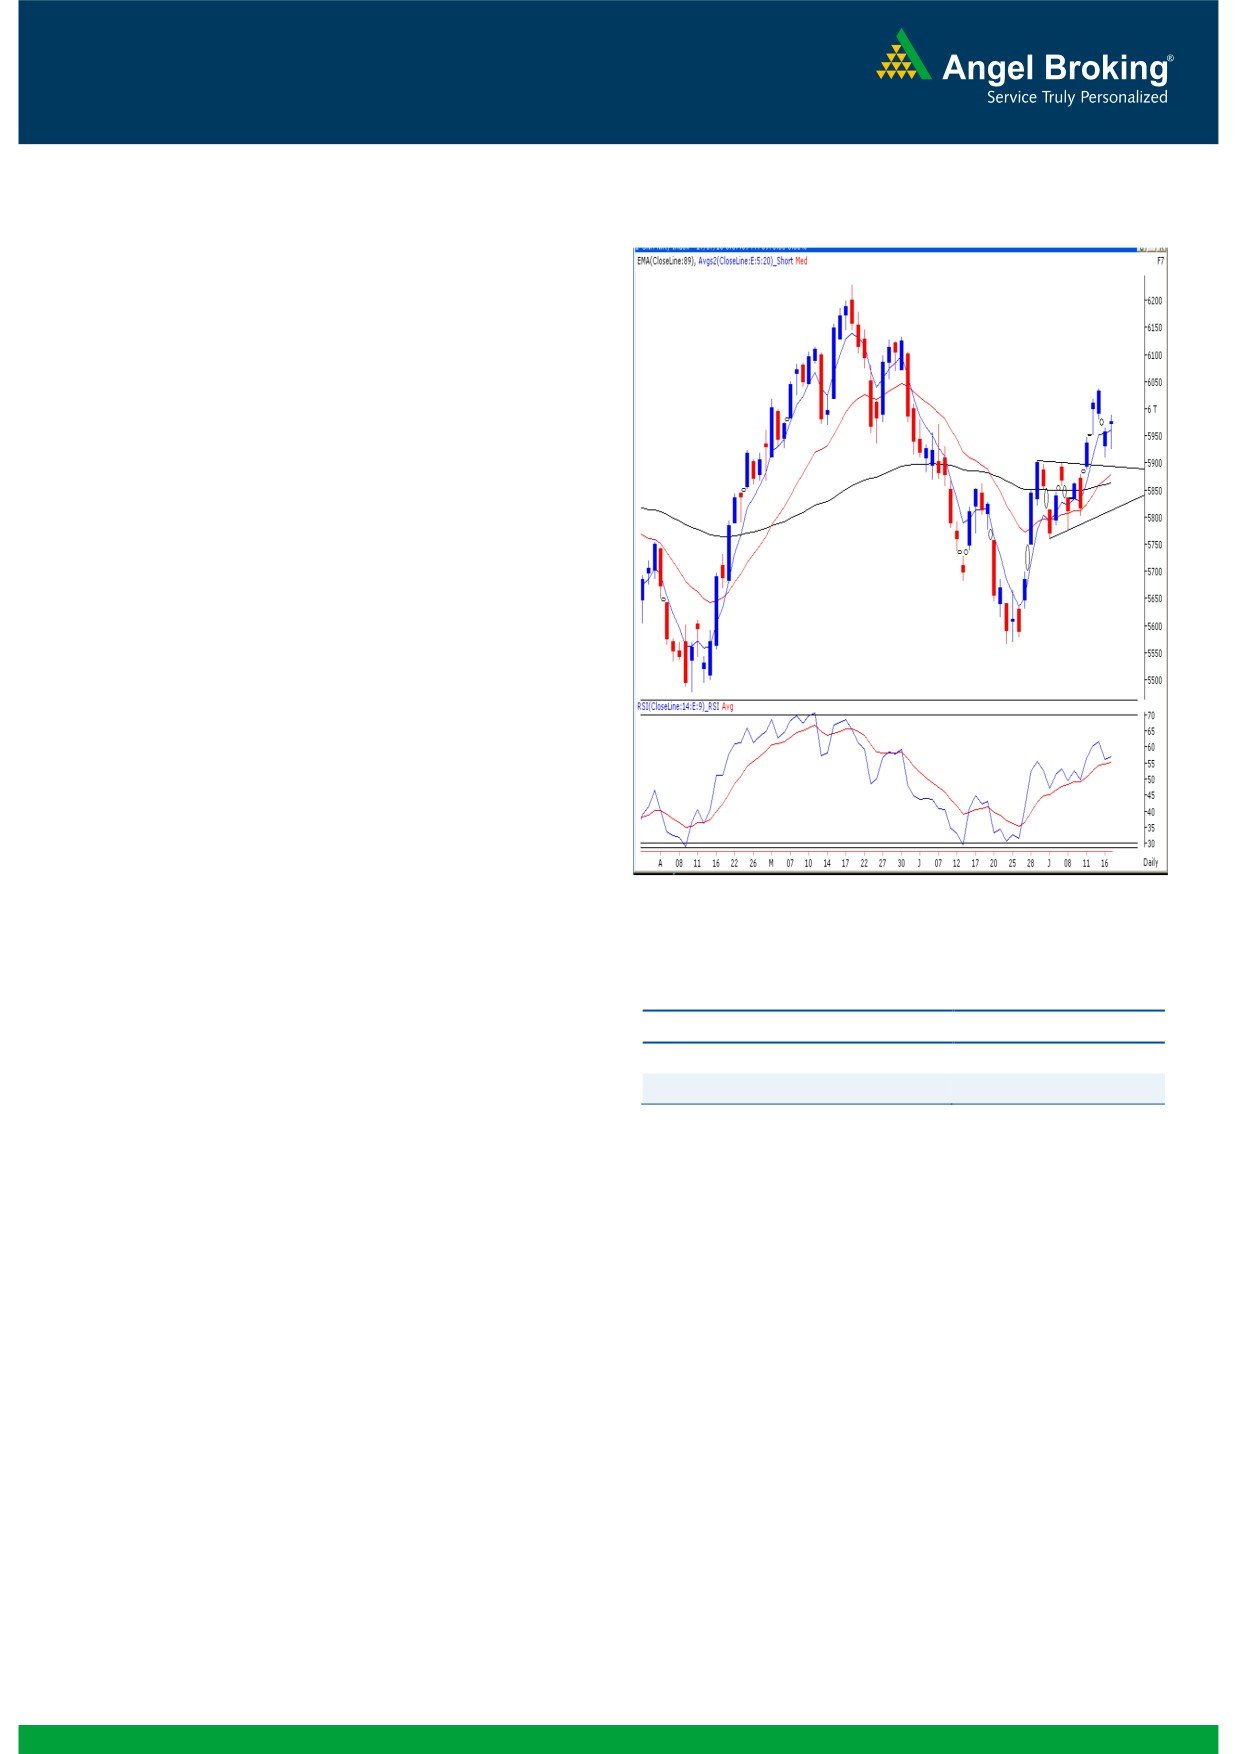
Exhibit 1: Nifty Daily Chart
Sensex (19949) / NIFTY (5973)
Yesterday, our benchmark indices opened marginally higher
in-line with quiet global cues. Indices then moved within the
narrow range throughout the first half and eventually slipped
nearly a percent lower immediately post midsession.
However, buying in defensive counters pulled indices higher
from the negative territory. Undoubtedly the session was
dominated by FMCG counters, HUL and ITC. The Consumer
Durables and IT counters too supported the Index; whereas
the Banking, Metal and Auto sectors were continued to show
significant weakness. The Advance to Decline ratio was in
favor of declining counters. (A=992 D=1322) (Source-
Formation
The ’89-day EMA’ and the ’89-week EMA’ are placed at
19391 / 5863 and 18564 / 5615 levels respectively.
The ’20-day EMA’ and the ‘20-week EMA’ are placed at
19519 / 5878 and 19443 / 5876, respectively.
The weekly ‘RSI’ and ‘Stochastic’ oscillators are positively
Source: Falcon:
poised.
The 61.8% and 78.60% Fibonacci retracement levels of
Actionable points:
the fall from 20444 / 6229 to 18467/ 5566 are placed
at 19689 / 5976 and 20021 / 6088, respectively.
View
Neutral
The daily chart depicts a ‘Bullish Pennant’ pattern
Support Levels
5904 - 5879
breakout.
Resistance Level
5990 - 6038
Trading strategy:
Yesterday’s price action can be perfectly described as a ‘Tug-
of-War’ between the bulls and the bears. Indices recovered
smartly after posting a low of 19778 / 5927. Going forward,
we continue to mention the trading range of 20073 / 6038
to 19640 / 5904. Yesterday’s high of 19983 / 5990 would
act as an immediate intraday resistance for our market. For
any higher targets, indices need to break recent high of
20063 / 6038 which would push indices towards the near
term target of 20200 / 6088. On the flipside, 19640 -
19505 / 5904 - 5879 remains to be a strong support band
for our market. A fall below these levels would mean that all
long positions should be squared off as further lower levels
may be eventually tested. We reiterate that traders should
stick to individual stocks movement and avoid taking undue
risks.
1
Daily Technical Report
July 18, 2013
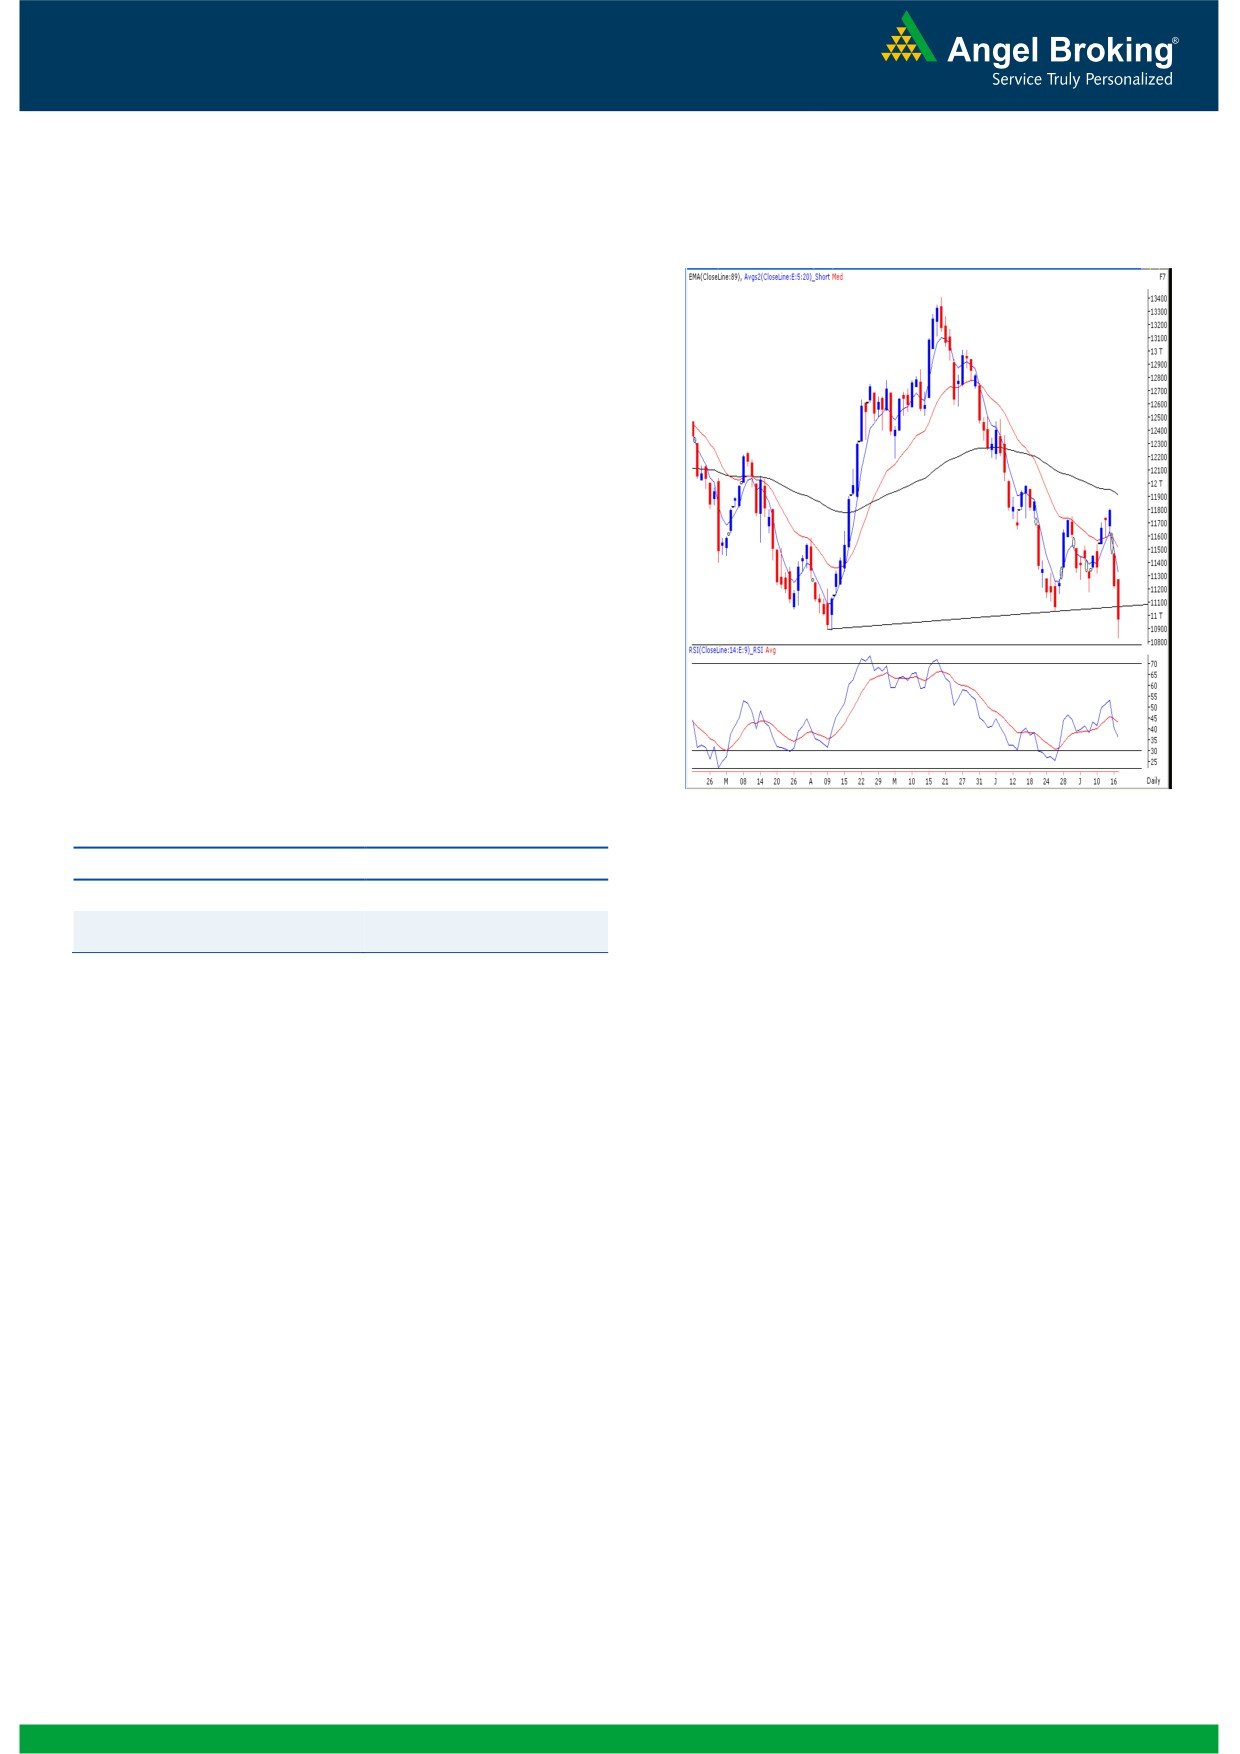
Exhibit 2: Bank Nifty Daily Chart
Bank Nifty Outlook - (10972)
Yesterday, the Bank Nifty too opened slightly higher in-line
with our benchmark indices but traded with strong pessimism
throughout the session. As expected and mentioned in
yesterday’s report, the index went on to test the recent bottom
of
11033 and even managed to close below the
psychological mark of 11000. On the daily chart, we are now
observing that the Bank Nifty has broken down from the
‘Upward Sloping Trend Line’ drawn by joining 10888 (low on
April 10, 2013) and 11033 (low on June 26, 2013). Hence,
going forward, if Bank Nifty sustains below yesterday’s low of
10829, then it may slide further to test 10782 - 10640 levels.
On the upside,
11033
-
11264 levels would act as
immediate resistance for Bank Nifty in coming trading
session.
Actionable points:
Source: Falcon:
View
Bearish below 10829
Expected targets
10782 - 10640
Resistance Level
11264
2
Daily Technical Report
July 18, 2013
Daily Pivot Levels for Nifty 50 Stocks
SCRIPS
S2
S1
PIVOT
R1
R2
SENSEX
19,699
19,824
19,903
20,028
20,108
NIFTY
5,900
5,937
5,963
6,000
6,026
BANKNIFTY
10,588
10,780
11,022
11,214
11,456
ACC
1,244
1,259
1,272
1,287
1,300
AMBUJACEM
197
202
205
209
212
ASIANPAINT
4,737
4,874
4,953
5,091
5,170
AXISBANK
1,144
1,169
1,202
1,227
1,261
BAJAJ-AUTO
1,863
1,886
1,903
1,926
1,943
BANKBARODA
529
538
555
565
581
BHARTIARTL
303
310
319
325
334
BHEL
178
180
184
186
190
BPCL
328
335
342
349
355
CAIRN
287
291
298
302
308
CIPLA
394
400
406
412
417
COALINDIA
283
287
291
295
300
DLF
160
163
165
167
169
DRREDDY
2,275
2,293
2,313
2,331
2,351
GAIL
312
317
324
329
336
GRASIM
2,711
2,745
2,784
2,818
2,857
HCLTECH
864
869
879
885
894
HDFC
791
804
816
830
842
HDFCBANK
631
647
664
680
697
HEROMOTOCO
1,652
1,669
1,691
1,708
1,731
HINDALCO
99
100
102
104
106
HINDUNILVR
587
636
668
717
748
ICICIBANK
943
962
987
1,005
1,030
IDFC
121
124
127
130
133
INDUSINDBK
425
439
456
470
486
INFY
2,720
2,736
2,747
2,762
2,774
ITC
357
363
367
372
376
JINDALSTEL
206
210
215
219
224
JPASSOCIAT
48
49
51
52
53
KOTAKBANK
692
702
710
719
727
LT
945
957
972
983
998
LUPIN
865
870
876
881
887
M&M
843
868
901
926
960
MARUTI
1,387
1,404
1,418
1,435
1,450
NMDC
101
102
105
106
109
NTPC
142
145
147
150
152
ONGC
292
297
300
304
307
PNB
605
613
622
630
639
POWERGRID
109
110
111
112
113
RANBAXY
325
329
334
338
343
RELIANCE
897
906
912
921
927
RELINFRA
351
360
372
380
392
SBIN
1,763
1,785
1,812
1,834
1,861
SESAGOA
144
148
151
154
158
SUNPHARMA
1,086
1,099
1,115
1,129
1,145
TATAMOTORS
277
281
286
290
295
TATAPOWER
88
90
91
92
93
TATASTEEL
235
239
246
250
258
TCS
1,630
1,654
1,670
1,694
1,709
ULTRACEMCO
1,892
1,916
1,944
1,968
1,996
3
Daily Technical Report
July 18, 2013
Research Team Tel: 022 - 30940000
DISCLAIMER
This document is solely for the personal information of the recipient, and must not be singularly used as the basis of any investment
decision. Nothing in this document should be construed as investment or financial advice. Each recipient of this document should make
such investigations as they deem necessary to arrive at an independent evaluation of an investment in the securities of the companies
referred to in this document (including the merits and risks involved), and should consult their own advisors to determine the merits and
risks of such an investment.
Angel Broking Pvt. Limited, its affiliates, directors, its proprietary trading and investment businesses may, from time to time, make
investment decisions that are inconsistent with or contradictory to the recommendations expressed herein. The views contained in this
document are those of the analyst, and the company may or may not subscribe to all the views expressed within.
Reports based on technical and derivative analysis center on studying charts of a stock's price movement, outstanding positions and
trading volume, as opposed to focusing on a company's fundamentals and, as such, may not match with a report on a company's
fundamentals.
The information in this document has been printed on the basis of publicly available information, internal data and other reliable
sources believed to be true, but we do not represent that it is accurate or complete and it should not be relied on as such, as this
document is for general guidance only. Angel Broking Pvt. Limited or any of its affiliates/ group companies shall not be in any way
responsible for any loss or damage that may arise to any person from any inadvertent error in the information contained in this report.
Angel Broking Pvt. Limited has not independently verified all the information contained within this document. Accordingly, we cannot
testify, nor make any representation or warranty, express or implied, to the accuracy, contents or data contained within this document.
While Angel Broking Pvt. Limited endeavours to update on a reasonable basis the information discussed in this material, there may be
regulatory, compliance, or other reasons that prevent us from doing so.
This document is being supplied to you solely for your information, and its contents, information or data may not be reproduced,
redistributed or passed on, directly or indirectly.
Angel Broking Pvt. Limited and its affiliates may seek to provide or have engaged in providing corporate finance, investment banking
or other advisory services in a merger or specific transaction to the companies referred to in this report, as on the date of this report or
in the past.
Neither Angel Broking Pvt. Limited, nor its directors, employees or affiliates shall be liable for any loss or damage that may arise from
or in connection with the use of this information.
Note: Please refer to the important `Stock Holding Disclosure' report on the Angel website (Research Section). Also, please refer to the
latest update on respective stocks for the disclosure status in respect of those stocks. Angel Broking Pvt. Limited and its affiliates may
have investment positions in the stocks recommended in this report.
Research Team
Shardul Kulkarni
-
Head - Technicals
Sameet Chavan
-
Technical Analyst
Sacchitanand Uttekar
-
Technical Analyst
Angel Broking Pvt. Ltd.
Registered Office: G-1, Ackruti Trade Centre, Rd. No. 7, MIDC, Andheri (E), Mumbai - 400 093.
Corporate Office: 6th Floor, Ackruti Star, MIDC, Andheri (E), Mumbai - 400 093. Tel: (022) 30940000
Sebi Registration No: INB 010996539
4