Daily Technical Report
July 16 , 2013
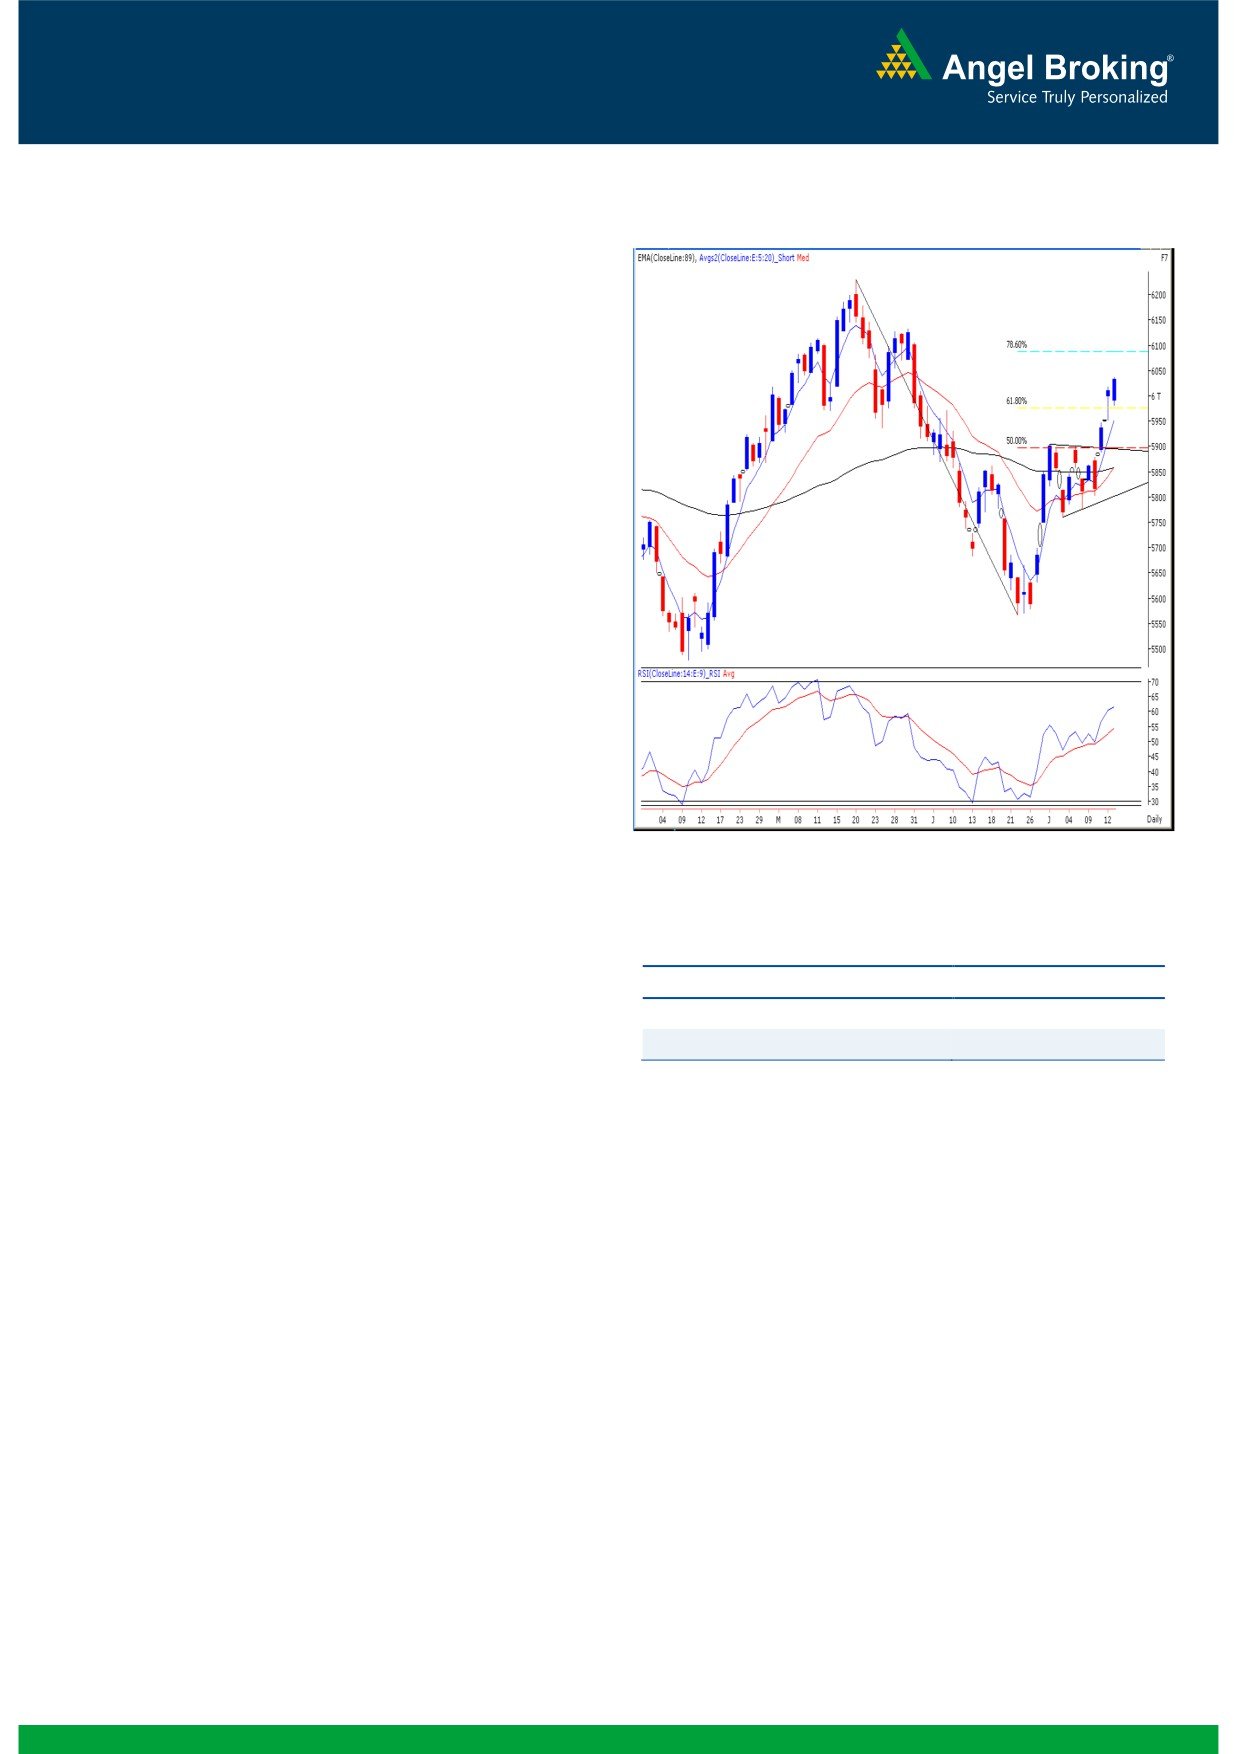
Exhibit 1: Nifty Daily Chart
Sensex (20034) / NIFTY (6031)
First day of the week began on a muted note in-line with
quiet trading mood across the globe. During the initial hour,
indices slipped marginally inside the negative territory but
eventually managed to recover from the lows and closed
with modest gains. The Realty, FMCG and Consumer
Durables counters were the front gainers; whereas the Power
and IT sectors remained under pressure throughout the day.
The Advance to Decline ratio was strongly in favor of
Advancing counters. (A=1316 D=991)
(Source-
Formation
The ’89-day EMA’ and the ’89-week EMA’ are placed at
19367 / 5858 and 18566 / 5616 levels respectively.
The ’20-day EMA’ and the ‘20-week EMA’ are placed at
19435 / 5859 and 19451 / 5882, respectively.
The weekly ‘RSI’ and ‘Stochastic’ oscillators are positively
poised.
Source: Falcon:
The 61.8% and 78.60% Fibonacci retracement levels of
the fall from 20444 / 6229 to 18467/ 5566 are placed
Actionable points:
at 19689 / 5976 and 20021 / 6088, respectively.
View
Neutral
The daily chart depicts a ‘Bullish Pennant’ pattern
Support Levels
5980 - 5951
breakout.
Resistance Level
6038 - 6088
Trading strategy:
Yesterday, indices maintained their positive momentum after
crossing Friday’s high of 19992 / 6019 and closed almost at
the highest point of the day. Considering yesterday’s price
action and the overbought conditions of the “Stochastic”
oscillator, some profit booking may be seen in today’s
trading session. On the downside, 19883 - 19785 / 5980 -
5951 remains to be key support levels for our market. A fall
and close below this level would be a sign that the short term
uptrend is under threat. As expected and mentioned in our
previous reports, we have witnessed stock specific movement
in many individual counters and this is likely to continue in
coming trading session. Thus, we advise traders to adopt a
stock-centric approach and avoid taking undue risks.
1
Daily Technical Report
July 16, 2013
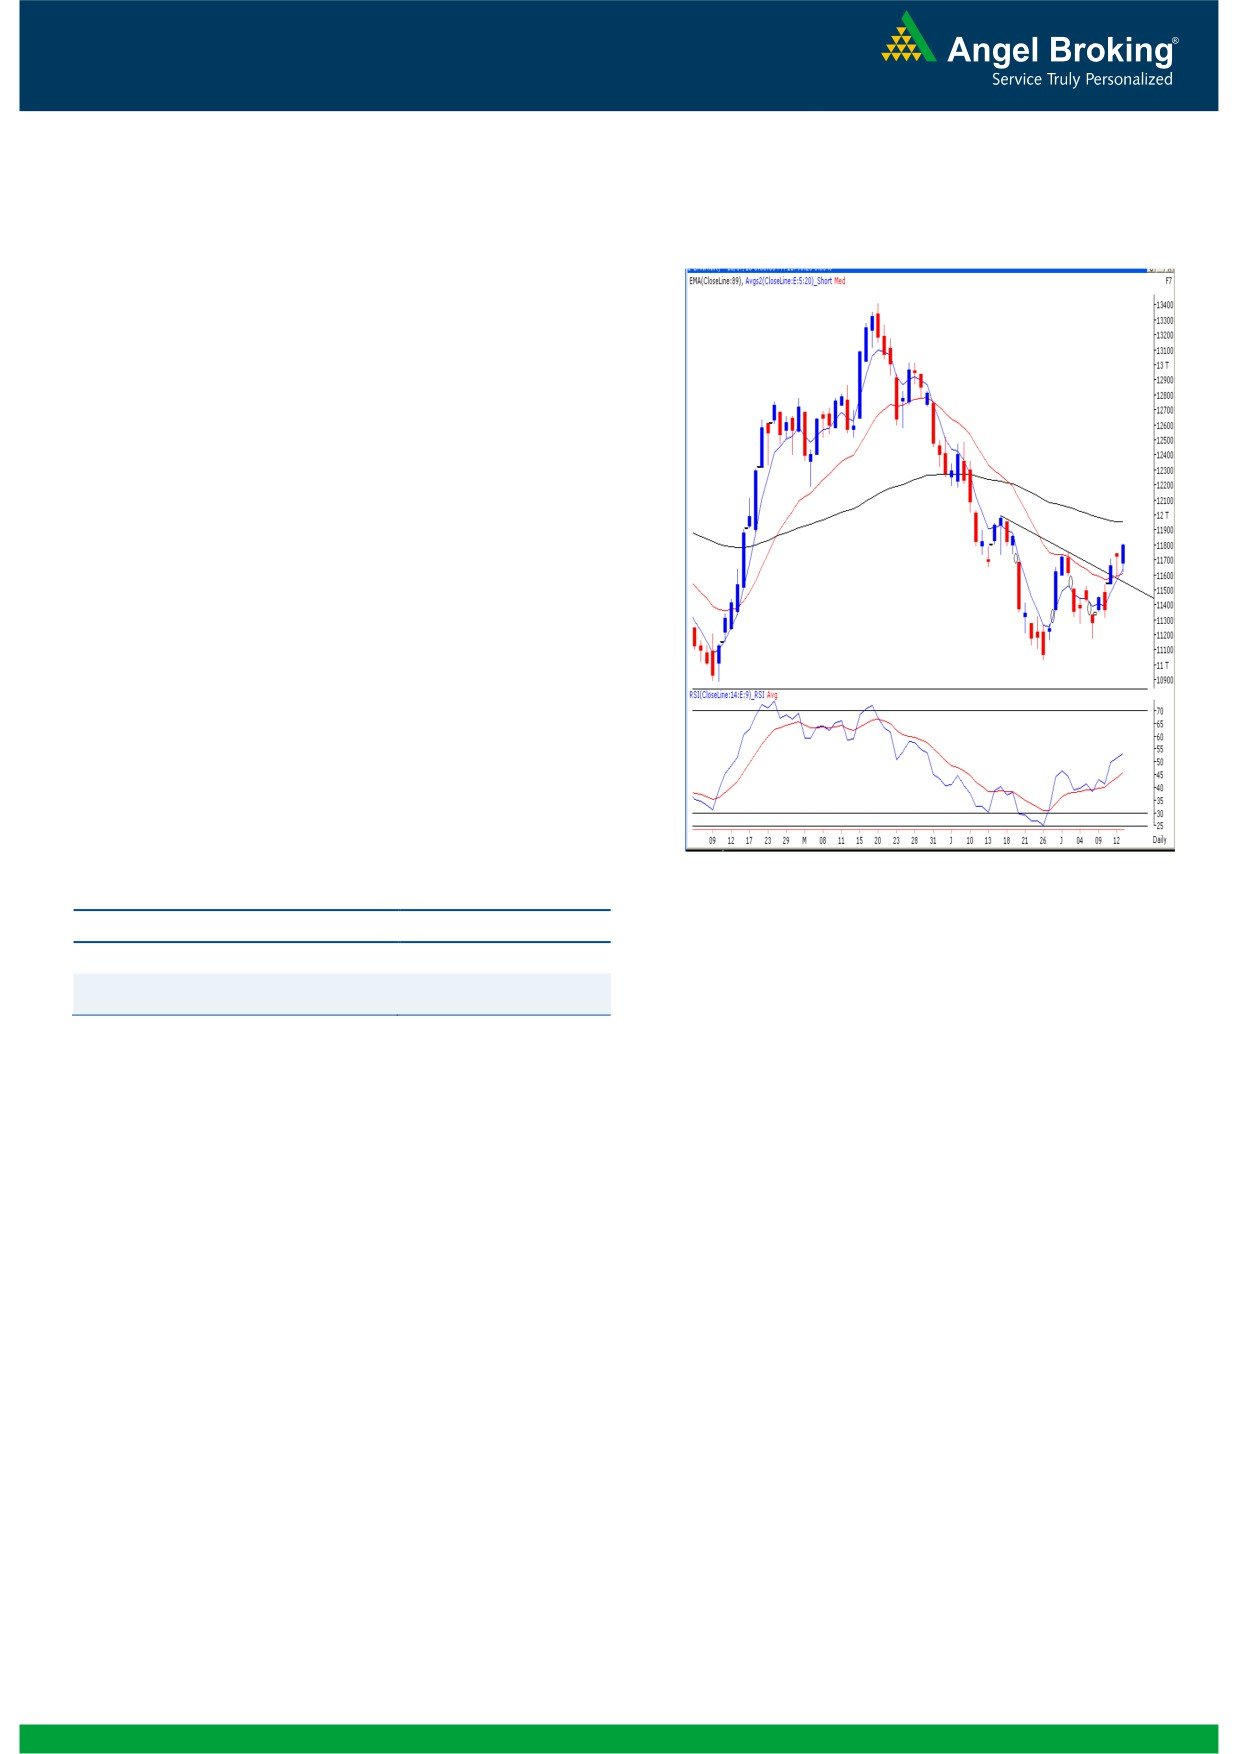
Exhibit 2: Bank Nifty Daily Chart
Bank Nifty Outlook - (11790)
Yesterday, the Bank Nifty too opened flat and traded with
slightly negative bias during the initial hour of the session. In
our previous report, we had mentioned that the Bank Nifty
broke out from the ‘'Downward Sloping Trend Line' breakout
on Thursday. During yesterday’s session, it has once again
managed to take a support around this trend line and moved
higher to close at day’s high. However, it must be noted that
yesterday evening the RBI has taken certain key steps to
control liquidity and this is likely to have a near term negative
impact on the Banking counters. Thus going forward a fall
and close below Friday's low of 11589 would indicate a
failure of the positive breakout and would negate all bullish
prospects. On the upside, yesterday’s high of11812 will now
prove to be a key resistance of the Bank Nifty. Only a move
beyond this level would warrant a positive outlook for
banking counters.
Actionable points:
Source: Falcon:
View
Neutral
Resistance levels
11812 - 11867
Support Level
11589 - 11541
2
Daily Technical Report
July 16, 2013
Research Team Tel: 022 - 30940000
DISCLAIMER
This document is solely for the personal information of the recipient, and must not be singularly used as the basis of any investment
decision. Nothing in this document should be construed as investment or financial advice. Each recipient of this document should make
such investigations as they deem necessary to arrive at an independent evaluation of an investment in the securities of the companies
referred to in this document (including the merits and risks involved), and should consult their own advisors to determine the merits and
risks of such an investment.
Angel Broking Pvt. Limited, its affiliates, directors, its proprietary trading and investment businesses may, from time to time, make
investment decisions that are inconsistent with or contradictory to the recommendations expressed herein. The views contained in this
document are those of the analyst, and the company may or may not subscribe to all the views expressed within.
Reports based on technical and derivative analysis center on studying charts of a stock's price movement, outstanding positions and
trading volume, as opposed to focusing on a company's fundamentals and, as such, may not match with a report on a company's
fundamentals.
The information in this document has been printed on the basis of publicly available information, internal data and other reliable
sources believed to be true, but we do not represent that it is accurate or complete and it should not be relied on as such, as this
document is for general guidance only. Angel Broking Pvt. Limited or any of its affiliates/ group companies shall not be in any way
responsible for any loss or damage that may arise to any person from any inadvertent error in the information contained in this report.
Angel Broking Pvt. Limited has not independently verified all the information contained within this document. Accordingly, we cannot
testify, nor make any representation or warranty, express or implied, to the accuracy, contents or data contained within this document.
While Angel Broking Pvt. Limited endeavours to update on a reasonable basis the information discussed in this material, there may be
regulatory, compliance, or other reasons that prevent us from doing so.
This document is being supplied to you solely for your information, and its contents, information or data may not be reproduced,
redistributed or passed on, directly or indirectly.
Angel Broking Pvt. Limited and its affiliates may seek to provide or have engaged in providing corporate finance, investment banking
or other advisory services in a merger or specific transaction to the companies referred to in this report, as on the date of this report or
in the past.
Neither Angel Broking Pvt. Limited, nor its directors, employees or affiliates shall be liable for any loss or damage that may arise from
or in connection with the use of this information.
Note: Please refer to the important `Stock Holding Disclosure' report on the Angel website (Research Section). Also, please refer to the
latest update on respective stocks for the disclosure status in respect of those stocks. Angel Broking Pvt. Limited and its affiliates may
have investment positions in the stocks recommended in this report.
Research Team
Shardul Kulkarni
-
Head - Technicals
Sameet Chavan
-
Technical Analyst
Sacchitanand Uttekar
-
Technical Analyst
Angel Broking Pvt. Ltd.
Registered Office: G-1, Ackruti Trade Centre, Rd. No. 7, MIDC, Andheri (E), Mumbai - 400 093.
Corporate Office: 6th Floor, Ackruti Star, MIDC, Andheri (E), Mumbai - 400 093. Tel: (022) 30940000
Sebi Registration No: INB 010996539
4