Daily Technical Report
July 15 , 2013
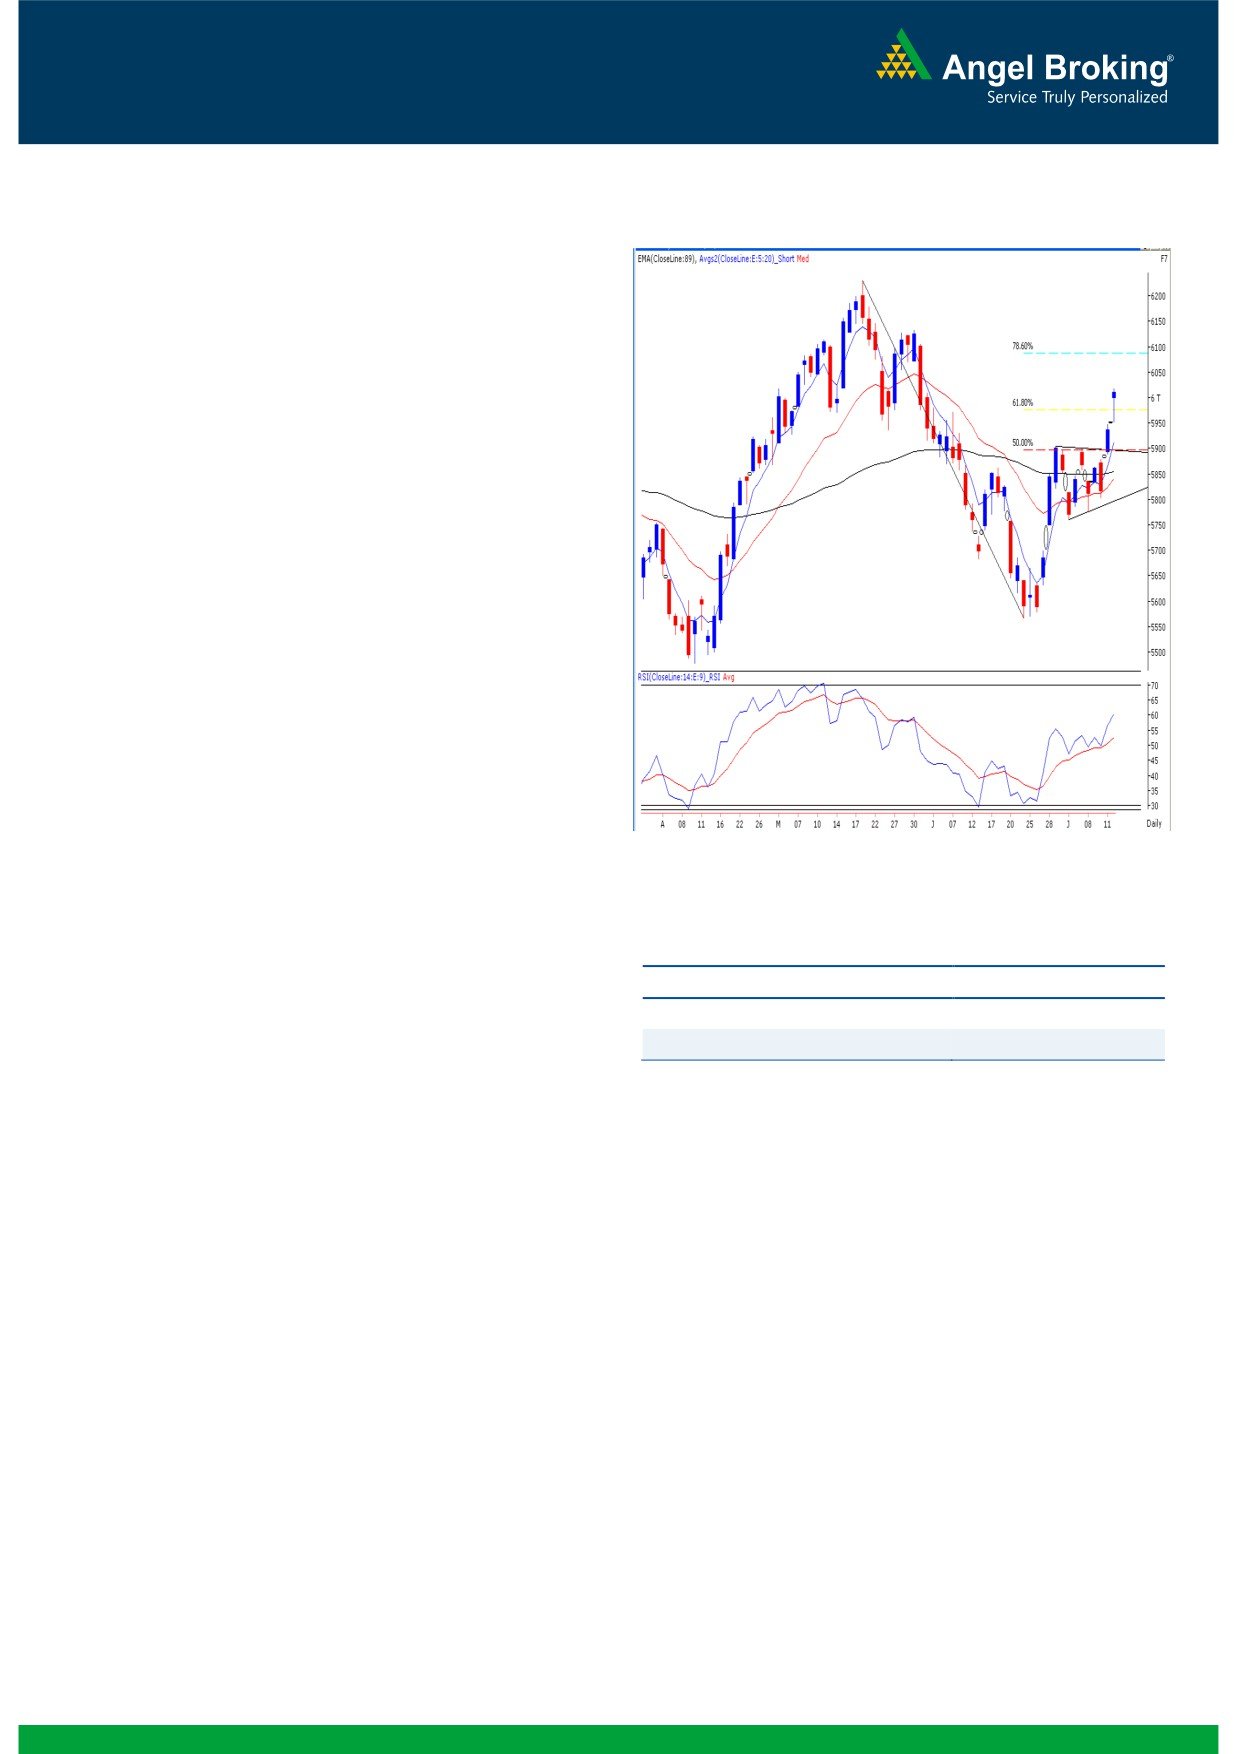
Exhibit 1: Nifty Daily Chart
Sensex (19958) / NIFTY (6009)
On Friday, our benchmark indices opened higher on
account of better-than-expected 1QFY2014 results of IT
giant, Infosys. Despite a minor corrective move, our markets
managed to inch higher during the latter part of the day and
as a result, indices closed almost at the highest point of the
week. On the sectoral front, the IT & TECH counters
dominated Friday’s gains; whereas the Consumer Durables,
Realty & PSU sectors ended on the losing side. The Advance
to Decline ratio was in the favor of declining counters.
Formation
The ’89-day EMA’ and the ’89-week EMA’ are placed at
19352 / 5854 and 18532 / 5607 levels respectively.
The ’20-day EMA’ and the ‘20-week EMA’ are placed at
19371 / 5841 and 19390 / 5866, respectively.
The weekly ‘RSI’ and ‘Stochastic’ oscillators are positively
poised.
Source: Falcon:
The 61.8% and 78.60% Fibonacci retracement levels of
the fall from 20444 / 6229 to 18467/ 5566 are placed
Actionable points:
at 19689 / 5976 and 20021 / 6088, respectively.
View
Neutral
The daily chart depicts a ‘Bullish Pennant’ pattern
Support Levels
5904 - 5879
breakout.
Resistance Level
6019 - 6088
Trading strategy:
For the first half of the week, our benchmark indices traded
within the range of 19640 - 19147 / 5904 - 5760 as
mentioned in our previous report. The breakout above
19640 / 5904 has now confirmed a ‘Bullish Pennant’
(please refer exhibit 2) pattern. The theoretical target of this
pattern also coincides with the 78.6% Fibonacci retracement
level placed at 20021 / 6088 (the target is computed by
adding length of the pole to the lowest point of the pennant).
Considering the positive placement of weekly momentum
oscillators, a test of the 20254 / 6134 levels is also possible
if the indices manage to stay above 20021 / 6088. On the
flipside, if indices breach Friday’s low of 19785 / 5951, then
we may witness a correction towards 19640 - 19500 / 5904
- 5879. These levels should ideally provide decent support
for our benchmark indices. An important point to note is that
the rally of the last 2 days has been led only by selective
large cap counters and the broader market has shown no
movement. We advise traders to adopt a stock-centric
approach and avoid taking undue risks.
1
Daily Technical Report
July 15, 2013
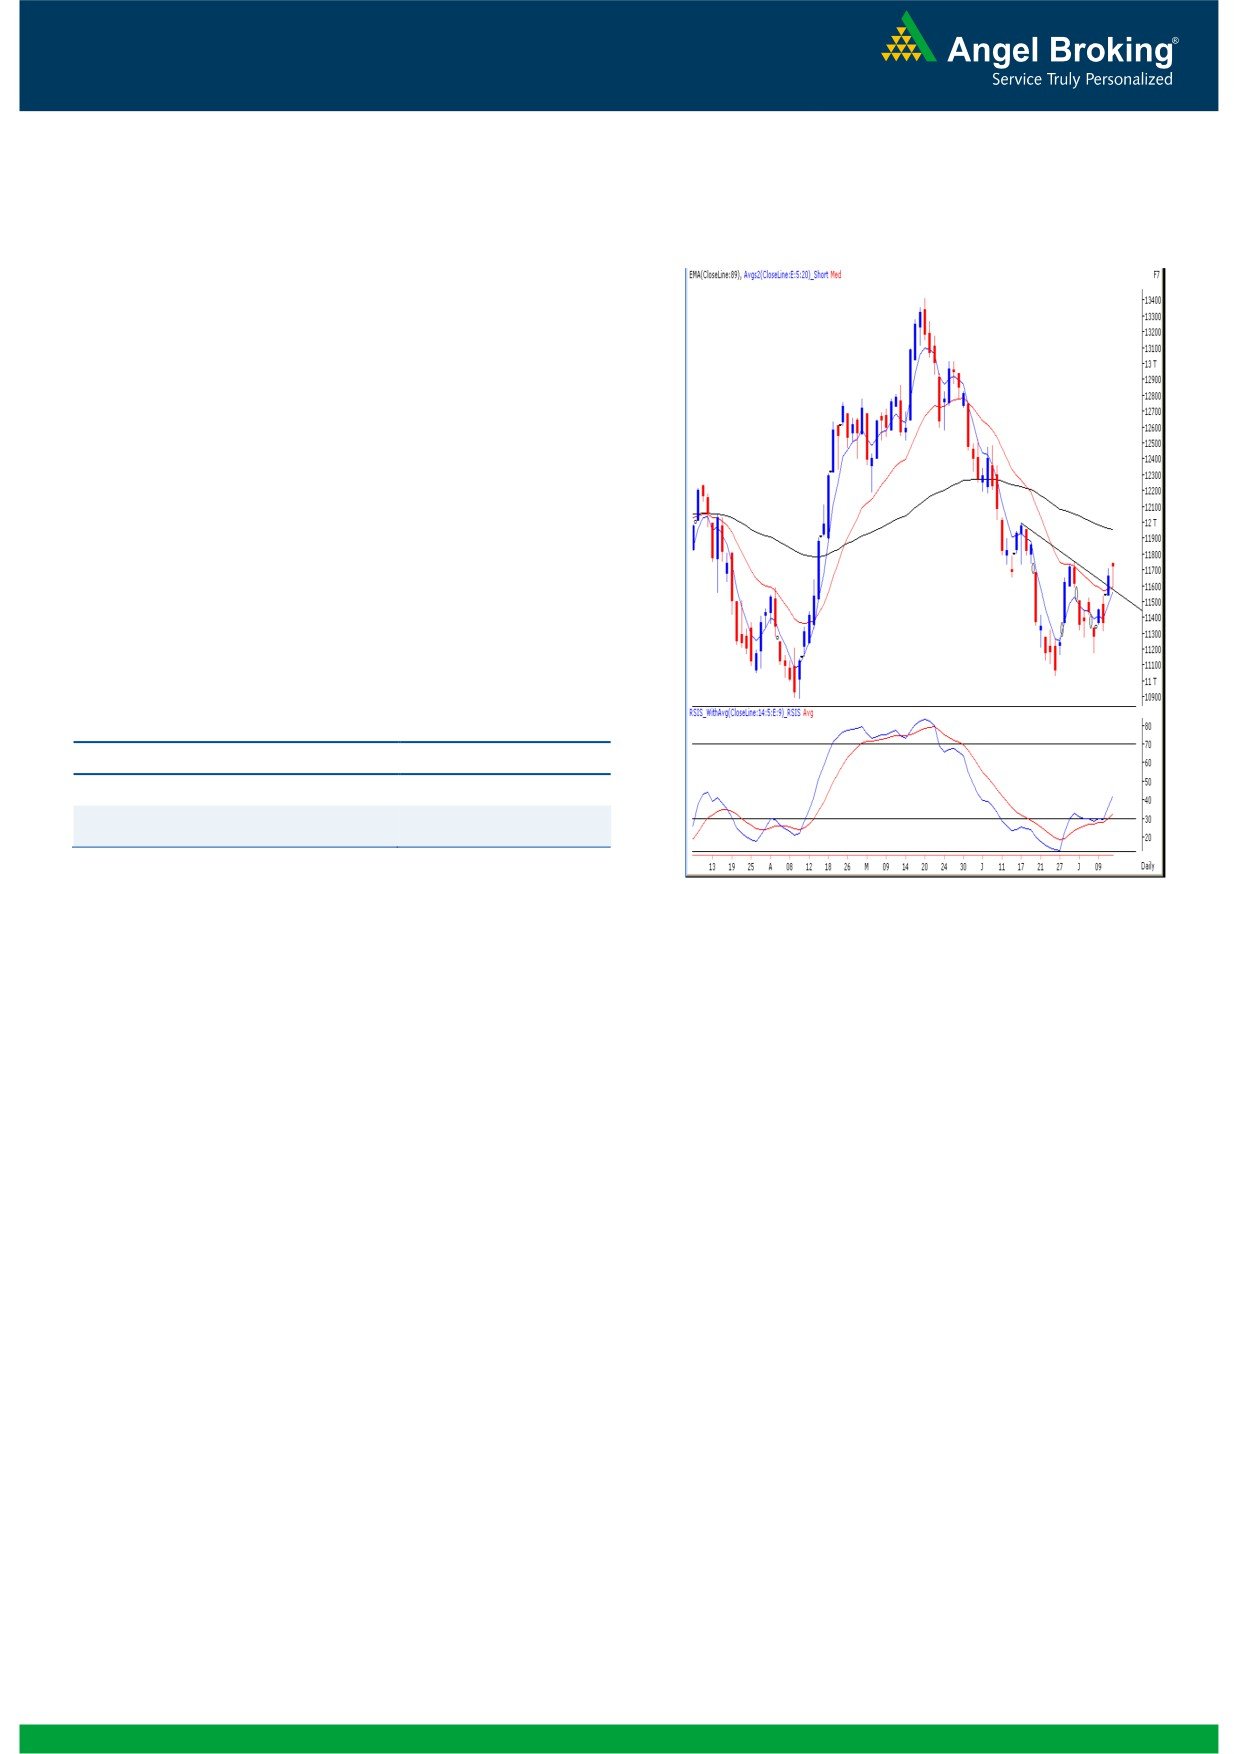
Exhibit 2: Bank Nifty Daily Chart
Bank Nifty Outlook - (11723)
On Friday, the Bank Nifty opened with minor upside gap and
immediately slipped lower to test the hourly ’20 EMA’ level of
11600. As expected, this technical tool provided decent
support for the index and eventually, the index closed higher
on the back of buying seen during the second half the day. At
present, the 'Downward Sloping Trend Line' breakout
witnessed on Thursday is still intact. Considering positive
placement of daily ‘RSI-Smoothened’ oscillator, we are of the
opinion that if Bank Nifty sustains above 11753, then we are
likely to witness a rally towards 12018, which is the daily ’89-
EMA’ level. Conversely, Friday's low of 11589 would act as a
key support in coming trading session.
Actionable points:
View
Bullish above 11753
Resistance Level
12018
Support Level
11589
Source: Falcon:
2
Daily Technical Report
July 15, 2013
Daily Pivot Levels for Nifty 50 Stocks
SCRIPS
S2
S1
PIVOT
R1
R2
SENSEX
19,706
19,832
19,912
20,038
20,118
NIFTY
5,925
5,967
5,993
6,035
6,061
BANKNIFTY
11,531
11,627
11,685
11,781
11,839
ACC
1,212
1,227
1,241
1,256
1,270
AMBUJACEM
192
195
196
199
201
ASIANPAINT
4,732
4,779
4,839
4,887
4,947
AXISBANK
1,260
1,276
1,287
1,303
1,315
BAJAJ-AUTO
1,830
1,850
1,865
1,885
1,901
BANKBARODA
552
562
569
579
587
BHARTIARTL
293
299
303
309
313
BHEL
183
186
188
190
192
BPCL
333
338
342
347
351
CAIRN
286
289
292
295
297
CIPLA
385
395
401
411
417
COALINDIA
291
295
298
303
305
DLF
171
174
177
180
183
DRREDDY
2,216
2,283
2,321
2,387
2,425
GAIL
315
319
322
326
329
GRASIM
2,779
2,805
2,837
2,863
HCLTECH
841
852
858
869
876
HDFC
827
839
849
862
872
HDFCBANK
676
686
692
702
708
HEROMOTOCO
1,661
1,688
1,706
1,733
1,750
HINDALCO
99
101
102
103
105
HINDUNILVR
586
594
598
606
611
ICICIBANK
1,043
1,052
1,060
1,069
1,077
IDFC
129
132
134
137
139
INDUSINDBK
491
497
505
511
519
INFY
2,664
2,734
2,820
2,890
2,976
ITC
345
348
350
353
356
JINDALSTEL
217
220
222
225
226
JPASSOCIAT
50
51
53
54
56
KOTAKBANK
727
743
752
768
777
LT
947
971
985
1,010
1,024
LUPIN
848
859
867
878
887
M&M
879
893
909
923
939
MARUTI
1,397
1,423
1,464
1,489
1,530
NMDC
104
105
107
108
110
NTPC
140
143
145
148
150
ONGC
283
290
299
306
315
PNB
622
628
632
638
642
POWERGRID
107
109
110
111
112
RANBAXY
329
334
339
344
349
RELIANCE
859
874
885
901
912
RELINFRA
371
378
383
391
396
SBIN
1,860
1,876
1,898
1,915
1,937
SESAGOA
146
149
151
154
156
SUNPHARMA
1,080
1,094
1,105
1,119
1,130
TATAMOTORS
281
287
291
296
300
TATAPOWER
85
87
89
91
92
TATASTEEL
256
259
262
265
267
TCS
1,559
1,585
1,605
1,630
1,650
ULTRACEMCO
1,873
1,906
1,953
1,987
2,034
3
Daily Technical Report
July 15, 2013
Research Team Tel: 022 - 30940000
DISCLAIMER
This document is solely for the personal information of the recipient, and must not be singularly used as the basis of any investment
decision. Nothing in this document should be construed as investment or financial advice. Each recipient of this document should make
such investigations as they deem necessary to arrive at an independent evaluation of an investment in the securities of the companies
referred to in this document (including the merits and risks involved), and should consult their own advisors to determine the merits and
risks of such an investment.
Angel Broking Pvt. Limited, its affiliates, directors, its proprietary trading and investment businesses may, from time to time, make
investment decisions that are inconsistent with or contradictory to the recommendations expressed herein. The views contained in this
document are those of the analyst, and the company may or may not subscribe to all the views expressed within.
Reports based on technical and derivative analysis center on studying charts of a stock's price movement, outstanding positions and
trading volume, as opposed to focusing on a company's fundamentals and, as such, may not match with a report on a company's
fundamentals.
The information in this document has been printed on the basis of publicly available information, internal data and other reliable
sources believed to be true, but we do not represent that it is accurate or complete and it should not be relied on as such, as this
document is for general guidance only. Angel Broking Pvt. Limited or any of its affiliates/ group companies shall not be in any way
responsible for any loss or damage that may arise to any person from any inadvertent error in the information contained in this report.
Angel Broking Pvt. Limited has not independently verified all the information contained within this document. Accordingly, we cannot
testify, nor make any representation or warranty, express or implied, to the accuracy, contents or data contained within this document.
While Angel Broking Pvt. Limited endeavours to update on a reasonable basis the information discussed in this material, there may be
regulatory, compliance, or other reasons that prevent us from doing so.
This document is being supplied to you solely for your information, and its contents, information or data may not be reproduced,
redistributed or passed on, directly or indirectly.
Angel Broking Pvt. Limited and its affiliates may seek to provide or have engaged in providing corporate finance, investment banking
or other advisory services in a merger or specific transaction to the companies referred to in this report, as on the date of this report or
in the past.
Neither Angel Broking Pvt. Limited, nor its directors, employees or affiliates shall be liable for any loss or damage that may arise from
or in connection with the use of this information.
Note: Please refer to the important `Stock Holding Disclosure' report on the Angel website (Research Section). Also, please refer to the
latest update on respective stocks for the disclosure status in respect of those stocks. Angel Broking Pvt. Limited and its affiliates may
have investment positions in the stocks recommended in this report.
Research Team
Shardul Kulkarni
-
Head - Technicals
Sameet Chavan
-
Technical Analyst
Sacchitanand Uttekar
-
Technical Analyst
Angel Broking Pvt. Ltd.
Registered Office: G-1, Ackruti Trade Centre, Rd. No. 7, MIDC, Andheri (E), Mumbai - 400 093.
Corporate Office: 6th Floor, Ackruti Star, MIDC, Andheri (E), Mumbai - 400 093. Tel: (022) 30940000
Sebi Registration No: INB 010996539
4