Daily Technical Report
July 12 , 2013
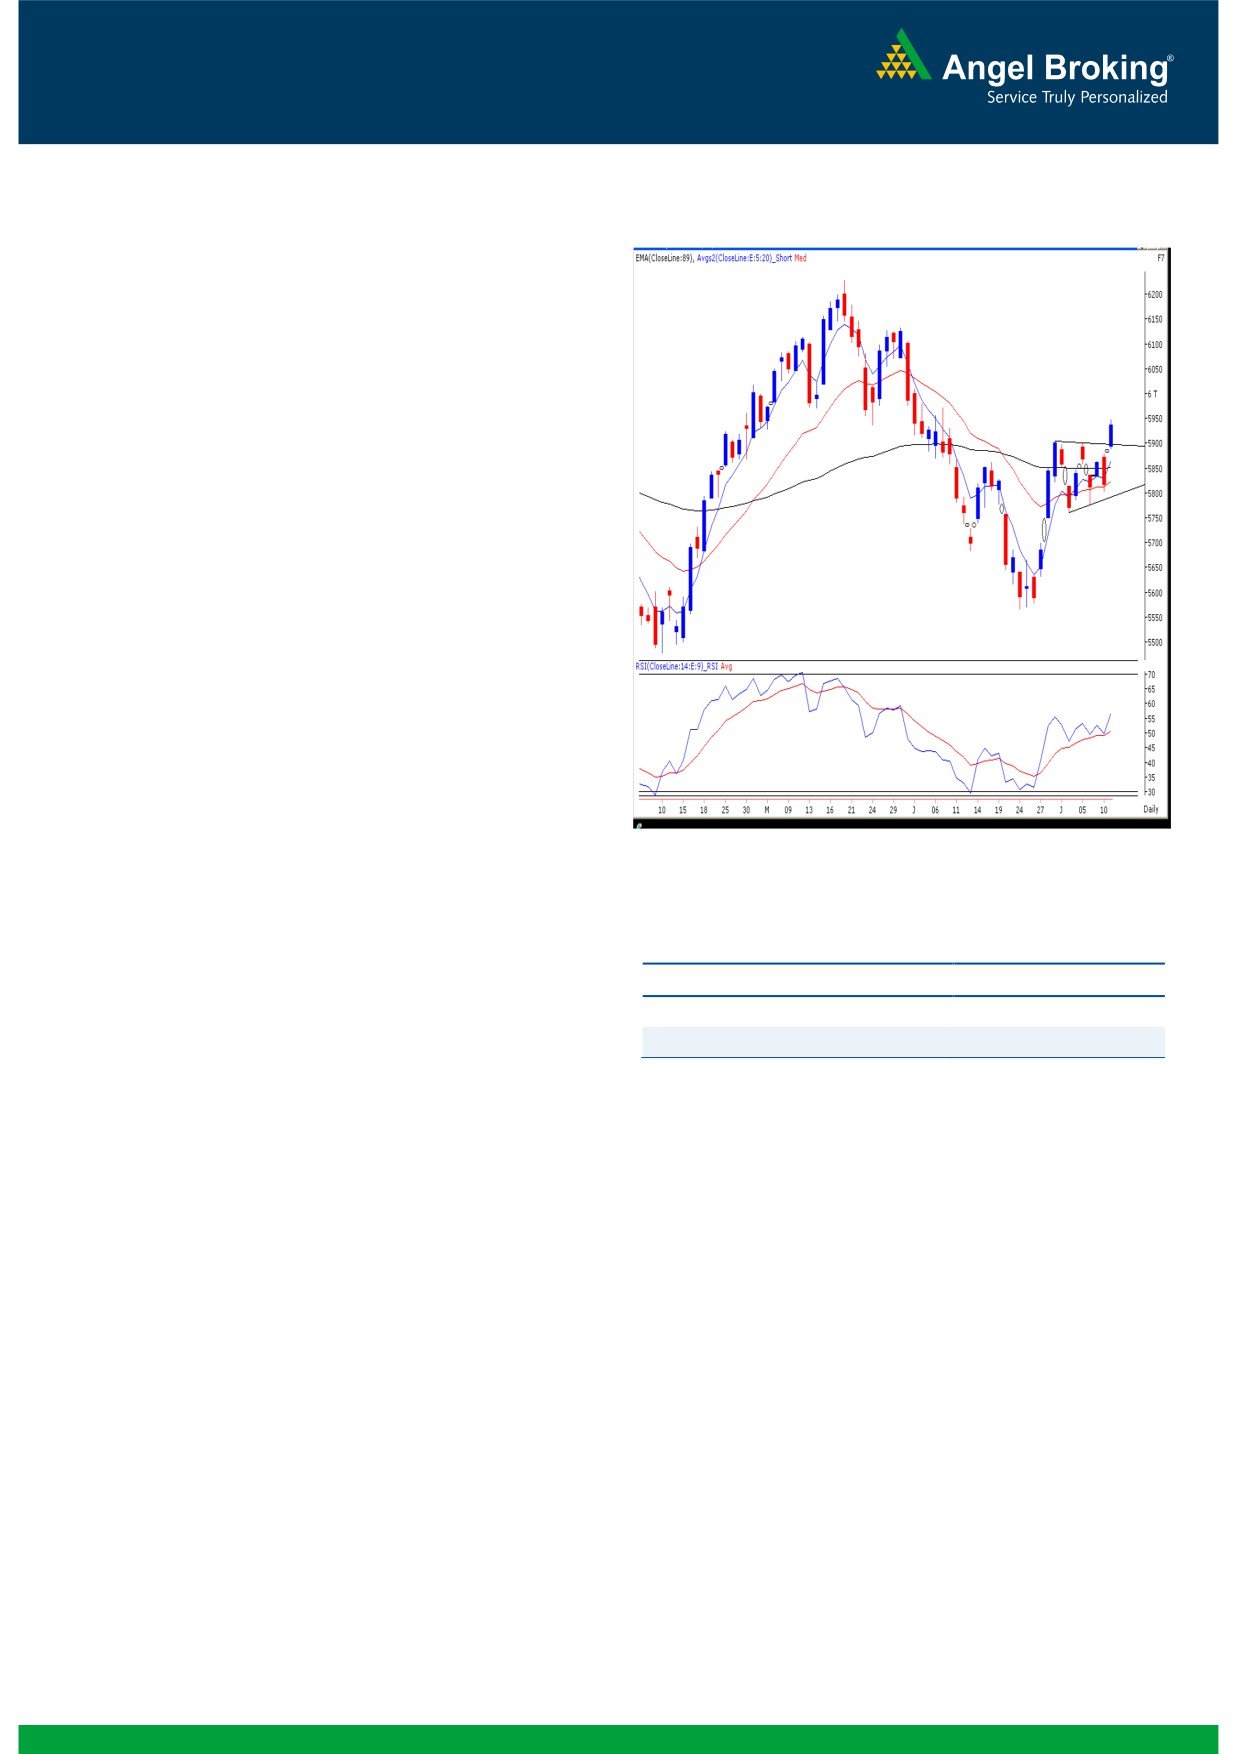
Exhibit 1: Nifty Daily Chart
Sensex (19676) / NIFTY (5935)
Yesterday, our benchmark indices opened substantially
higher as indicated by the SGX Nifty early in the morning.
Markets then maintained their early gains and gradually
moved higher to end the session with massive gain of 2%.
The Metals, Banking and Reality counters outperformed
significantly whereas Consumer Durables faced selling
pressure. The cash segment volumes remained considerably
lower in spite of such a strong rally in the markets. The
advance to decline ratio was strongly in the favor of
advancing counters (A=1358 D=974)
(Source-
Formation
The ’89-day EMA’ and the ’89-week EMA’ are placed at
19338 / 5850 and 18526 / 5605 levels, respectively.
The ’20-day EMA’ and the ‘20-week EMA’ are placed at
19310/ 5823 and 19363 / 5859, respectively.
The weekly ‘RSI’ and ‘Stochastic’ oscillators are positively
Source: Falcon:
poised.
The 61.8% and 78.60% Fibonacci retracement levels of
Actionable points:
the fall from 20444 / 6229 to 18467/ 5566 are placed
at 19689 / 5976 and 20021 / 6088, respectively.
View
Neutral
Support Levels
5887 - 5904
The weekly chart now depicts a ‘Bullish Engulfing’
Resistance Level
5948 - 6011
pattern but the monthly chart shows a 'Bearish Engulfing"
Japanese candlestick pattern.
Trading strategy:
All the equity markets across the globe got a booster shot
after the Fed Reserve chairman Ben Bernanke announced
that the central bank is not in a hurry to raise short term
rates and that the accommodative monetary policy will be
here to stay for the foreseeable future. We witnessed a huge
gap opening in our market and a breakout beyond the stiff
resistance level of 19640 / 5904. The daily chart now
depicts a breakout from the 'Bullish Pennant' pattern.
Considering the current momentum and the positive
placement of weekly oscillators, we expect our market to rally
towards 19860 / 6011 if they sustain above yesterday’s high
of 19723 / 5948 levels. On the flipside, 19640 - 19598/
5904 - 5887 would act as support for our market. Traders
should bear in mind that the Infosys results and the IIP
numbers will be declared in today’s session. Thus traders
should stay light on positions and maintain strict stop losses
for their trades.
1
Daily Technical Report
July 12, 2013
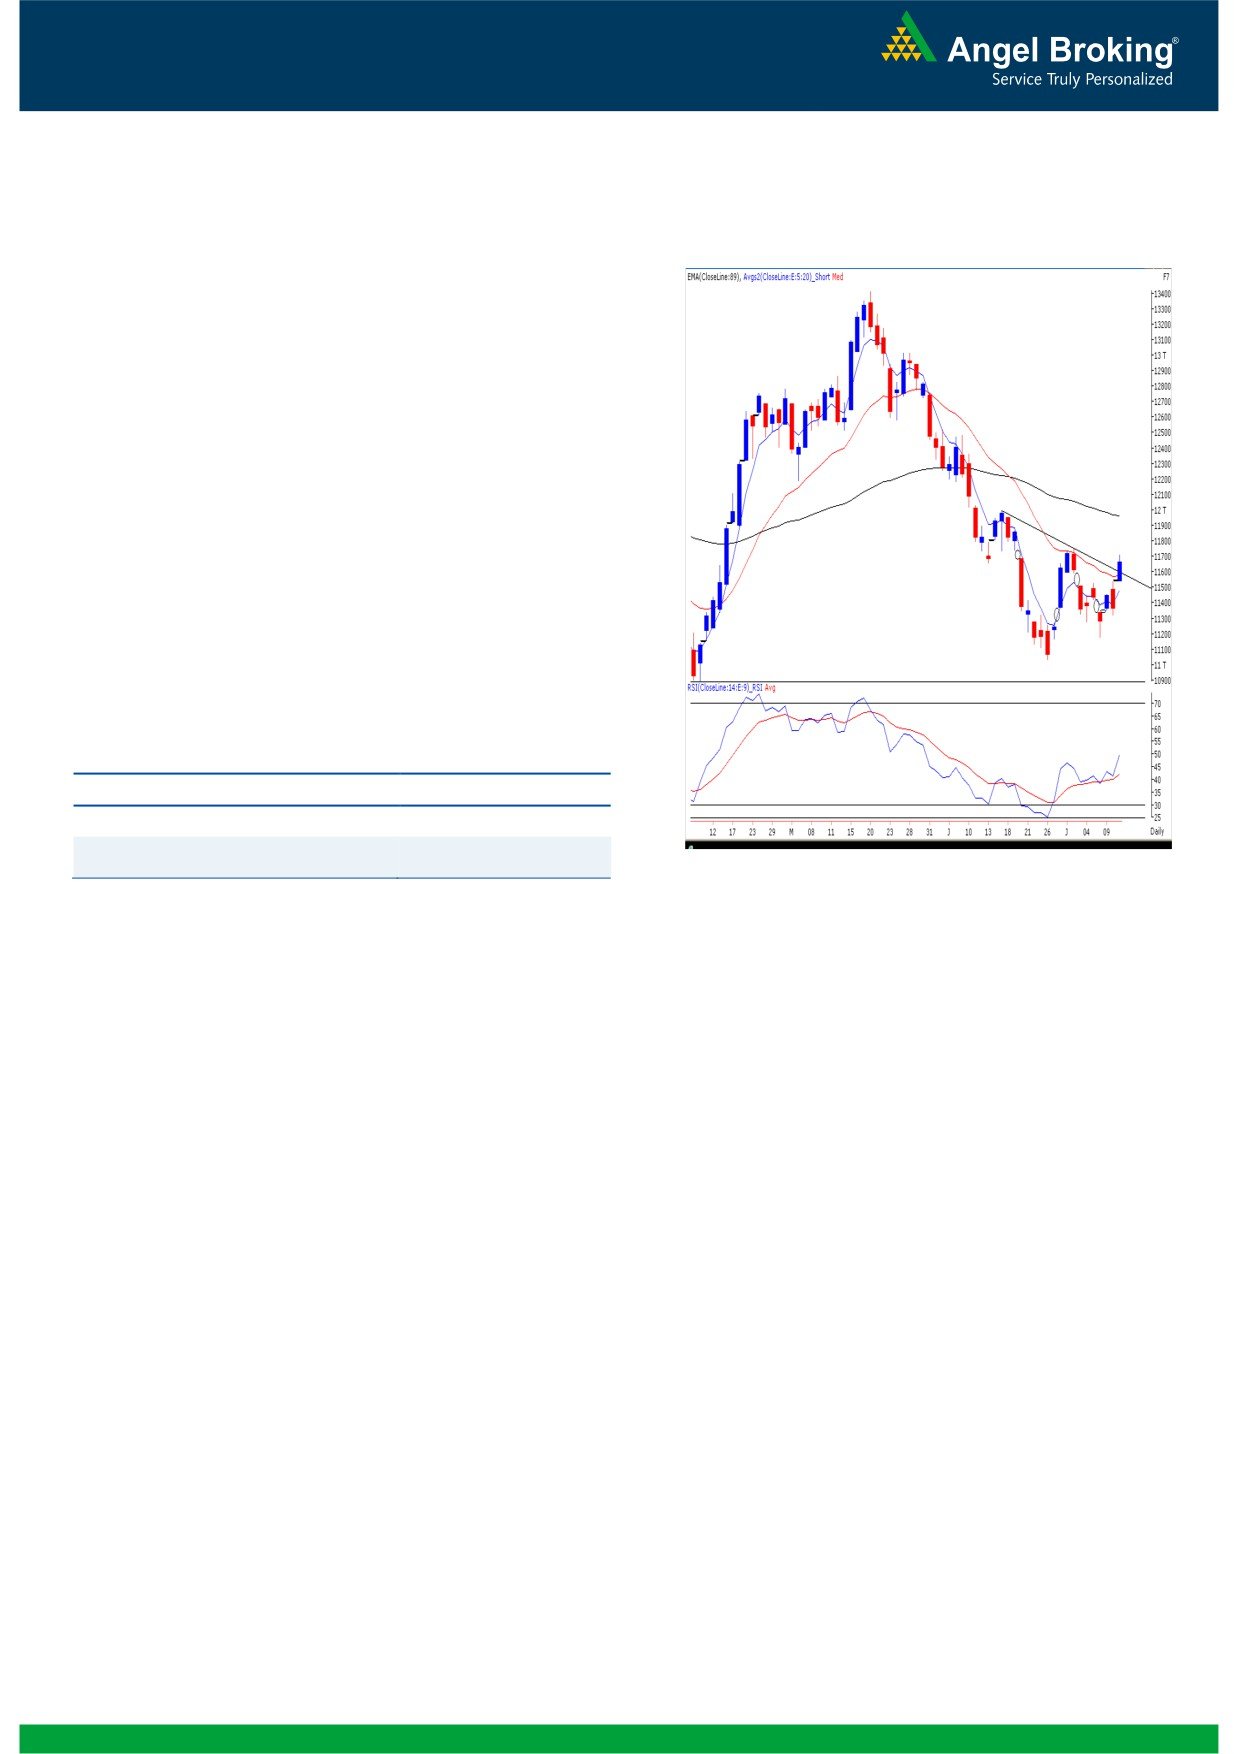
Exhibit 2: Bank Nifty Daily Chart
Bank Nifty Outlook - (11655)
Yesterday, the Bank Nifty too opened with nearly two percent
upside gap in-line with optimistic trading mood across the
globe. During the entire session, the Bank Nifty managed on
to the gains and to close well inside the positive territory. In
the process, the index has given a 'Downward Sloping Trend
Line' breakout as shown in the chart and also crossed the
daily '20 EMA' placed at 11567. Considering the positive
placement in daily momentum oscillators, we expect the Bank
Nifty to test its next resistance level of 11752. Conversely,
yesterday's low of 11541 would be key support in coming
trading session. A fall below this low would negate all
bullish possibilities in the near term and traders can use
this as a stop loss for their long positions.
Actionable points:
View
Neutral
Resistance Level
11752
Support Level
11541
Source: Falcon:
2
Daily Technical Report
July 12, 2013
Daily Pivot Levels for Nifty 50 Stocks
SCRIPS
S2
S1
PIVOT
R1
R2
SENSEX
19,368
19,522
19,623
19,777
19,878
NIFTY
5,863
5,899
5,924
5,960
5,985
BANKNIFTY
11,467
11,561
11,636
11,730
11,804
ACC
1,230
1,240
1,255
1,265
1,280
AMBUJACEM
194
196
197
199
201
ASIANPAINT
4,780
4,827
4,857
4,905
4,935
AXISBANK
1,266
1,277
1,288
1,299
1,311
BAJAJ-AUTO
1,852
1,864
1,876
1,889
1,901
BANKBARODA
557
563
569
574
580
BHARTIARTL
290
295
298
303
306
BHEL
182
184
187
189
191
BPCL
334
337
341
343
347
CAIRN
287
290
292
295
298
CIPLA
395
398
401
403
407
COALINDIA
288
293
298
303
308
DLF
175
177
178
180
182
DRREDDY
2,243
2,269
2,288
2,314
2,333
GAIL
314
317
320
324
327
GRASIM
2,797
2,819
2,847
2,869
HCLTECH
824
832
841
849
857
HDFC
826
840
849
863
871
HDFCBANK
658
671
679
691
699
HEROMOTOCO
1,633
1,665
1,690
1,722
1,747
HINDALCO
98
100
102
105
107
HINDUNILVR
590
596
599
605
609
ICICIBANK
1,037
1,047
1,061
1,071
1,084
IDFC
129
130
131
132
134
INDUSINDBK
497
504
510
517
524
INFY
2,480
2,504
2,534
2,558
2,588
ITC
343
348
351
357
360
JINDALSTEL
216
219
223
226
231
JPASSOCIAT
53
53
54
55
56
KOTAKBANK
721
733
743
755
765
LT
945
955
967
977
990
LUPIN
857
863
869
875
881
M&M
906
912
921
927
936
MARUTI
1,445
1,476
1,527
1,557
1,609
NMDC
104
105
107
108
110
NTPC
141
143
144
145
147
ONGC
297
301
304
308
311
PNB
618
624
632
638
646
POWERGRID
108
109
110
111
113
RANBAXY
334
338
344
349
355
RELIANCE
853
862
868
876
882
RELINFRA
374
378
382
386
391
SBIN
1,885
1,898
1,913
1,926
1,941
SESAGOA
140
145
148
153
157
SUNPHARMA
1,074
1,085
1,097
1,107
1,119
TATAMOTORS
278
281
286
290
295
TATAPOWER
86
87
88
89
90
TATASTEEL
256
258
262
265
268
TCS
1,502
1,533
1,552
1,583
1,602
ULTRACEMCO
1,958
1,969
1,979
1,990
1,999
3
Daily Technical Report
July 12, 2013
Research Team Tel: 022 - 30940000
DISCLAIMER
This document is solely for the personal information of the recipient, and must not be singularly used as the basis of any investment
decision. Nothing in this document should be construed as investment or financial advice. Each recipient of this document should make
such investigations as they deem necessary to arrive at an independent evaluation of an investment in the securities of the companies
referred to in this document (including the merits and risks involved), and should consult their own advisors to determine the merits and
risks of such an investment.
Angel Broking Pvt. Limited, its affiliates, directors, its proprietary trading and investment businesses may, from time to time, make
investment decisions that are inconsistent with or contradictory to the recommendations expressed herein. The views contained in this
document are those of the analyst, and the company may or may not subscribe to all the views expressed within.
Reports based on technical and derivative analysis center on studying charts of a stock's price movement, outstanding positions and
trading volume, as opposed to focusing on a company's fundamentals and, as such, may not match with a report on a company's
fundamentals.
The information in this document has been printed on the basis of publicly available information, internal data and other reliable
sources believed to be true, but we do not represent that it is accurate or complete and it should not be relied on as such, as this
document is for general guidance only. Angel Broking Pvt. Limited or any of its affiliates/ group companies shall not be in any way
responsible for any loss or damage that may arise to any person from any inadvertent error in the information contained in this report.
Angel Broking Pvt. Limited has not independently verified all the information contained within this document. Accordingly, we cannot
testify, nor make any representation or warranty, express or implied, to the accuracy, contents or data contained within this document.
While Angel Broking Pvt. Limited endeavours to update on a reasonable basis the information discussed in this material, there may be
regulatory, compliance, or other reasons that prevent us from doing so.
This document is being supplied to you solely for your information, and its contents, information or data may not be reproduced,
redistributed or passed on, directly or indirectly.
Angel Broking Pvt. Limited and its affiliates may seek to provide or have engaged in providing corporate finance, investment banking
or other advisory services in a merger or specific transaction to the companies referred to in this report, as on the date of this report or
in the past.
Neither Angel Broking Pvt. Limited, nor its directors, employees or affiliates shall be liable for any loss or damage that may arise from
or in connection with the use of this information.
Note: Please refer to the important `Stock Holding Disclosure' report on the Angel website (Research Section). Also, please refer to the
latest update on respective stocks for the disclosure status in respect of those stocks. Angel Broking Pvt. Limited and its affiliates may
have investment positions in the stocks recommended in this report.
Research Team
Shardul Kulkarni
-
Head - Technicals
Sameet Chavan
-
Technical Analyst
Sacchitanand Uttekar
-
Technical Analyst
Angel Broking Pvt. Ltd.
Registered Office: G-1, Ackruti Trade Centre, Rd. No. 7, MIDC, Andheri (E), Mumbai - 400 093.
Corporate Office: 6th Floor, Ackruti Star, MIDC, Andheri (E), Mumbai - 400 093. Tel: (022) 30940000
Sebi Registration No: INB 010996539
4