Daily Technical Report
July 11 , 2013
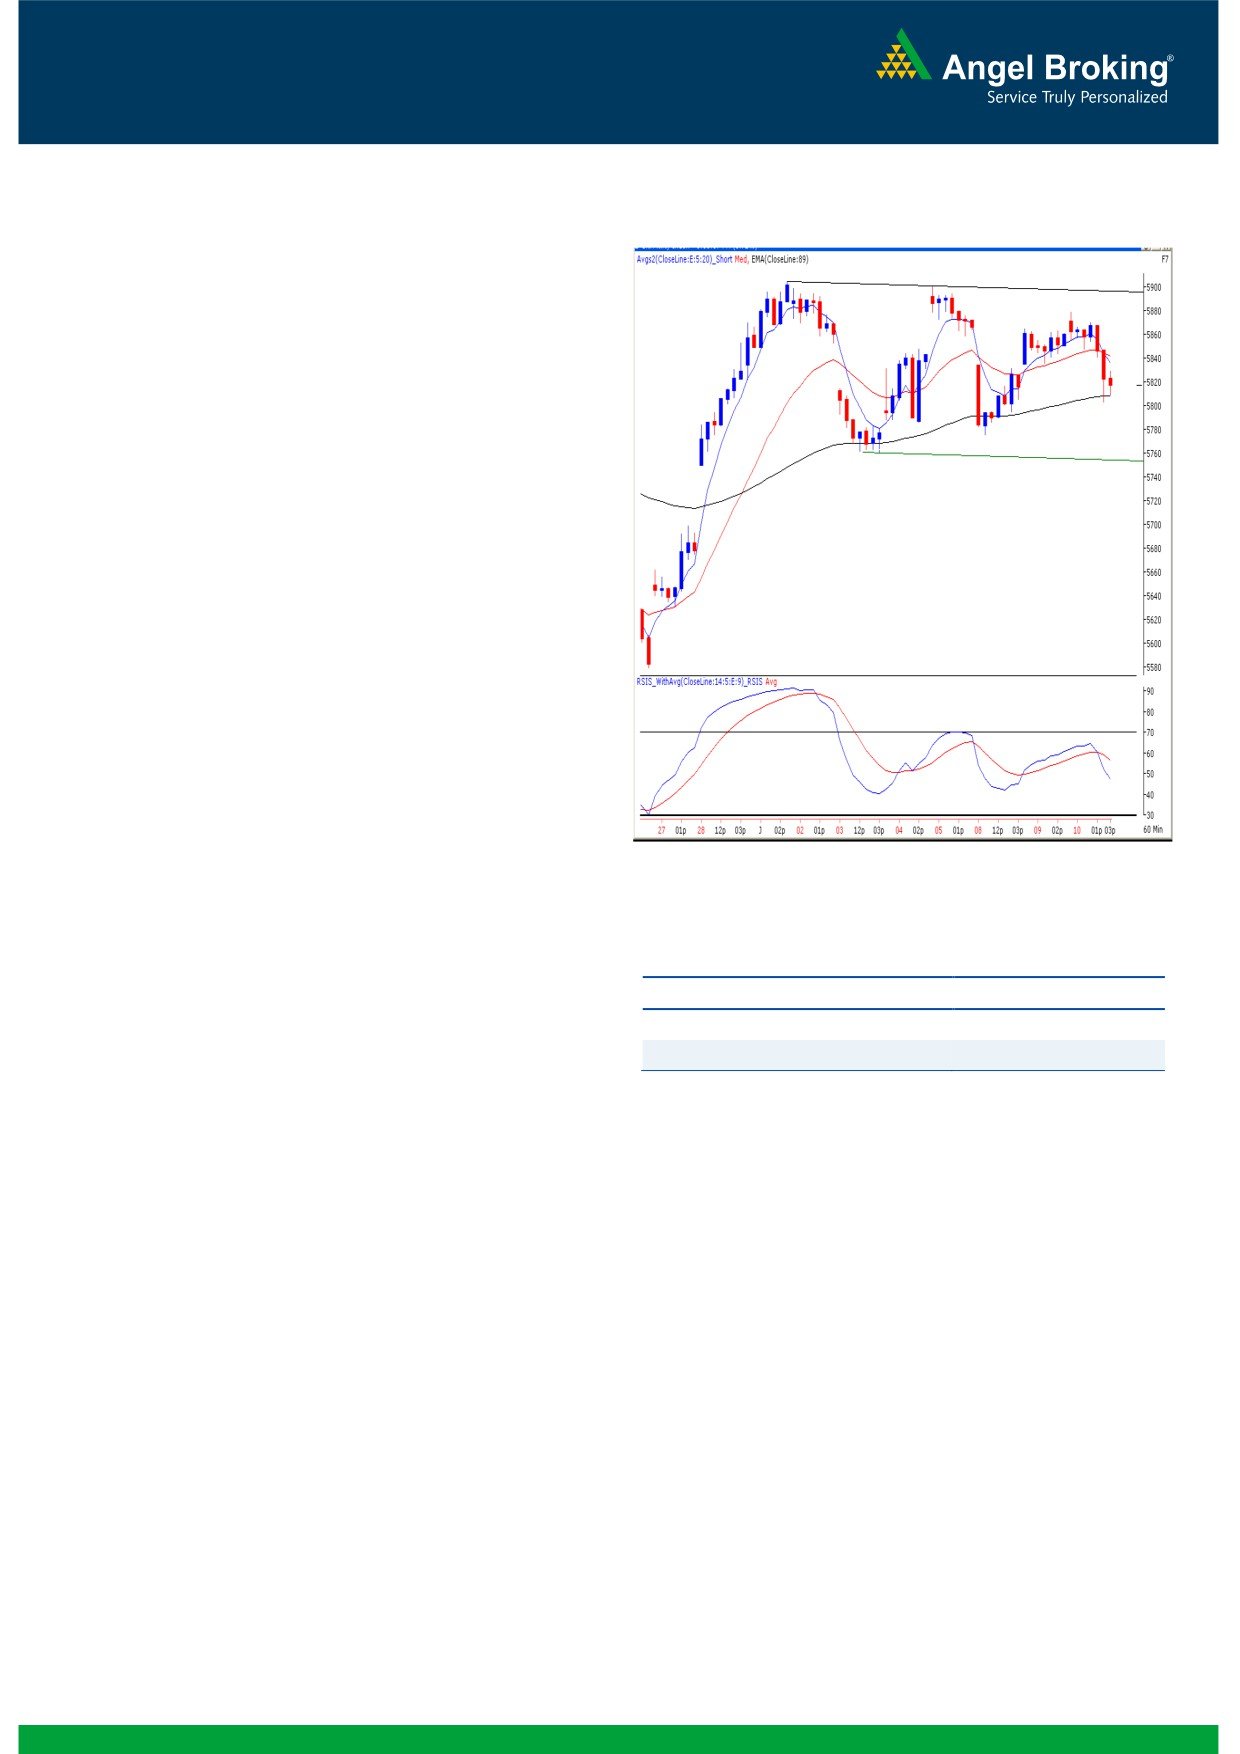
Exhibit 1: Nifty Hourly Chart
Sensex (19294) / NIFTY (5817)
Yesterday, once again indices opened marginally higher as
suggested by the SGX Nifty early in the morning. Indices then
slipped into a consolidation mode and traded with very
lackluster movement throughout the first half. However,
during the latter part of the session, markets corrected
sharply to close inside the negative territory. The Oil & Gas,
Realty and Auto counters remained under pressure; whereas
the Consumer Durables and IT sectors outperformed our
benchmark indices. The advance to decline ratio was neutral
during yesterday’s session. (A=1131 D=1183) (Source-
Formation
The ’89-day EMA’ and the ’89-week EMA’ are placed at
19330 / 5849 and 18517 / 5603 levels, respectively.
The ’20-day EMA’ and the ‘20-week EMA’ are placed at
19271/ 5811 and 19326 / 5848, respectively.
The weekly ‘RSI’ and ‘Stochastic’ oscillators are positively
poised.
Source: Falcon:
The 61.8% and 78.60% Fibonacci retracement levels of
the fall from 20444 / 6229 to 18467/ 5566 are placed
Actionable points:
at 19689 / 5976 and 20021 / 6088, respectively.
The weekly chart now depicts a ‘Bullish Engulfing’
View
Neutral
pattern but the monthly chart shows a 'Bearish Engulfing"
Support Levels
5802 - 5760
Japanese candlestick pattern.
Resistance Level
5904
Trading strategy:
Our benchmark indices came off sharply during the second
half to close with more than half a percent loss. In our
previous report, we had mentioned a ‘Channel’ pattern seen
in the hourly chart, which is still intact. Indices are now
trading near the hourly ’89 EMA’, which is considered as a
decent support. Hence, a breach of yesterday’s low (19237 /
5802) would lead to an intraday correction towards the
19147
/
5760. However, considering slightly broader
perspective, only a sustainable move below 19147 / 5760
would trigger immense pessimism in our market. On the
upside, 19640 / 5904 remains to be an important resistance
level for our market. A close beyond this level will result in a
breakout from a trading range and markets may head
higher to test 19711 / 5972 levels.
1
Daily Technical Report
July 11, 2013
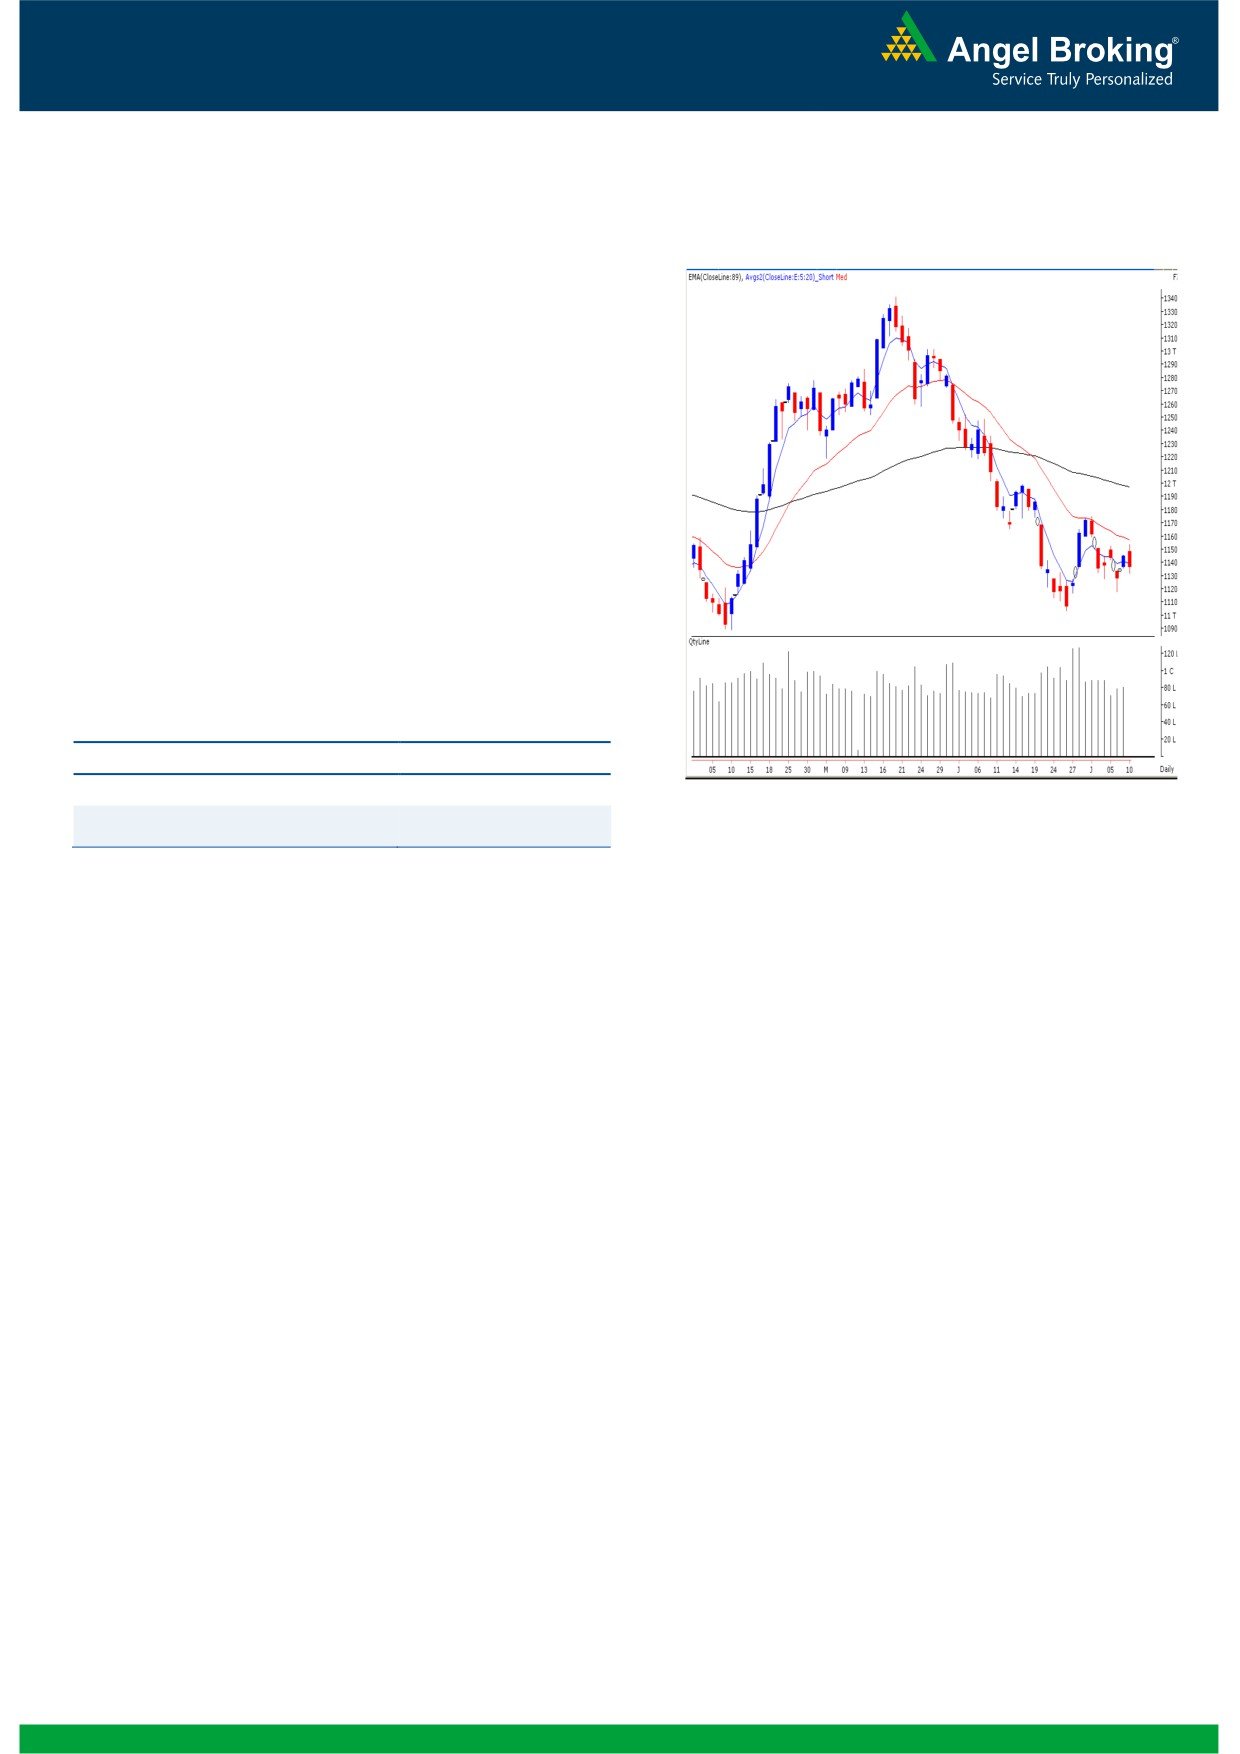
Exhibit 2: Bank Nifty Daily Chart
Bank Nifty Outlook - (11364)
Yesterday, the Bank Nifty too opened higher in-line with
our benchmark indices and then traded sideways for the
entire first half. A sharp correction during the last couple of
hours resulted in closing almost at the lowest point of the
day. The charts of this Index are weak and the prices
continue to remain below the 20 day EMA placed at
11567. For the coming trading session, we are mentioning
a trading range of 11567 to 11317. A sustainable move
below the lower end of the range would pull the index
towards its next support level of 11176. On the flipside,
11567 would act as important supply zone for Bank Nifty
in coming trading session.
Actionable points:
View
Neutral
Resistance Level
11567 - 11590
Source: Falcon:
Support Level
11317 - 11176
2
Daily Technical Report
July 11, 2013
Daily Pivot Levels for Nifty 50 Stocks
SCRIPS
S2
S1
PIVOT
R1
R2
SENSEX
19,078
19,186
19,346
19,454
19,614
NIFTY
5,756
5,787
5,833
5,863
5,909
BANKNIFTY
11,184
11,274
11,408
11,498
11,631
ACC
1,237
1,243
1,252
1,258
1,266
AMBUJACEM
190
192
194
196
198
ASIANPAINT
4,722
4,752
4,801
4,831
4,879
AXISBANK
1,231
1,244
1,263
1,276
1,294
BAJAJ-AUTO
1,799
1,831
1,874
1,906
1,949
BANKBARODA
534
543
559
569
585
BHARTIARTL
286
288
291
293
296
BHEL
180
182
185
187
190
BPCL
326
331
338
343
350
CAIRN
280
283
288
291
295
CIPLA
394
397
401
404
408
COALINDIA
286
288
290
292
294
DLF
169
171
175
178
181
DRREDDY
2,217
2,239
2,268
2,290
2,319
GAIL
311
313
315
317
320
GRASIM
2,761
2,792
2,813
2,844
HCLTECH
813
826
835
848
857
HDFC
816
822
828
834
840
HDFCBANK
647
653
662
669
678
HEROMOTOCO
1,628
1,640
1,652
1,664
1,676
HINDALCO
95
97
99
101
103
HINDUNILVR
585
590
596
601
608
ICICIBANK
1,026
1,032
1,041
1,047
1,056
IDFC
126
127
128
129
131
INDUSINDBK
477
487
500
509
523
INFY
2,478
2,489
2,505
2,516
2,532
ITC
340
343
346
349
352
JINDALSTEL
210
214
218
222
226
JPASSOCIAT
52
53
54
54
55
KOTAKBANK
708
717
727
736
746
LT
1,386
1,400
1,420
1,434
1,453
LUPIN
826
844
855
872
883
M&M
882
897
923
938
964
MARUTI
1,521
1,532
1,541
1,552
1,561
NMDC
102
103
104
106
107
NTPC
138
140
142
143
145
ONGC
289
292
298
302
308
PNB
608
615
627
634
646
POWERGRID
106
107
109
110
112
RANBAXY
340
343
347
350
355
RELIANCE
817
837
858
878
899
RELINFRA
364
370
377
383
391
SBIN
1,830
1,853
1,888
1,912
1,947
SESAGOA
138
140
142
144
147
SUNPHARMA
1,051
1,066
1,081
1,097
1,112
TATAMOTORS
277
280
284
288
292
TATAPOWER
85
86
86
87
88
TATASTEEL
250
253
258
261
266
TCS
1,483
1,498
1,512
1,527
1,541
ULTRACEMCO
1,886
1,920
1,947
1,981
2,009
3
Daily Technical Report
July 11, 2013
Research Team Tel: 022 - 30940000
DISCLAIMER
This document is solely for the personal information of the recipient, and must not be singularly used as the basis of any investment
decision. Nothing in this document should be construed as investment or financial advice. Each recipient of this document should make
such investigations as they deem necessary to arrive at an independent evaluation of an investment in the securities of the companies
referred to in this document (including the merits and risks involved), and should consult their own advisors to determine the merits and
risks of such an investment.
Angel Broking Pvt. Limited, its affiliates, directors, its proprietary trading and investment businesses may, from time to time, make
investment decisions that are inconsistent with or contradictory to the recommendations expressed herein. The views contained in this
document are those of the analyst, and the company may or may not subscribe to all the views expressed within.
Reports based on technical and derivative analysis center on studying charts of a stock's price movement, outstanding positions and
trading volume, as opposed to focusing on a company's fundamentals and, as such, may not match with a report on a company's
fundamentals.
The information in this document has been printed on the basis of publicly available information, internal data and other reliable
sources believed to be true, but we do not represent that it is accurate or complete and it should not be relied on as such, as this
document is for general guidance only. Angel Broking Pvt. Limited or any of its affiliates/ group companies shall not be in any way
responsible for any loss or damage that may arise to any person from any inadvertent error in the information contained in this report.
Angel Broking Pvt. Limited has not independently verified all the information contained within this document. Accordingly, we cannot
testify, nor make any representation or warranty, express or implied, to the accuracy, contents or data contained within this document.
While Angel Broking Pvt. Limited endeavours to update on a reasonable basis the information discussed in this material, there may be
regulatory, compliance, or other reasons that prevent us from doing so.
This document is being supplied to you solely for your information, and its contents, information or data may not be reproduced,
redistributed or passed on, directly or indirectly.
Angel Broking Pvt. Limited and its affiliates may seek to provide or have engaged in providing corporate finance, investment banking
or other advisory services in a merger or specific transaction to the companies referred to in this report, as on the date of this report or
in the past.
Neither Angel Broking Pvt. Limited, nor its directors, employees or affiliates shall be liable for any loss or damage that may arise from
or in connection with the use of this information.
Note: Please refer to the important `Stock Holding Disclosure' report on the Angel website (Research Section). Also, please refer to the
latest update on respective stocks for the disclosure status in respect of those stocks. Angel Broking Pvt. Limited and its affiliates may
have investment positions in the stocks recommended in this report.
Research Team
Shardul Kulkarni
-
Head - Technicals
Sameet Chavan
-
Technical Analyst
Sacchitanand Uttekar
-
Technical Analyst
Angel Broking Pvt. Ltd.
Registered Office: G-1, Ackruti Trade Centre, Rd. No. 7, MIDC, Andheri (E), Mumbai - 400 093.
Corporate Office: 6th Floor, Ackruti Star, MIDC, Andheri (E), Mumbai - 400 093. Tel: (022) 30940000
Sebi Registration No: INB 010996539
4