Daily Technical Report
July 10 , 2013
Exhibit 1: Nifty Daily Chart
Sensex (19439) / NIFTY (5859)
Yesterday, our markets opened with half a percent up side
gap in-line with positive Asian bourses. Subsequently,
benchmark indices oscillated within a narrow trading range
for the entire session to close in the positive territory. The
Consumer Durables, Realty, Capital Goods & Banking
counters contributed heavily in yesterday’s up move. There
was no sector in the negative territory. The advance to
decline ratio was in favor of advancing counters. (A=1306
Formation
The ’89-day EMA’ and the ’89-week EMA’ are placed at
19331 / 5849 and 18521 / 5604 levels, respectively.
The ’20-day EMA’ and the ‘20-week EMA’ are placed at
19269/ 5811 and 19340 / 5852, respectively.
The weekly ‘RSI’ and ‘Stochastic’ oscillators are positively
poised.
The 61.8% and 78.60% Fibonacci retracement levels of
Source: Falcon:
the fall from 20444 / 6229 to 18467/ 5566 are placed
at 19689 / 5976 and 20021 / 6088, respectively.
Actionable points:
The weekly chart now depicts a ‘Bullish Engulfing’
pattern but the monthly chart shows a 'Bearish Engulfing"
View
Neutral
Japanese candlestick pattern.
Support Levels
5834 - 5760
Trading strategy:
Resistance Level
5904
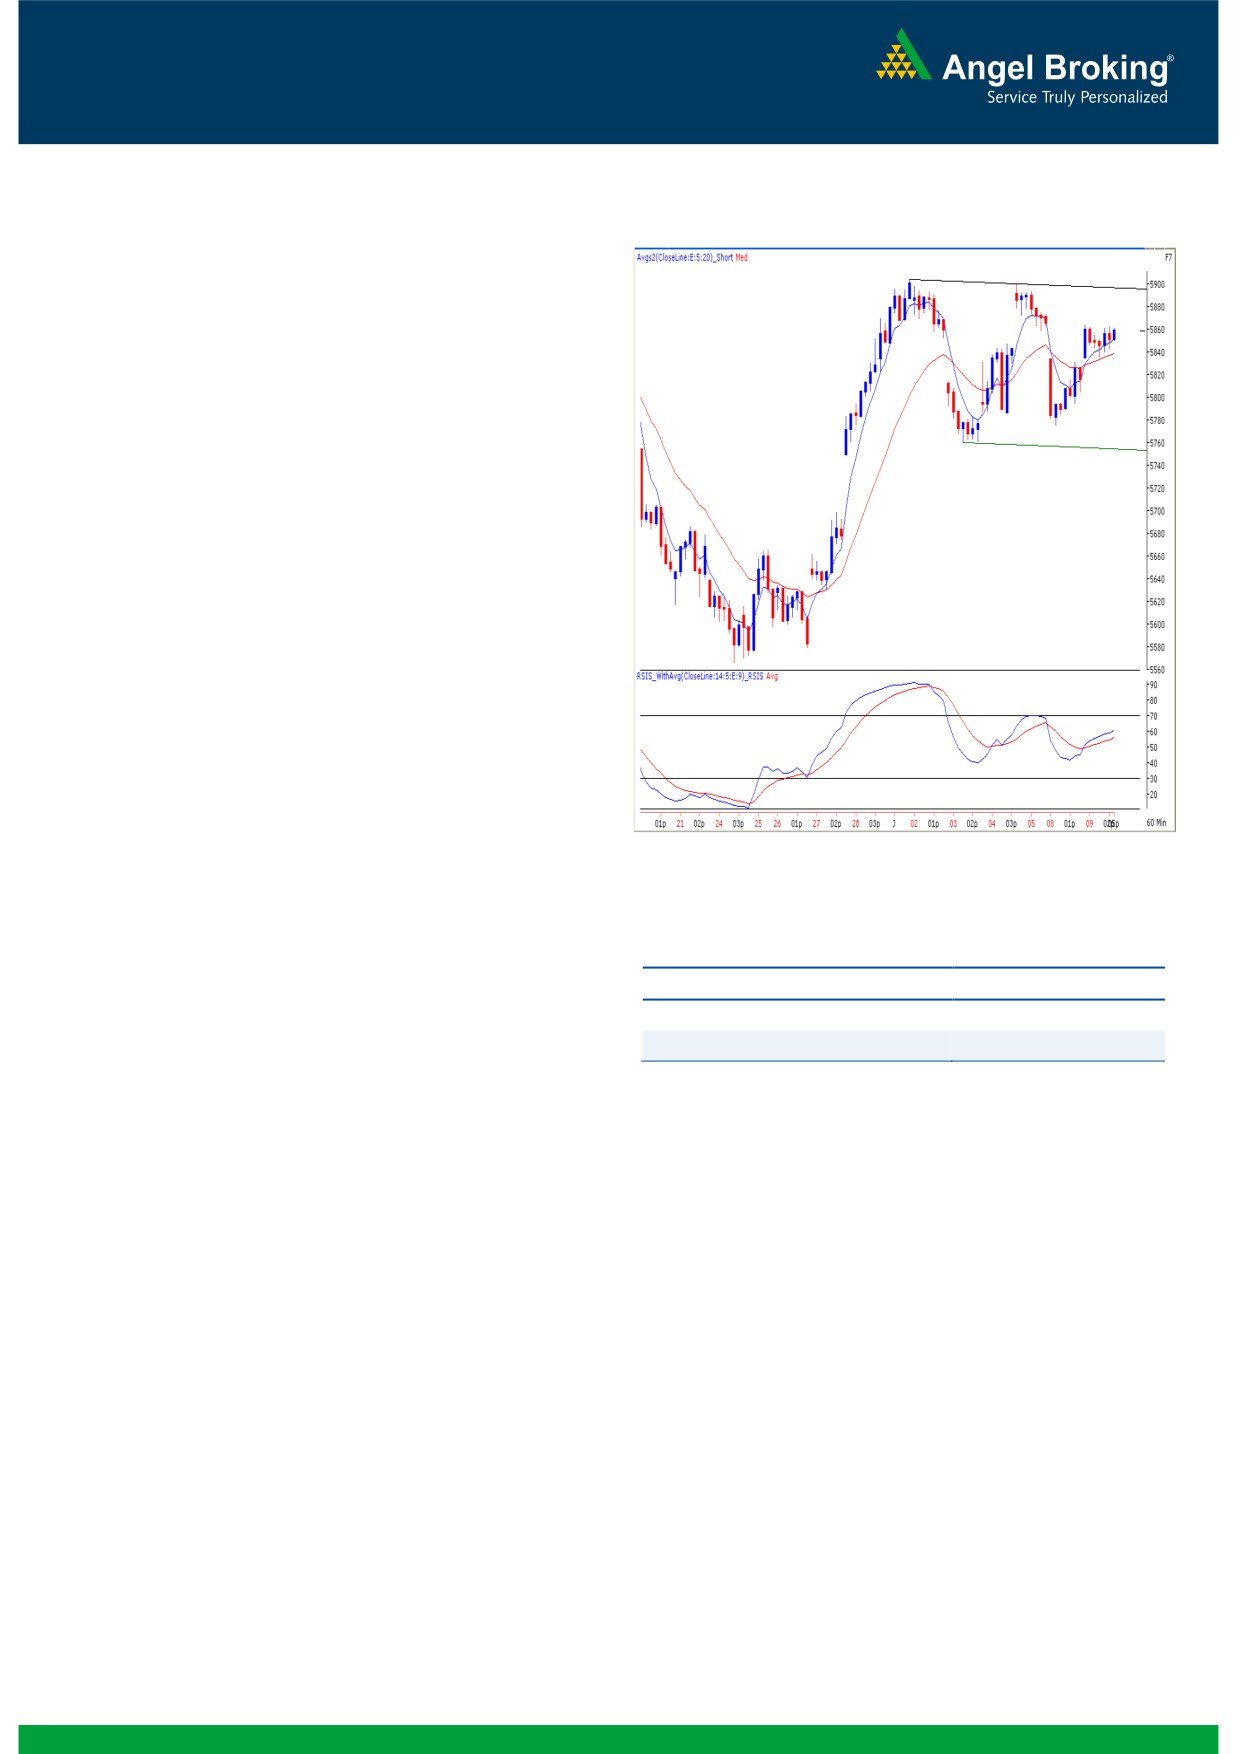
Although our markets opened higher yesterday, the actual
price action was lackluster and range bound. We are now
observing that indices have precisely filled Monday’s
downside gap and closed near that price zone. Considering
the hourly chart, it is clearly seen that indices have been
moving within the ‘Channel’ pattern since last 5 - 6 trading
session. The trading band is similar to the range mentioned
in our earlier report i.e. 19640 - 19147 / 5904 - 5760. As
there is no major change in the chart structure, we continue
to wait for a decisive move beyond the upper or the lower
price of the channel. In bullish scenario, any sustainable
move beyond 19640 / 5904 would push indices higher to
test 19688 / 5976. On the lower side, 19147 / 5760 is a
critical support level for the market. We advise traders to shift
their focus towards the individual stocks and avoid taking
undue risks.
1
Daily Technical Report
July 10, 2013
Exhibit 2: Bank Nifty Daily Chart
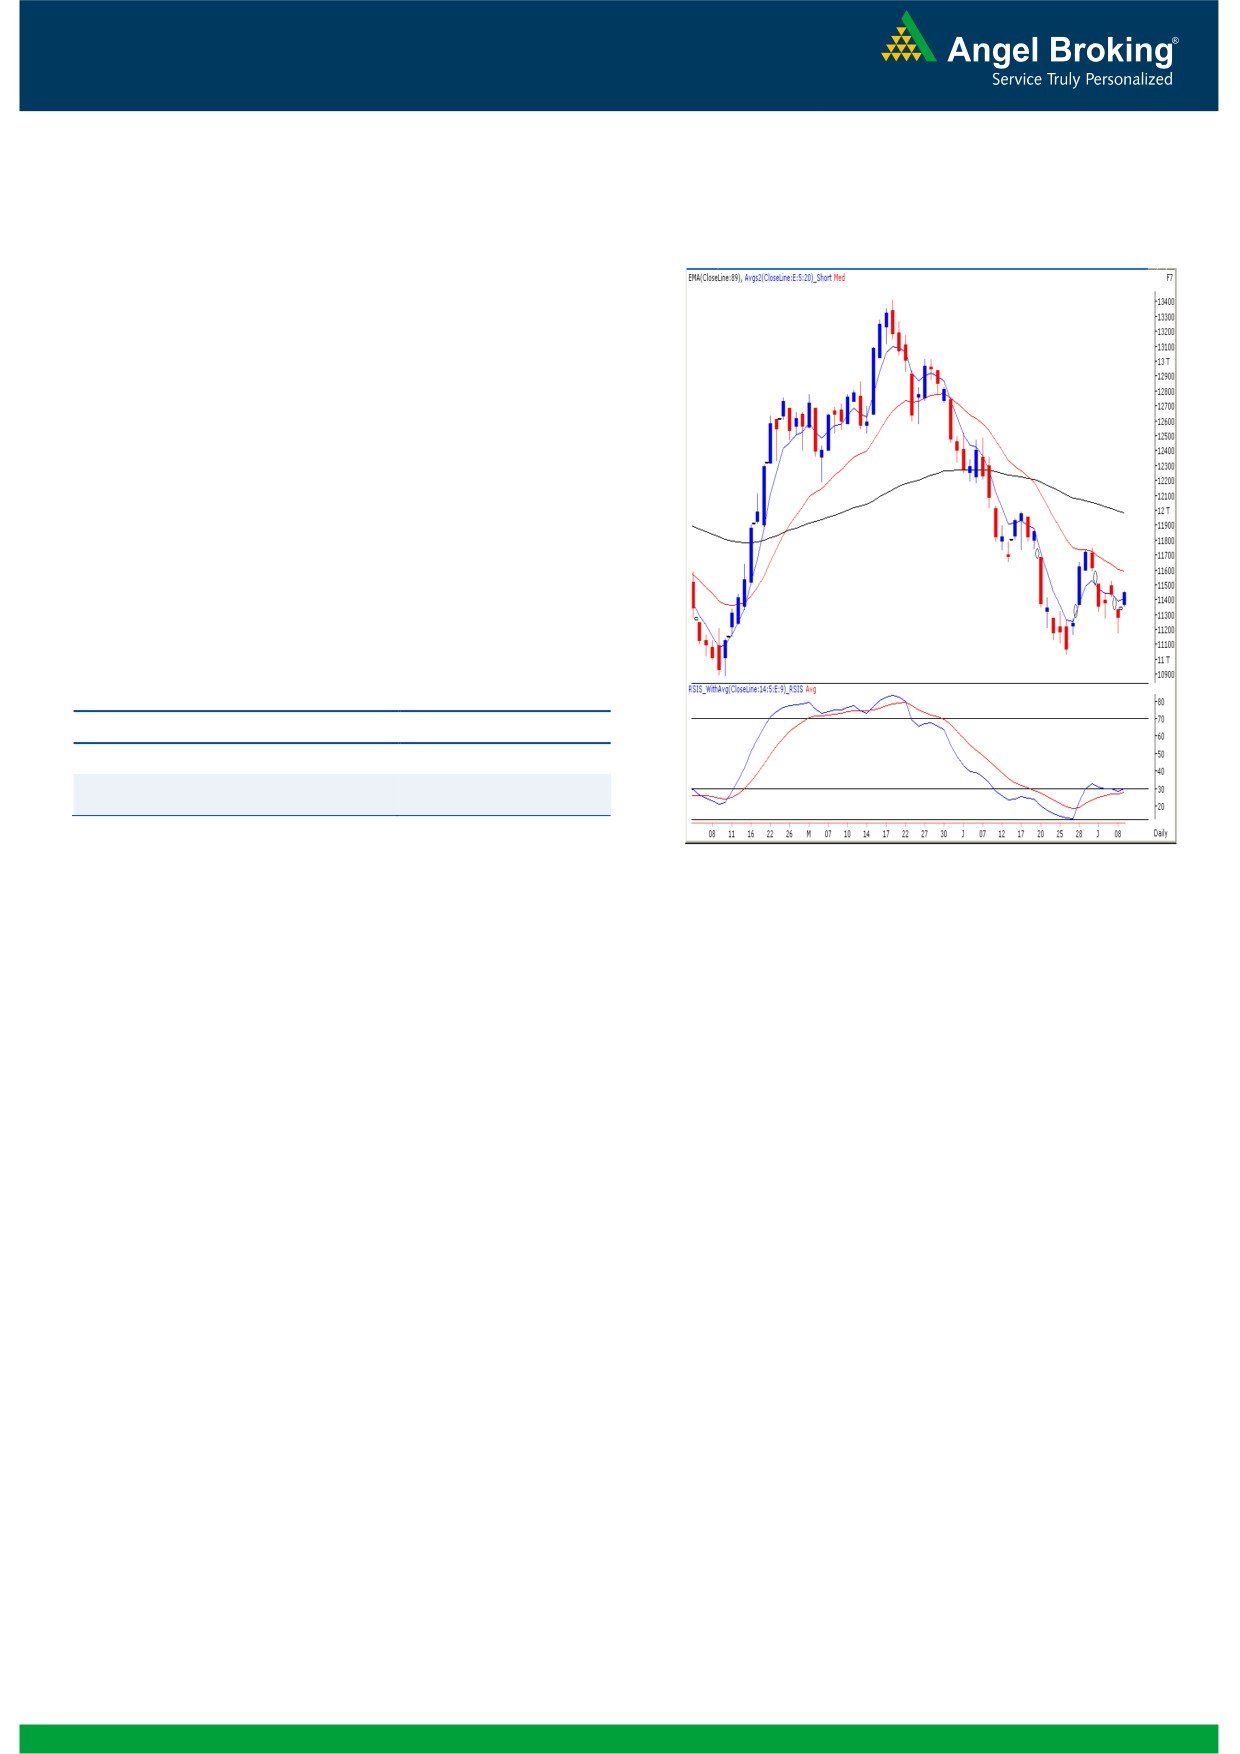
Bank Nifty Outlook - (11442)
Yesterday, the Bank Nifty too opened higher in-line with
our benchmark indices and traded with positive bias
throughout the session. During the session, some of the
individual banks gave a decent move. The Bank Nifty is
now once again hovering below the hourly ’89-EMA’
which is placed at
11465. Hence, going forward, a
sustainable move beyond this level would reinforce the
upward momentum. In this scenario, the Index may move
towards their next resistance levels of 11530 - 11590. On
the downside, 11353 - 11176 would act as immediate
support levels.
Actionable points:
View
Bullish above 11465
Expected Targets
11530 - 11590
Support Level
11353 - 11176
Source: Falcon:
2
Daily Technical Report
July 10, 2013
Research Team Tel: 022 - 30940000
DISCLAIMER
This document is solely for the personal information of the recipient, and must not be singularly used as the basis of any investment
decision. Nothing in this document should be construed as investment or financial advice. Each recipient of this document should make
such investigations as they deem necessary to arrive at an independent evaluation of an investment in the securities of the companies
referred to in this document (including the merits and risks involved), and should consult their own advisors to determine the merits and
risks of such an investment.
Angel Broking Pvt. Limited, its affiliates, directors, its proprietary trading and investment businesses may, from time to time, make
investment decisions that are inconsistent with or contradictory to the recommendations expressed herein. The views contained in this
document are those of the analyst, and the company may or may not subscribe to all the views expressed within.
Reports based on technical and derivative analysis center on studying charts of a stock's price movement, outstanding positions and
trading volume, as opposed to focusing on a company's fundamentals and, as such, may not match with a report on a company's
fundamentals.
The information in this document has been printed on the basis of publicly available information, internal data and other reliable
sources believed to be true, but we do not represent that it is accurate or complete and it should not be relied on as such, as this
document is for general guidance only. Angel Broking Pvt. Limited or any of its affiliates/ group companies shall not be in any way
responsible for any loss or damage that may arise to any person from any inadvertent error in the information contained in this report.
Angel Broking Pvt. Limited has not independently verified all the information contained within this document. Accordingly, we cannot
testify, nor make any representation or warranty, express or implied, to the accuracy, contents or data contained within this document.
While Angel Broking Pvt. Limited endeavours to update on a reasonable basis the information discussed in this material, there may be
regulatory, compliance, or other reasons that prevent us from doing so.
This document is being supplied to you solely for your information, and its contents, information or data may not be reproduced,
redistributed or passed on, directly or indirectly.
Angel Broking Pvt. Limited and its affiliates may seek to provide or have engaged in providing corporate finance, investment banking
or other advisory services in a merger or specific transaction to the companies referred to in this report, as on the date of this report or
in the past.
Neither Angel Broking Pvt. Limited, nor its directors, employees or affiliates shall be liable for any loss or damage that may arise from
or in connection with the use of this information.
Note: Please refer to the important `Stock Holding Disclosure' report on the Angel website (Research Section). Also, please refer to the
latest update on respective stocks for the disclosure status in respect of those stocks. Angel Broking Pvt. Limited and its affiliates may
have investment positions in the stocks recommended in this report.
Research Team
Shardul Kulkarni
-
Head - Technicals
Sameet Chavan
-
Technical Analyst
Sacchitanand Uttekar
-
Technical Analyst
Angel Broking Pvt. Ltd.
Registered Office: G-1, Ackruti Trade Centre, Rd. No. 7, MIDC, Andheri (E), Mumbai - 400 093.
Corporate Office: 6th Floor, Ackruti Star, MIDC, Andheri (E), Mumbai - 400 093. Tel: (022) 30940000
Sebi Registration No: INB 010996539
4