Daily Technical Report
July 08 , 2013
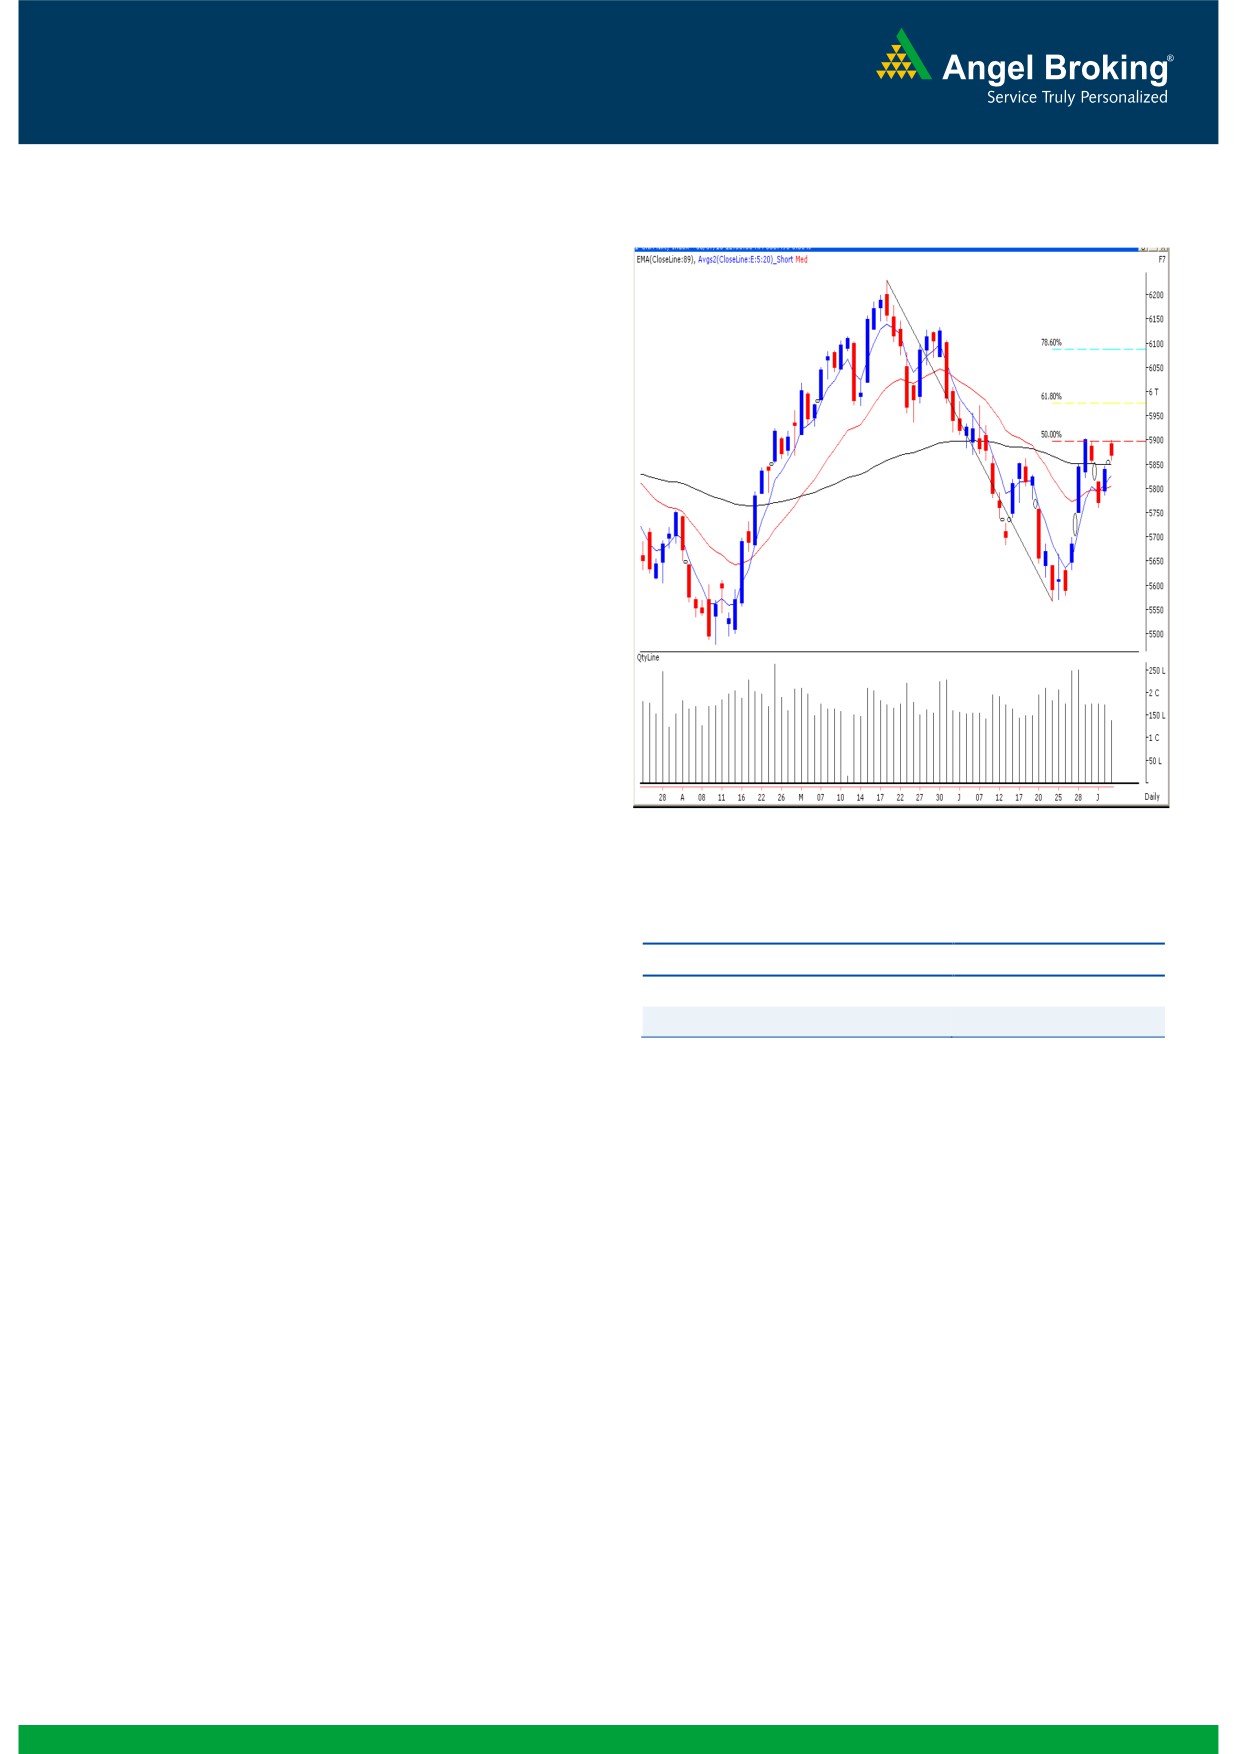
Exhibit 1: Nifty Daily Chart
Sensex (19496) / NIFTY (5868)
On Friday our Benchmark indices opened on a positive note
in line with global cues. Subsequently, indices traded within
a narrow range throughout the first half of the trading
session. However, during the second half, we witnessed
some selling pressure in our market. As a result, indices
trimmed some of their early gains and eventually closed
marginally in the positive territory. The FMCG, OIL & GAS
and METAL counters traded with optimism; whereas the
TECK & IT sectors remained under pressure throughout the
day. The advance to decline ratio was marginally in favour
of advancing counters. (A=1200 D=1135) (Source-
Formation
The ’89-day EMA’ and the ’89-week EMA’ are placed at
19329 / 5850 and 18500 / 5598 levels, respectively.
The ’20-day EMA’ and the ‘20-week EMA’ are placed at
19243 / 5805 and 19330 / 5851, respectively.
Source: Falcon:
The weekly ‘RSI’ and ‘Stochastic’ oscillators are positively
poised.
Actionable points:
The 61.8% and 78.60% Fibonacci retracement levels of
the fall from 20444 / 6229 to 18467/ 5566 are placed
View
Bearish Below 5858
at 19689 / 5976 and 20021 / 6088, respectively.
Expected Targets
5815 - 5786
The weekly chart now depicts a ‘Bullish Engulfing’
Resistance Levels
5900
pattern but the monthly chart shows a 'Bearish Engulfing"
Japanese candlestick pattern.
On the flip side, this week’s low of 19147 / 5760 would act
Trading strategy:
as a key support level for the market. Any sustainable move
The concluded week’s price action can easily be described as
below this level would trigger immense pessimism in the
a ‘Tug-of-War’ between the bulls and the bears. After a
market. As a result, indices may go back to test 18925 -
decent up move, indices came off sharply at the middle of
18688 / 5700 - 5630 levels. In broader perspective, a move
the week and again retested early-week highs in the latter
beyond the trading range of 19640 - 19147 / 5904 - 5760
part of the week. The indices have closed marginally above
would dictate the near term direction.
the daily ’89-EMA’ level of 19329 / 5850. Also, we are
observing that indices are hovering around the
50%
Fibonacci retracement level of the fall from 20444 / 6229 to
18467 / 5566, which is placed at 19455 / 5898. During the
week, indices confirmed the weekly ‘Bullish Engulfing’
pattern mentioned in our previous weekly report. The
momentum oscillators on the weekly chart are positively
poised. The impact of these evidences would be seen once
indices sustain above this week’s high of 19640 / 5904. In
such a scenario, indices may rally towards the 61.8% and
78.6% Fibonacci retracement levels placed at 19689 / 5976
and 20021 / 6088.
1
Daily Technical Report
July 08, 2013
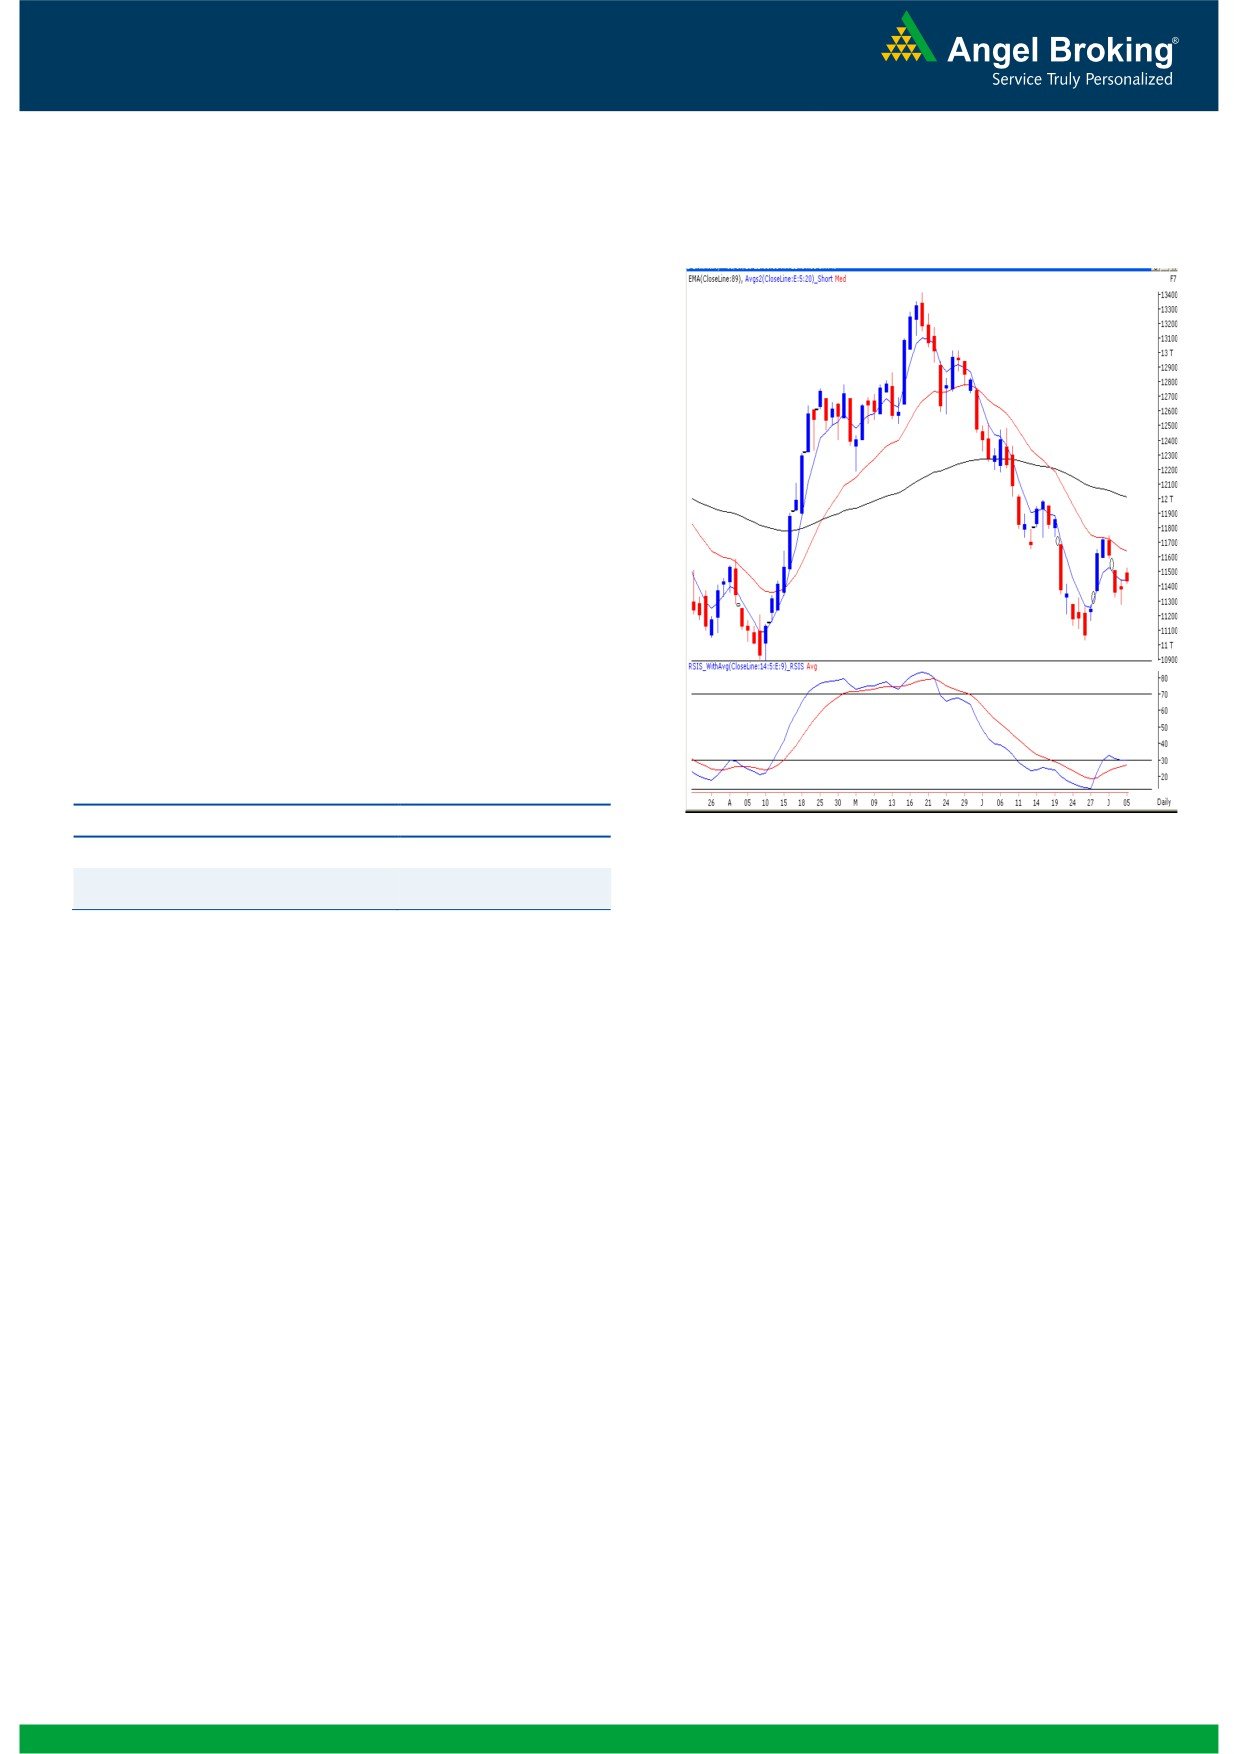
Exhibit 2: Bank Nifty Daily Chart
Bank Nifty Outlook - (11434)
The concluding session of the week started off on a high
note in-line with our benchmark indices. However, we
observed that Bank Nifty could not continue its early
momentum and immediately slipped into a consolidation
mode. The hourly '89 EMA' level of 11520 acted as a
strong resistance for the index. Hence, selling pressure
near this resistance resulted in modest correction to end
the session on muted note. Going forward, only a
sustainable move beyond Friday's high of 11530 would
attract some buying interest among market participants. In
this scenario, the index may rally towards 11590 / 11752.
On the flipside, 11418 would act as a key support in
coming trading session. A fall below 11418 may result in a
further decline towards 11150 levels.
Actionable points:
View
Bearish Below 11418
Source: Falcon:
Expected Targets
11322 - 11273
Resistance Levels
11530
2
Daily Technical Report
July 08, 2013
Daily Pivot Levels for Nifty 50 Stocks
SCRIPS
S2
S1
PIVOT
R1
R2
SENSEX
19,375
19,436
19,538
19,598
19,700
NIFTY
5,834
5,851
5,876
5,893
5,918
BANKNIFTY
11,348
11,391
11,461
11,504
11,574
ACC
1,223
1,231
1,238
1,246
1,254
AMBUJACEM
188
189
190
191
193
ASIANPAINT
4,523
4,596
4,643
4,716
4,762
AXISBANK
1,254
1,271
1,286
1,303
1,319
BAJAJ-AUTO
1,858
1,869
1,881
1,892
1,904
BANKBARODA
547
553
558
563
568
BHARTIARTL
285
290
298
304
312
BHEL
173
176
178
181
183
BPCL
355
360
366
371
377
CAIRN
286
289
293
295
299
CIPLA
393
396
398
401
404
COALINDIA
292
294
298
300
304
DLF
170
174
179
182
187
DRREDDY
2,208
2,223
2,237
2,252
2,265
GAIL
321
324
329
332
338
GRASIM
2,774
2,790
2,805
2,821
2,836
HCLTECH
783
790
798
804
813
HDFC
841
846
853
857
864
HDFCBANK
652
660
666
674
681
HEROMOTOCO
1,624
1,636
1,653
1,665
1,682
HINDALCO
96
98
100
103
105
HINDUNILVR
589
599
615
626
642
ICICIBANK
1,031
1,041
1,059
1,069
1,087
IDFC
124
127
128
132
133
INDUSINDBK
460
467
473
481
487
INFY
2,415
2,435
2,459
2,480
2,504
ITC
338
340
343
345
347
JINDALSTEL
212
218
222
227
231
JPASSOCIAT
53
54
54
55
56
KOTAKBANK
694
698
703
707
712
LT
1,388
1,398
1,414
1,425
1,441
LUPIN
819
827
841
849
862
M&M
951
961
975
986
999
MARUTI
1,534
1,544
1,560
1,570
1,586
NMDC
100
102
103
105
106
NTPC
141
142
144
145
147
ONGC
308
312
315
319
321
PNB
610
618
626
633
641
POWERGRID
106
107
108
109
110
RANBAXY
332
337
342
347
353
RELIANCE
859
870
877
888
896
RELINFRA
346
353
362
369
377
SBIN
1,864
1,879
1,903
1,919
1,943
SESAGOA
138
141
143
146
148
SUNPHARMA
1,023
1,030
1,038
1,044
1,053
TATAMOTORS
291
293
296
299
301
TATAPOWER
84
85
86
87
89
TATASTEEL
260
262
266
269
272
TCS
1,501
1,515
1,537
1,551
1,573
ULTRACEMCO
1,875
1,901
1,916
1,941
1,957
3
Daily Technical Report
July 08, 2013
Research Team Tel: 022 - 30940000
DISCLAIMER
This document is solely for the personal information of the recipient, and must not be singularly used as the basis of any investment
decision. Nothing in this document should be construed as investment or financial advice. Each recipient of this document should make
such investigations as they deem necessary to arrive at an independent evaluation of an investment in the securities of the companies
referred to in this document (including the merits and risks involved), and should consult their own advisors to determine the merits and
risks of such an investment.
Angel Broking Pvt. Limited, its affiliates, directors, its proprietary trading and investment businesses may, from time to time, make
investment decisions that are inconsistent with or contradictory to the recommendations expressed herein. The views contained in this
document are those of the analyst, and the company may or may not subscribe to all the views expressed within.
Reports based on technical and derivative analysis center on studying charts of a stock's price movement, outstanding positions and
trading volume, as opposed to focusing on a company's fundamentals and, as such, may not match with a report on a company's
fundamentals.
The information in this document has been printed on the basis of publicly available information, internal data and other reliable
sources believed to be true, but we do not represent that it is accurate or complete and it should not be relied on as such, as this
document is for general guidance only. Angel Broking Pvt. Limited or any of its affiliates/ group companies shall not be in any way
responsible for any loss or damage that may arise to any person from any inadvertent error in the information contained in this report.
Angel Broking Pvt. Limited has not independently verified all the information contained within this document. Accordingly, we cannot
testify, nor make any representation or warranty, express or implied, to the accuracy, contents or data contained within this document.
While Angel Broking Pvt. Limited endeavours to update on a reasonable basis the information discussed in this material, there may be
regulatory, compliance, or other reasons that prevent us from doing so.
This document is being supplied to you solely for your information, and its contents, information or data may not be reproduced,
redistributed or passed on, directly or indirectly.
Angel Broking Pvt. Limited and its affiliates may seek to provide or have engaged in providing corporate finance, investment banking
or other advisory services in a merger or specific transaction to the companies referred to in this report, as on the date of this report or
in the past.
Neither Angel Broking Pvt. Limited, nor its directors, employees or affiliates shall be liable for any loss or damage that may arise from
or in connection with the use of this information.
Note: Please refer to the important `Stock Holding Disclosure' report on the Angel website (Research Section). Also, please refer to the
latest update on respective stocks for the disclosure status in respect of those stocks. Angel Broking Pvt. Limited and its affiliates may
have investment positions in the stocks recommended in this report.
Research Team
Shardul Kulkarni
-
Head - Technicals
Sameet Chavan
-
Technical Analyst
Sacchitanand Uttekar
-
Technical Analyst
Angel Broking Pvt. Ltd.
Registered Office: G-1, Ackruti Trade Centre, Rd. No. 7, MIDC, Andheri (E), Mumbai - 400 093.
Corporate Office: 6th Floor, Ackruti Star, MIDC, Andheri (E), Mumbai - 400 093. Tel: (022) 30940000
Sebi Registration No: INB 010996539
4