Daily Technical Report
July 03 , 2013
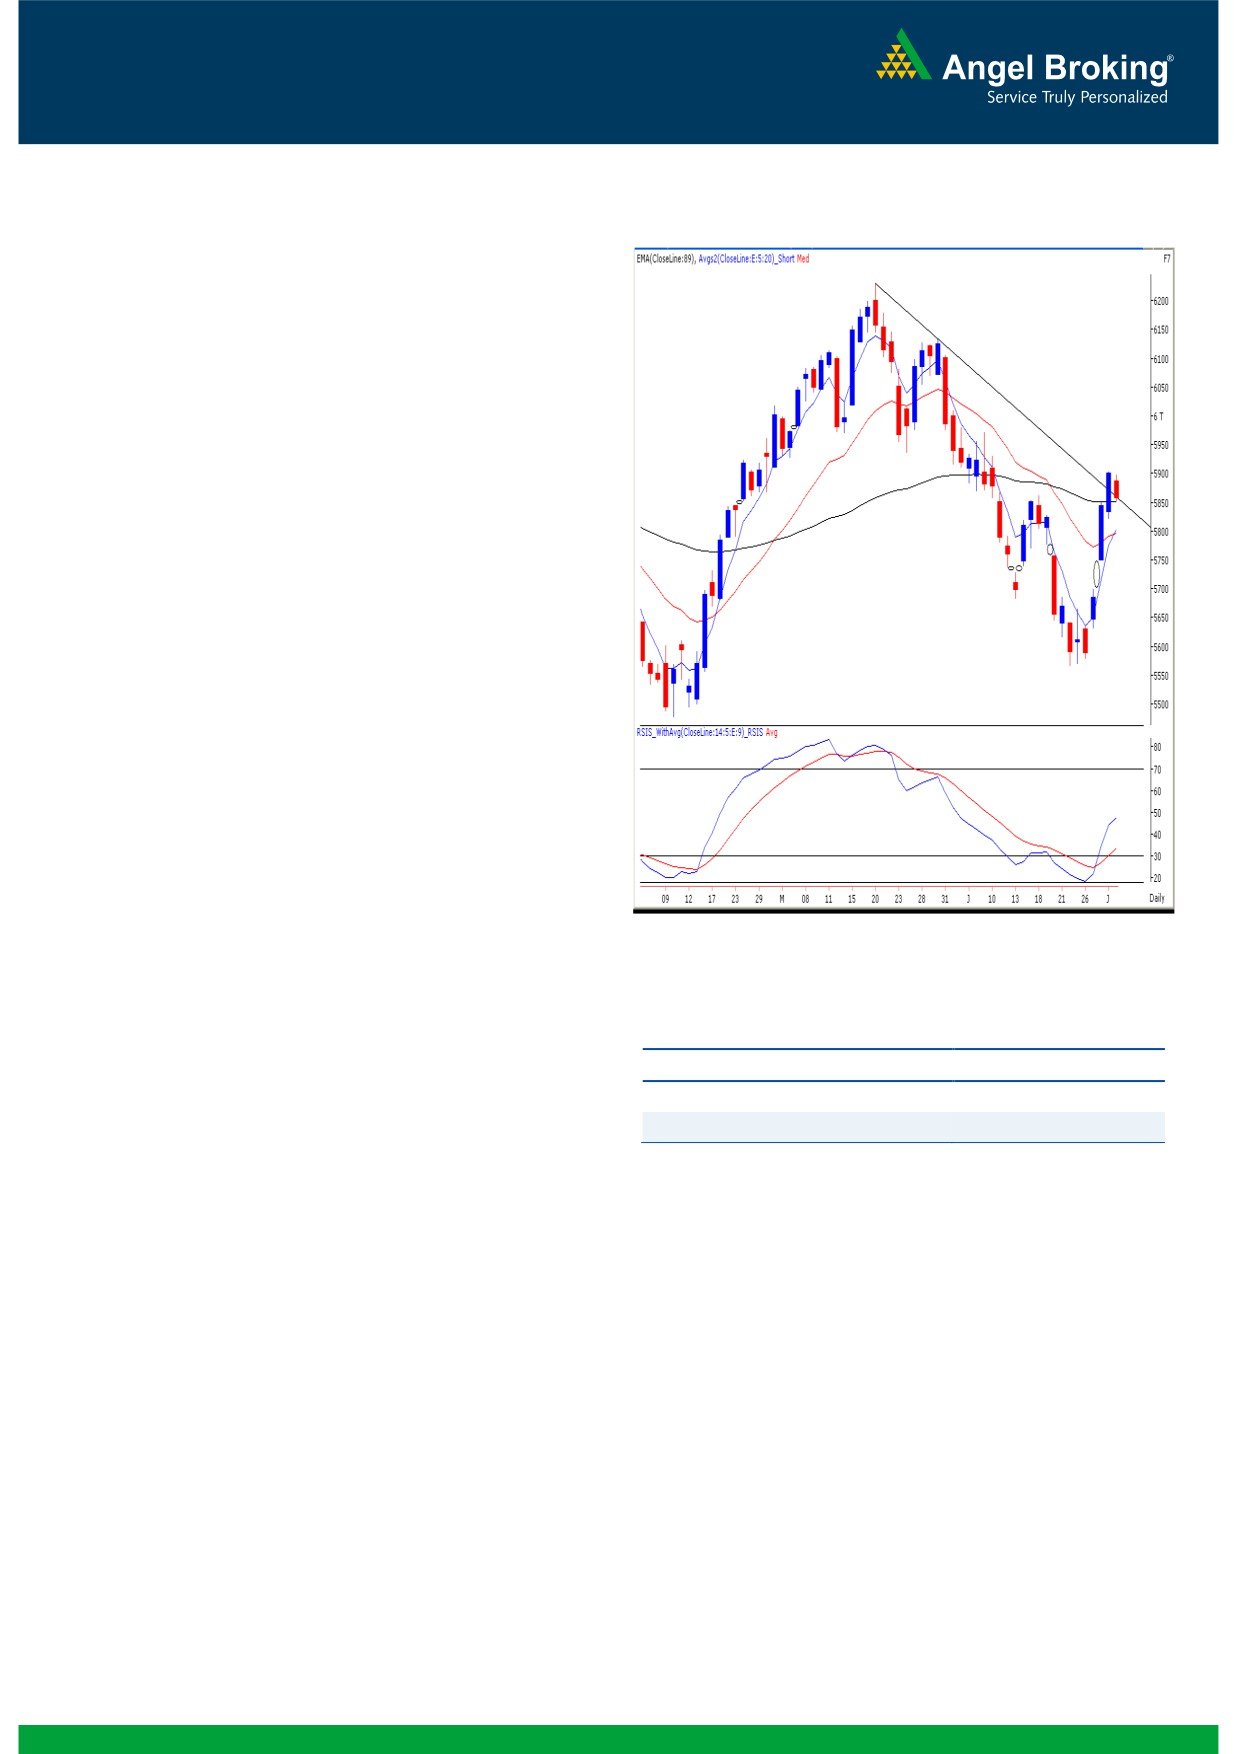
Exhibit 1: Nifty Daily Chart
Sensex (19464) / NIFTY (5858)
Yesterday, indices opened marginally lower considering
mixed global cues. Markets failed to cross the previous day’s
high and overall bias was on the negative side. As a result,
indices ended the session almost at the lowest point of the
day. Most sectors ended in the negative territory with the
Realty, PSU and Oil & Gas counters leading the decline;
whereas the Consumer Durables and Health Care counters
ended with very nominal gains. The advance to decline ratio
was marginally in favor of declining counters. (A=1132
Formation
The ’89-day EMA’ and the ’89-Week EMA’ are placed at
19326 / 5852 and 18499/ 5598 levels, respectively.
The ’20-Day EMA’ and the ‘20-Week EMA’ are placed
at 19198/ 5797 and 19327 / 5849, respectively.
The 50% and 61.8% Fibonacci retracement levels of the
fall from 20444 / 6229 to 18467/ 5566 are placed at
19455/ 5898 and 19689 / 5976, respectively.
Source: Falcon:
The weekly chart now depicts a ‘Bullish Engulfing’ but
the monthly chart shows a 'Bearish Engulfing" Japanese
candlestick pattern.
Actionable points:
View
Neutral
Trading strategy:
Resistance Level
5905 - 5932
During yesterday’s session, indices remained under pressure
Support Levels
5822 - 5749
for most part of the day. In the process, the Nifty precisely
tested the daily ’89 EMA’ level of 5852 but closed marginally
above it. Although the daily ‘5 & 20 EMA’ are now signaling
a positive crossover, the Japanese candlestick pattern on the
daily chart is not encouraging. The pattern is a “Bearish
Harami” candlestick pattern and needs confirmation in the
form of a close below the low at 19347 / 5822 level.
Considering the SGX Nifty a gap down opening in our
markets looks like a certainty and a close below 19347 /
5822 would result in the reversal of the bullish momentum
seen in the last few sessions. In this case the markets may
move lower to test Friday’s low of 19093 / 5749. On the
other hand Monday’s high of 19599 / 5905 is the crucial
resistance for the Indices. A close beyond this level may result
in a move towards the 61.8% Fibonacci retracement level
(19689 / 5976) of the fall from 20444 / 6229 to 18467/
5566.
1
Daily Technical Report
July 03, 2013
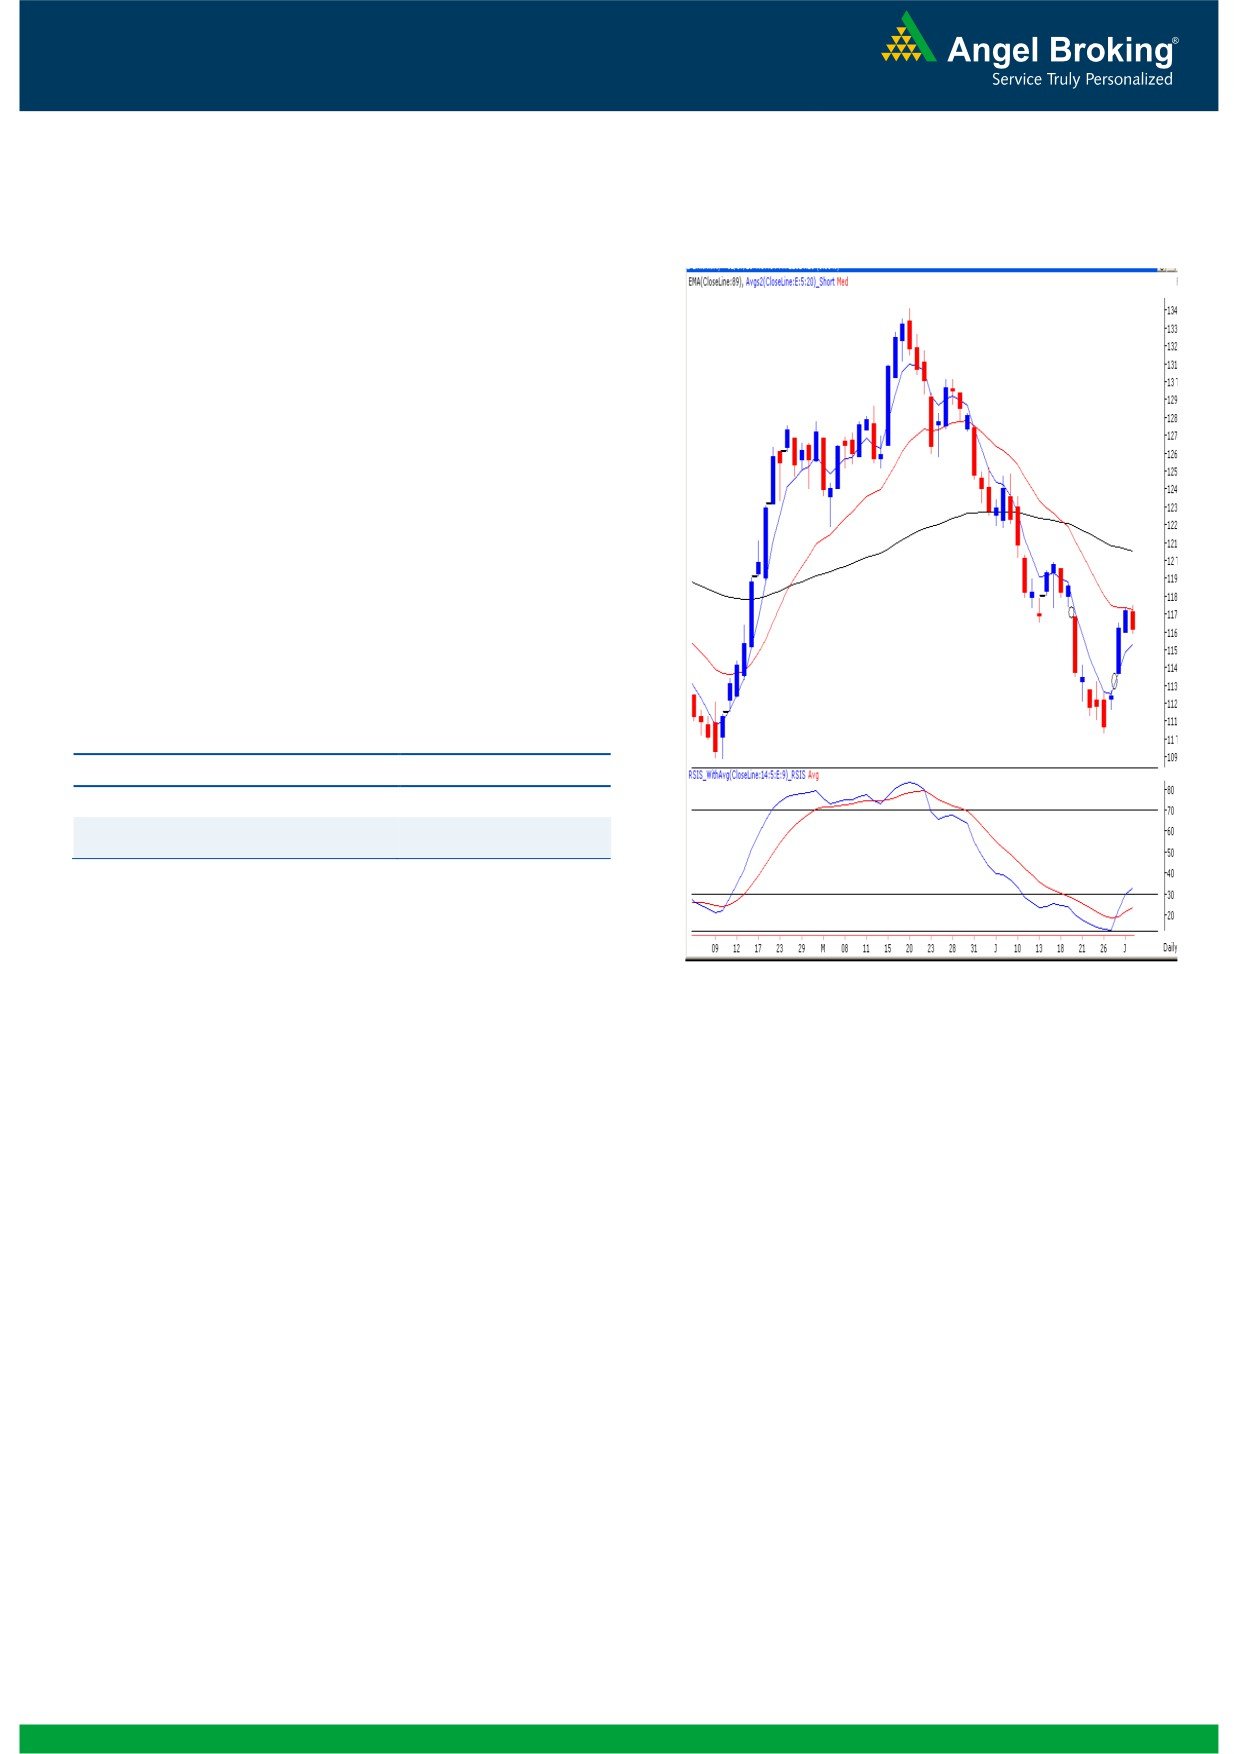
Exhibit 2: Bank Nifty Daily Chart
Bank Nifty Outlook - (11614)
Yesterday, the Bank Nifty too opened on a flat note and
immediately made an attempt to cross the daily ’20 EMA’. As
expected, this level acted as a strong resistance during the
day and the Bank Nifty eventually closed in the negative
territory. Going forward, we reiterate our view that buying in
the Index is expected only if Index sustains above the high of
11753. In this scenario the Bank Nifty may rally towards the
next resistance of
11867
/
11950. On the flipside, a
sustainable move below yesterday’s low of 11590 may trigger
significant pessimism in the index. As a result, the Bank Nifty
may slide towards 11497 / 11367 levels.
Actionable points:
View
Bearish below 11590
Expected Targets
11479 - 11395
Resistance Levels
11753 - 11867
Source: Falcon:
2
Daily Technical Report
July 03, 2013
Research Team Tel: 022 - 30940000
DISCLAIMER
This document is solely for the personal information of the recipient, and must not be singularly used as the basis of any investment
decision. Nothing in this document should be construed as investment or financial advice. Each recipient of this document should make
such investigations as they deem necessary to arrive at an independent evaluation of an investment in the securities of the companies
referred to in this document (including the merits and risks involved), and should consult their own advisors to determine the merits and
risks of such an investment.
Angel Broking Limited, its affiliates, directors, its proprietary trading and investment businesses may, from time to time, make
investment decisions that are inconsistent with or contradictory to the recommendations expressed herein. The views contained in this
document are those of the analyst, and the company may or may not subscribe to all the views expressed within.
Reports based on technical and derivative analysis center on studying charts of a stock's price movement, outstanding positions and
trading volume, as opposed to focusing on a company's fundamentals and, as such, may not match with a report on a company's
fundamentals.
The information in this document has been printed on the basis of publicly available information, internal data and other reliable
sources believed to be true, but we do not represent that it is accurate or complete and it should not be relied on as such, as this
document is for general guidance only. Angel Broking Limited or any of its affiliates/ group companies shall not be in any way
responsible for any loss or damage that may arise to any person from any inadvertent error in the information contained in this report.
Angel Broking Limited has not independently verified all the information contained within this document. Accordingly, we cannot testify,
nor make any representation or warranty, express or implied, to the accuracy, contents or data contained within this document. While
Angel Broking Limited endeavors to update on a reasonable basis the information discussed in this material, there may be regulatory,
compliance, or other reasons that prevent us from doing so.
This document is being supplied to you solely for your information, and its contents, information or data may not be reproduced,
redistributed or passed on, directly or indirectly.
Angel Broking Limited and its affiliates may seek to provide or have engaged in providing corporate finance, investment banking or
other advisory services in a merger or specific transaction to the companies referred to in this report, as on the date of this report or in
the past.
Neither Angel Broking Limited, nor its directors, employees or affiliates shall be liable for any loss or damage that may arise from or in
connection with the use of this information.
Note: Please refer to the important `Stock Holding Disclosure' report on the Angel website (Research Section). Also, please refer to the
latest update on respective stocks for the disclosure status in respect of those stocks. Angel Broking Limited and its affiliates may have
investment positions in the stocks recommended in this report.
Research Team
Shardul Kulkarni
-
Head - Technicals
Sameet Chavan
-
Technical Analyst
Sacchitanand Uttekar
-
Technical Analyst
Angel Broking Pvt. Ltd.
Registered Office: G-1, Ackruti Trade Centre, Rd. No. 7, MIDC, Andheri (E), Mumbai - 400 093.
Corporate Office: 6th Floor, Ackruti Star, MIDC, Andheri (E), Mumbai - 400 093. Tel: (022) 30940000
Sebi Registration No: INB 010996539
4