Daily Technical Report
July 02 , 2013
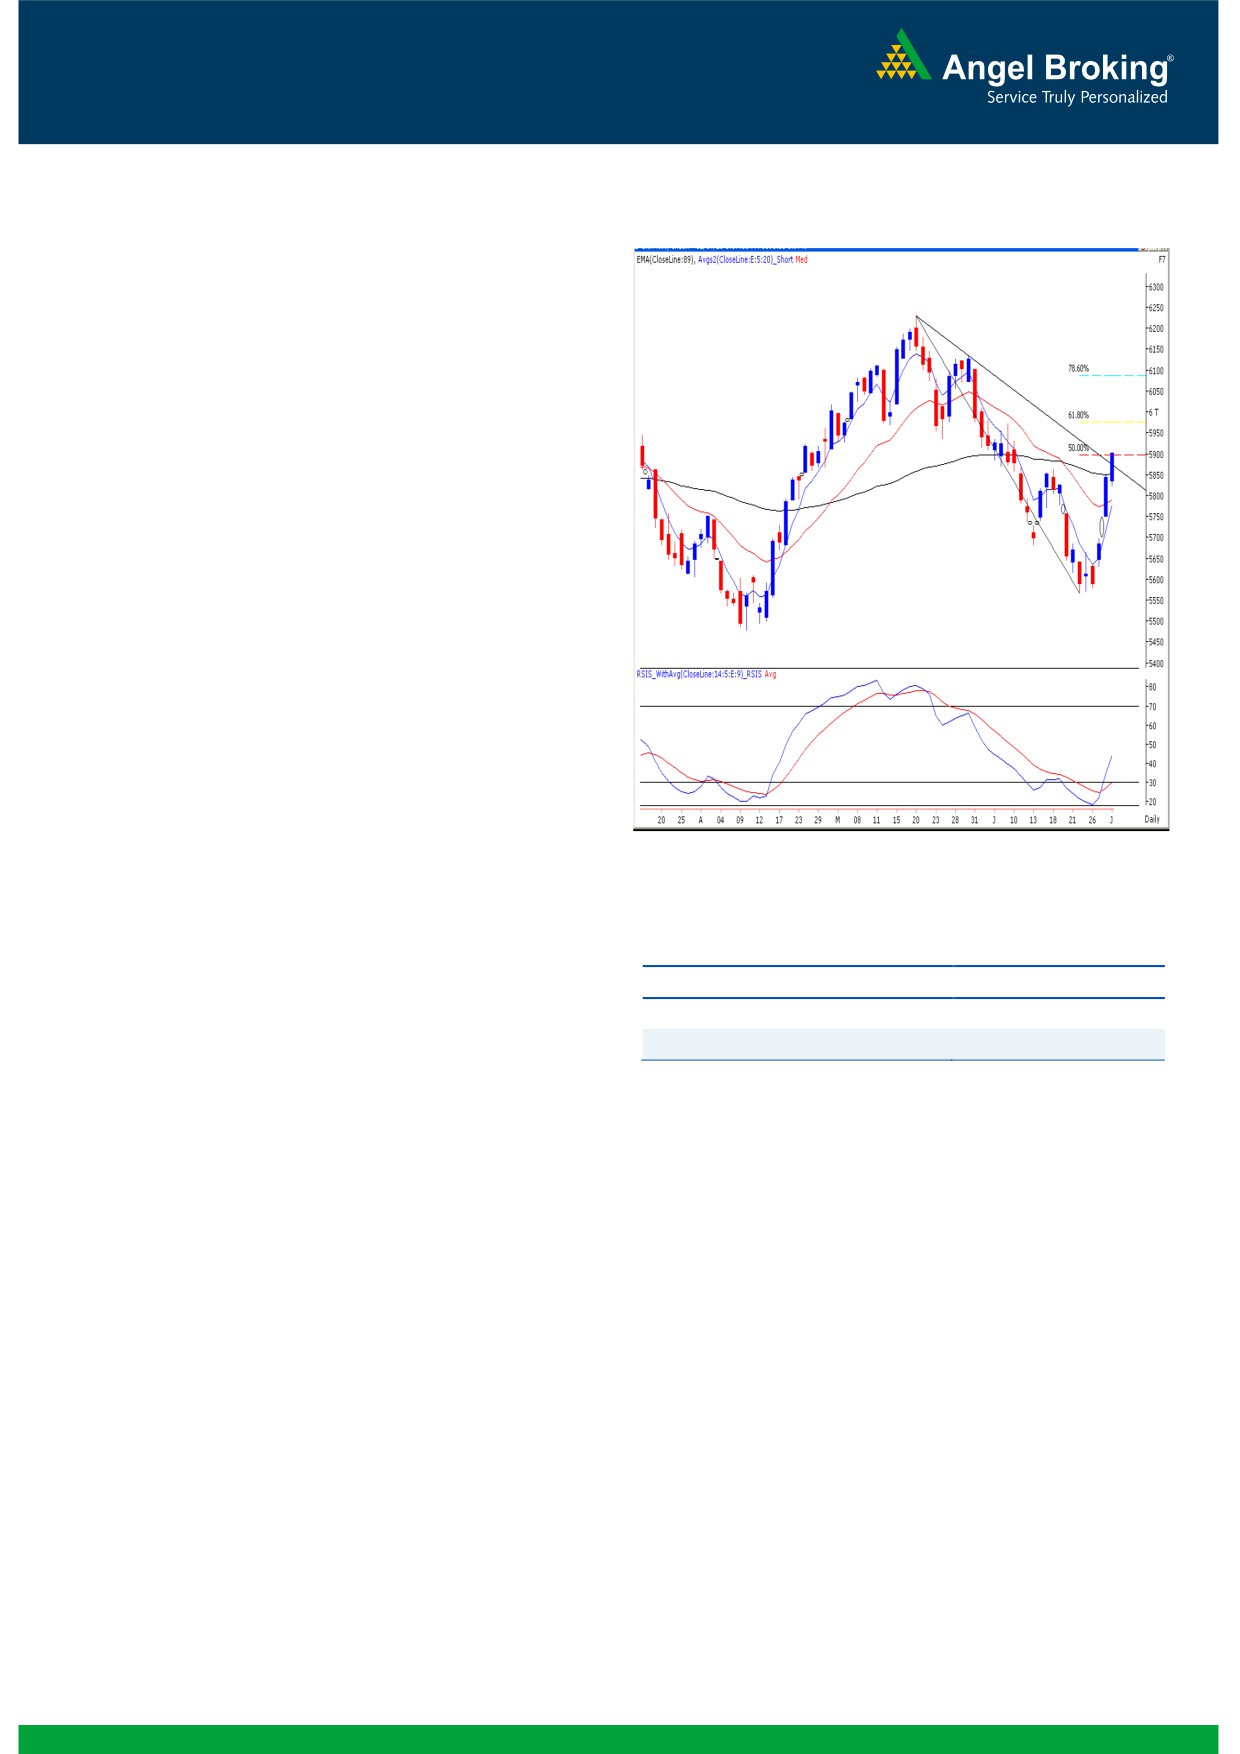
Exhibit 1: Nifty Daily Chart
Sensex (19577) / NIFTY (5899)
The opening session of the week started off on a muted note
considering mixed cues in other Asian bourses.
Subsequently, indices continued to inch higher on the
positive momentum in Friday’s session to eventually close at
the highest point of the day. Except the IT and Teck stocks, all
other sectors ended in the positive territory. The Realty, Power
and Capital Goods counters contributed heavily in
yesterdays up move. The advance to decline ratio was
strongly in favor of advancing counters. (A=1538 D=858)
Formation
The ’89-day EMA’ and the ’89-Week EMA’ are placed at
19323 / 5851 and 18501/ 5598 levels, respectively.
The ’20-Day EMA’ and the ‘20-Week EMA’ are placed
at 19169/ 5790 and 19338 / 5854, respectively.
The 50% and 61.8% Fibonacci retracement levels of the
Source: Falcon:
fall from 20444 / 6229 to 18467/ 5566 are placed at
19455/ 5898 and 19689 / 5976, respectively.
Actionable points:
The weekly chart now depicts a ‘Bullish Engulfing’ but
the monthly chart shows a 'Bearish Engulfing" Japanese
View
Neutral
candlestick pattern.
Resistance Level
5905 - 5932
Support Levels
5823
Trading strategy:
The week commenced on a subdued note but eventually
indices resumed with Friday's positive momentum and
managed to cross the importance resistance of 19455 /
5864. This price action has resulted in violation of daily
'Lower Top Lower Bottom' formation. In addition, we are
observing that the Nifty has penetrated the 'Downward
Sloping Trendline' drawn by joining 6230 (high on May 20,
2013) and 6134 (high on May 30, 2013) (The Sensex is
trading below this Trendline). The Nifty has now tested the
50% Fibonacci retracement level and has closed exactly at
this mark, while the Sensex is significantly above this level.
Going forward if the Indices can cross yesterday high of
19598 / 5905 then further upside momentum may be seen.
In this scenario, we expect the market to move towards
the 61.8% Fibonacci retracement level (19689 / 5976) of the
fall from 20444 / 6229 to 18467/ 5566. On the flipside,
yesterday's low of 19347 / 5823 would act as a key support
level in the coming session.
1
Daily Technical Report
July 02, 2013
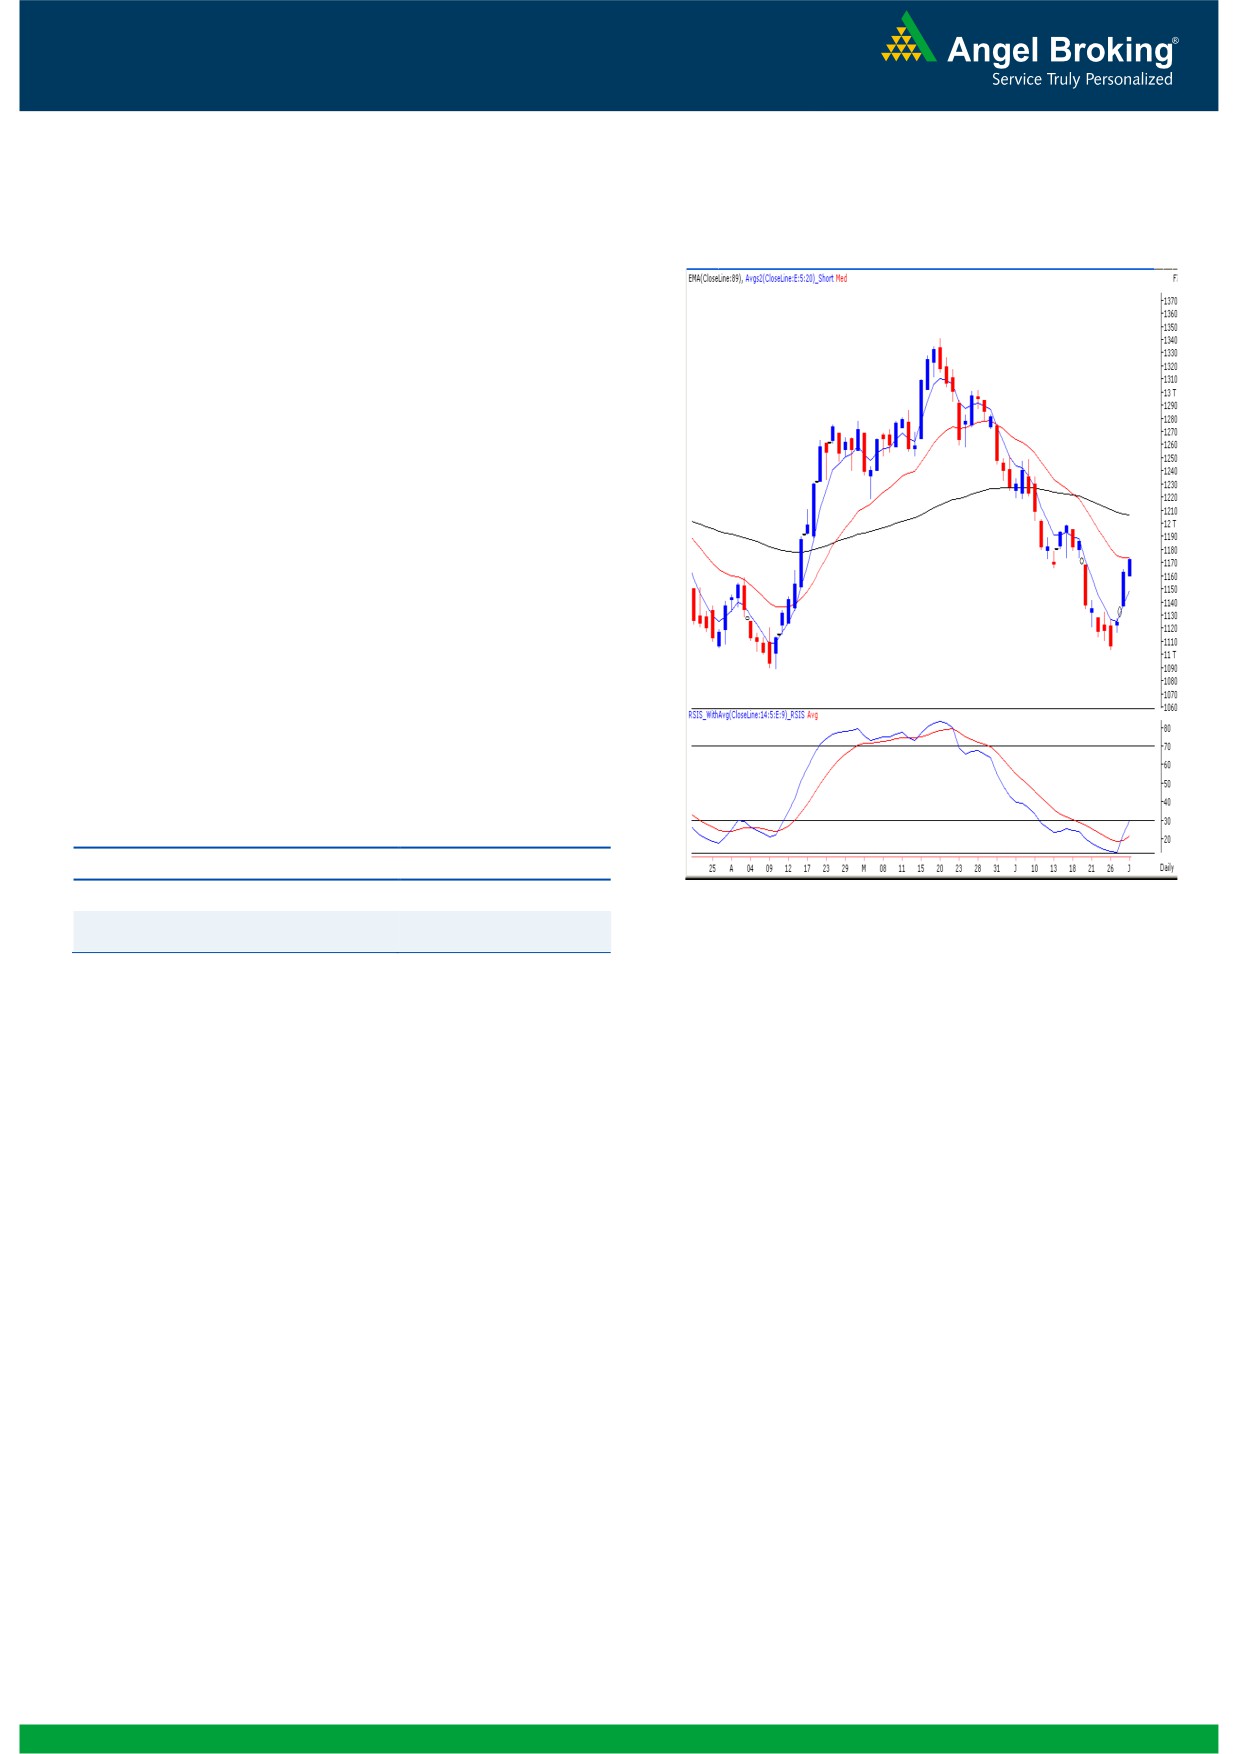
Exhibit 2: Bank Nifty Daily Chart
Bank Nifty Outlook - (11715)
Yesterday, the Bank Nifty too opened higher on the back of
positive domestic events and a cheerful mood across the
globe. As the day progressed, the index gathered further
positive momentum and closed at the highest point of the
day. We are now observing that the daily 'RSI-Smoothened'
oscillator is signaling a positive crossover. However the Bank
Nifty faces significant resistance at the gap area in the range
of 11677 - 11738. Also the index has now precisely tested
daily '20 EMA'. This technical evidence is considered as a.
strong near term resistance. Hence, going forward if the bulls
manage to push the index beyond the 11738 mark, then the
Bank Nifty may move towards its next resistance of 11867 /
11950. Conversely, 11600 / 11367 would act as a decent
support for the day.
Actionable points:
View
Neutral
Resistance Levels
11738
Source: Falcon:
Support Level
11600 - 11367
2
Daily Technical Report
July 02, 2013
Daily Pivot Levels for Nifty 50 Stocks
SCRIPS
S2
S1
PIVOT
R1
R2
SENSEX
19,257
19,417
19,508
19,668
19,759
NIFTY
5,793
5,846
5,875
5,928
5,957
BANKNIFTY
11,546
11,631
11,682
11,766
11,817
ACC
1,191
1,205
1,227
1,241
1,263
AMBUJACEM
184
186
189
191
194
ASIANPAINT
4,544
4,628
4,684
4,769
4,825
AXISBANK
1,307
1,328
1,341
1,362
1,375
BAJAJ-AUTO
1,866
1,894
1,915
1,943
1,964
BANKBARODA
564
577
586
599
608
BHARTIARTL
286
291
296
301
306
BHEL
173
176
178
181
183
BPCL
355
365
370
380
385
CAIRN
285
289
292
297
300
CIPLA
386
392
395
401
405
COALINDIA
301
303
305
308
310
DLF
176
183
186
193
196
DRREDDY
2,187
2,226
2,255
2,294
2,323
GAIL
303
314
321
332
340
GRASIM
2,742
2,772
2,791
2,822
2,841
HCLTECH
741
750
765
774
789
HDFC
851
870
881
900
911
HDFCBANK
660
664
669
674
678
HEROMOTOCO
1,647
1,673
1,691
1,717
1,736
HINDALCO
96
99
101
104
106
HINDUNILVR
581
584
586
590
592
ICICIBANK
1,052
1,060
1,067
1,075
1,082
IDFC
127
128
129
131
132
INDUSINDBK
456
464
473
481
490
INFY
2,423
2,437
2,455
2,469
2,488
ITC
321
323
325
328
329
JINDALSTEL
209
216
221
229
234
JPASSOCIAT
52
54
55
57
58
KOTAKBANK
705
714
725
734
745
LT
1,389
1,420
1,439
1,470
1,489
LUPIN
765
771
779
785
794
M&M
936
961
976
1,001
1,015
MARUTI
1,474
1,540
1,581
1,647
1,688
NMDC
104
105
106
107
108
NTPC
142
145
147
150
152
ONGC
319
323
331
336
344
PNB
644
656
664
676
684
POWERGRID
109
111
112
114
115
RANBAXY
303
314
320
331
337
RELIANCE
844
865
876
897
909
RELINFRA
339
353
360
374
382
SBIN
1,931
1,973
1,997
2,039
2,063
SESAGOA
141
145
147
151
154
SUNPHARMA
986
995
1,011
1,021
1,037
TATAMOTORS
272
281
286
295
300
TATAPOWER
87
88
88
89
90
TATASTEEL
268
274
279
285
289
TCS
1,464
1,478
1,497
1,512
1,531
ULTRACEMCO
1,847
1,890
1,919
1,962
1,992
3
Daily Technical Report
July 02, 2013
Research Team Tel: 022 - 30940000
DISCLAIMER
This document is solely for the personal information of the recipient, and must not be singularly used as the basis of any investment
decision. Nothing in this document should be construed as investment or financial advice. Each recipient of this document should make
such investigations as they deem necessary to arrive at an independent evaluation of an investment in the securities of the companies
referred to in this document (including the merits and risks involved), and should consult their own advisors to determine the merits and
risks of such an investment.
Angel Broking Limited, its affiliates, directors, its proprietary trading and investment businesses may, from time to time, make
investment decisions that are inconsistent with or contradictory to the recommendations expressed herein. The views contained in this
document are those of the analyst, and the company may or may not subscribe to all the views expressed within.
Reports based on technical and derivative analysis center on studying charts of a stock's price movement, outstanding positions and
trading volume, as opposed to focusing on a company's fundamentals and, as such, may not match with a report on a company's
fundamentals.
The information in this document has been printed on the basis of publicly available information, internal data and other reliable
sources believed to be true, but we do not represent that it is accurate or complete and it should not be relied on as such, as this
document is for general guidance only. Angel Broking Limited or any of its affiliates/ group companies shall not be in any way
responsible for any loss or damage that may arise to any person from any inadvertent error in the information contained in this report.
Angel Broking Limited has not independently verified all the information contained within this document. Accordingly, we cannot testify,
nor make any representation or warranty, express or implied, to the accuracy, contents or data contained within this document. While
Angel Broking Limited endeavors to update on a reasonable basis the information discussed in this material, there may be regulatory,
compliance, or other reasons that prevent us from doing so.
This document is being supplied to you solely for your information, and its contents, information or data may not be reproduced,
redistributed or passed on, directly or indirectly.
Angel Broking Limited and its affiliates may seek to provide or have engaged in providing corporate finance, investment banking or
other advisory services in a merger or specific transaction to the companies referred to in this report, as on the date of this report or in
the past.
Neither Angel Broking Limited, nor its directors, employees or affiliates shall be liable for any loss or damage that may arise from or in
connection with the use of this information.
Note: Please refer to the important `Stock Holding Disclosure' report on the Angel website (Research Section). Also, please refer to the
latest update on respective stocks for the disclosure status in respect of those stocks. Angel Broking Limited and its affiliates may have
investment positions in the stocks recommended in this report.
Research Team
Shardul Kulkarni
-
Head - Technicals
Sameet Chavan
-
Technical Analyst
Sacchitanand Uttekar
-
Technical Analyst
Angel Broking Pvt. Ltd.
Registered Office: G-1, Ackruti Trade Centre, Rd. No. 7, MIDC, Andheri (E), Mumbai - 400 093.
Corporate Office: 6th Floor, Ackruti Star, MIDC, Andheri (E), Mumbai - 400 093. Tel: (022) 30940000
Sebi Registration No: INB 010996539
4