Technical & Derivatives Report
January 03, 2017
Sensex (26595) / Nifty (8180)
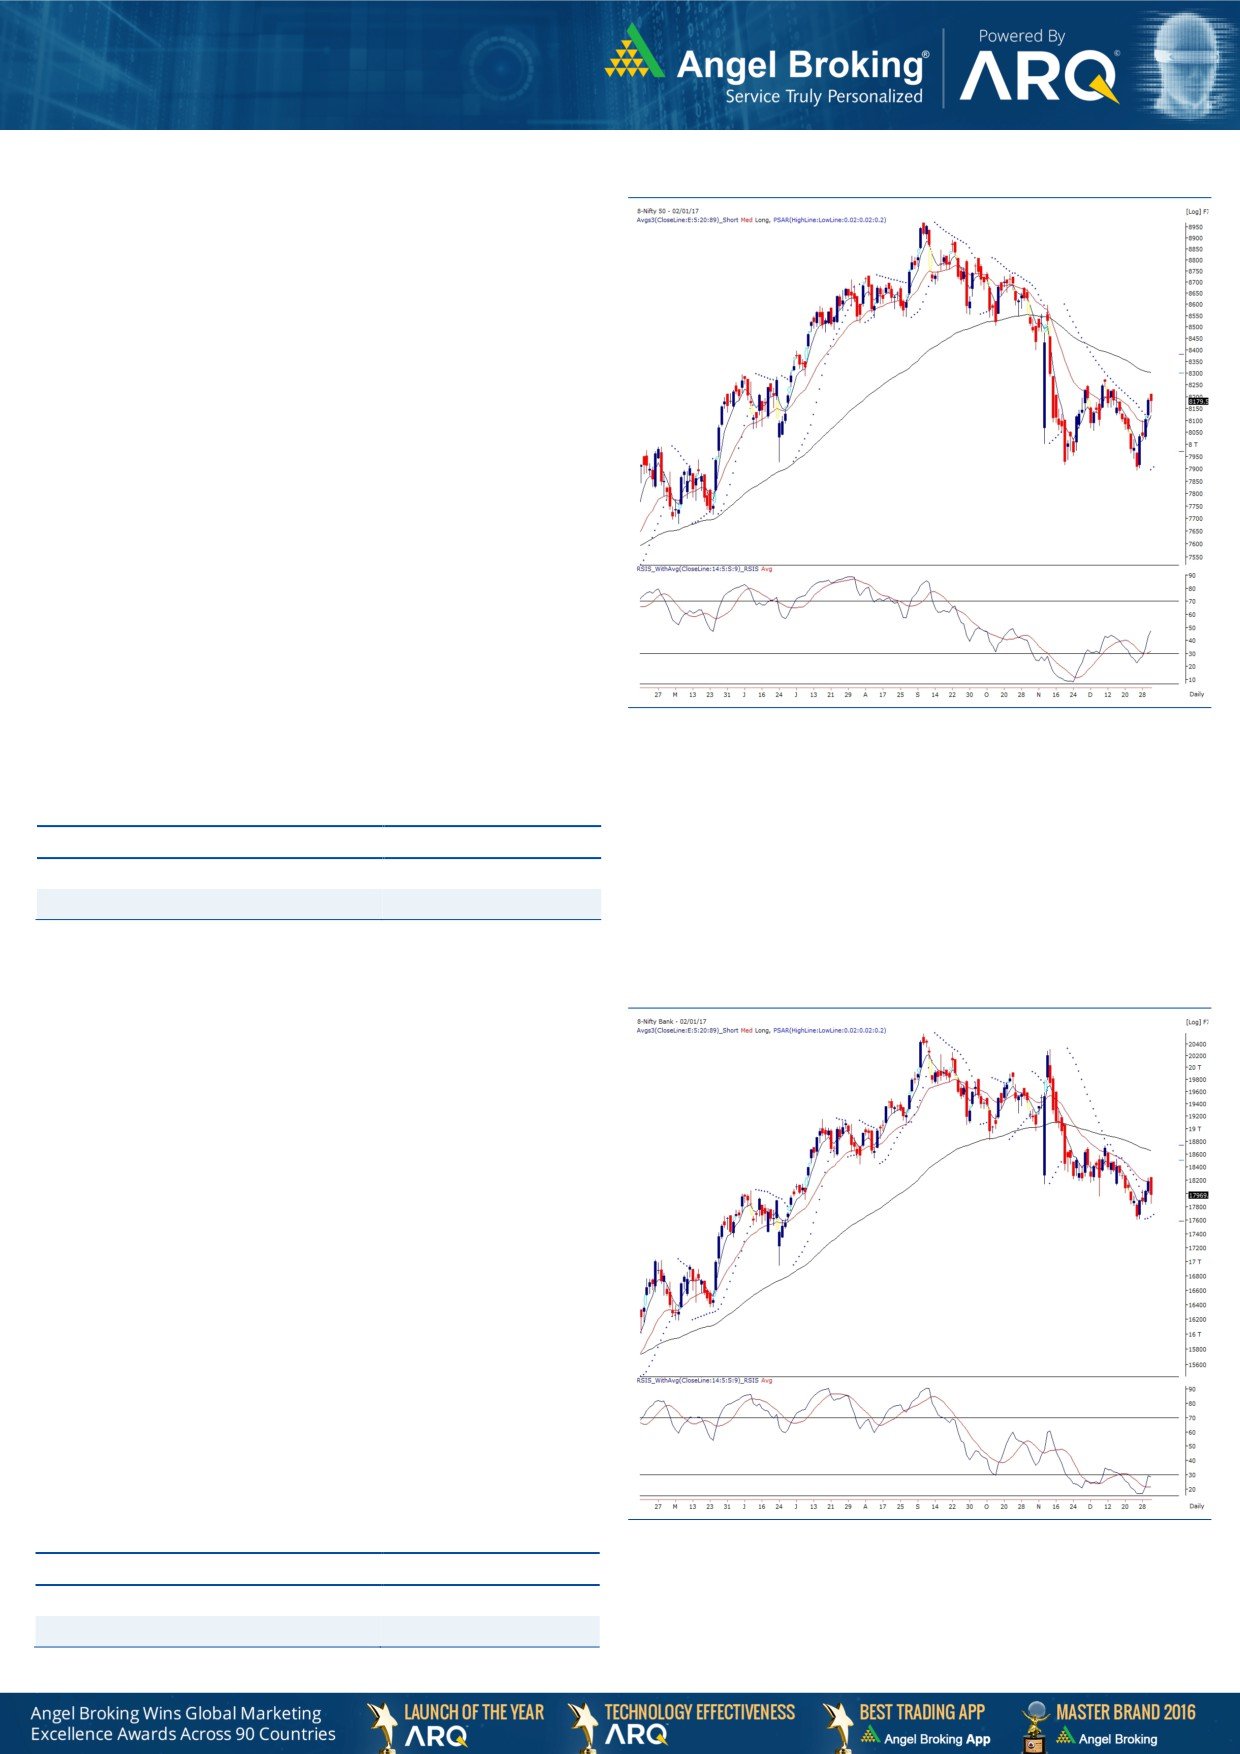
Exhibit 1: Nifty Daily Chart
The opening session of the new calendar year started with a
marginal upside gap, however, the lead was very short lived as
we witnessed a sharp decline in first couple of hours. Post the
midsession, we saw index resuming its last week’s optimism and
as a result, the Nifty managed to recover its lost ground
throughout the second half to end the session with negligible loss.
Yesterday, we saw an attempt of breaking 8200 on Nifty; but, it
was a bit feeble in the opening trades. However, a smart recovery
in the second half was so encouraging; leading to a positive
crossover in ‘5 & 20 EMA’ combination on daily chart. In
addition, on the oscillator front, the ‘RSI-Smoothened’ has
confirmed a ‘1-2-3’ pattern, which is an indication of breaking a
recent swing high of 8274.95 quite soon. Going ahead, we
maintain our optimistic stance on the market and expect the Nifty
to move towards 8229 - 8274 in the forthcoming session. On the
flipside, 8133 - 8100 are now likely to provide a decent support.
We are now seeing lot of trading opportunities in individual stocks
and hence, traders are advised to focus on such developments to
fetch higher returns.
Key Levels
Support 1 - 8133
Resistance 1 - 8229
Support 2 - 8100
Resistance 2 - 8274
Nifty Bank Outlook - (17970)
Exhibit 2: Nifty Bank Daily Chart
In yesterday's trading session, the Nifty Bank index
underperformed the broader indices and ended the session on a
negative note inspite of the positive market breadth. Post
opening, the index resisted around
18250, tad below the
resistance of 18260 which we had mentioned in yesterday's
report. As also highlighted earlier, the Nifty Bank index has
strong support around 17600 whereas resistance is seen around
18260 (hourly
200 SMA). The index will show directional
movement only on breakout of the mentioned range of 17600-
18260. However, due to the recent low at the mentioned support
and the positive market breadth, there is higher probability that
the index will breach the mentioned resistance and head higher in
near term. Hence, traders are advised to trade with positive bias
and initiate positional buying on dips with stop loss below 17600.
The intraday supports for the Nifty Bank index are placed around
17829 and 17600; whereas resistances are seen around 18260
and 18440.
Key Levels
Support 1 - 17829
Resistance 1 - 18260
Support 2 - 17600
Resistance 2 - 18440
Technical & Derivatives Report
January 03, 2017
Comments
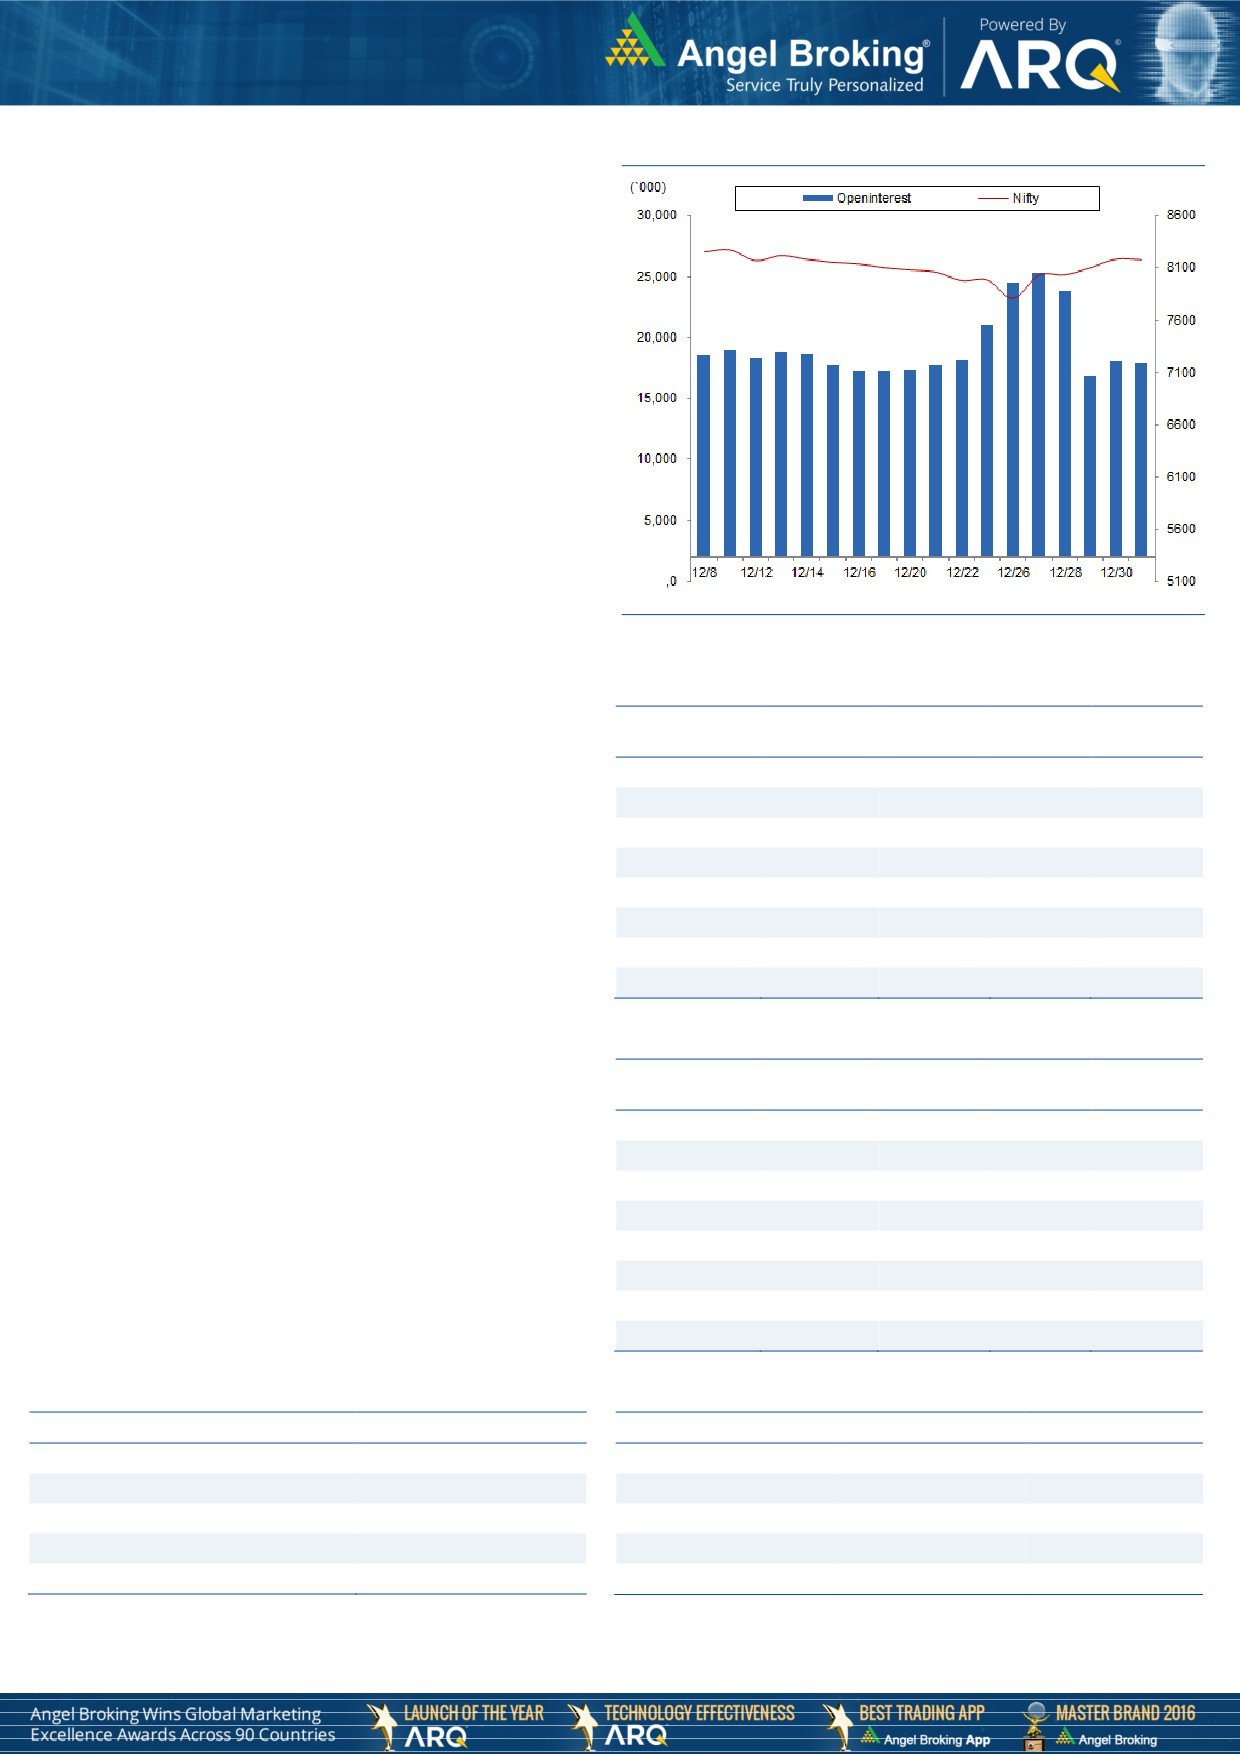
Nifty Vs OI
The Nifty futures open interest has decreased by 0.08%
BankNifty futures open interest has increased by 11.50%
as market closed at 8179.50 levels.
The Nifty January future closed with a premium of 12.60
points against the premium of 1.60 points in last trading
session. The February series closed at a premium of
36.95 points.
The Implied Volatility of at the money options has
increased from 13.27 % to 13.88%. At the same time,
the PCR-OI of Nifty has increased from 1.05 to 1.06
levels.
The total OI of the market is Rs. 2,21,153/- cr. and the
stock futures OI is Rs. 68,852/- cr.
Few of the liquid counters where we have seen high cost
of carry are GMRINFRA, IFCI, FEDERALBNK,
TV18BRDCST and PTC.
Views
OI Gainers
FIIs were net sellers in cash market segment and index
OI
PRICE
futures. They sold equities worth Rs. 261 crores. While, in
SCRIP
OI
PRICE
CHG. (%)
CHG. (%)
index futures, they were net sellers to the tune of Rs. 461
LICHSGFIN
8503000
37.54
532.55
-4.92
crores with some fall in open interest, indicating some
SBIN
78228000
17.67
244.75
-2.06
long unwinding in previous trading session.
HDFC
10697500
11.03
1222.75
-3.40
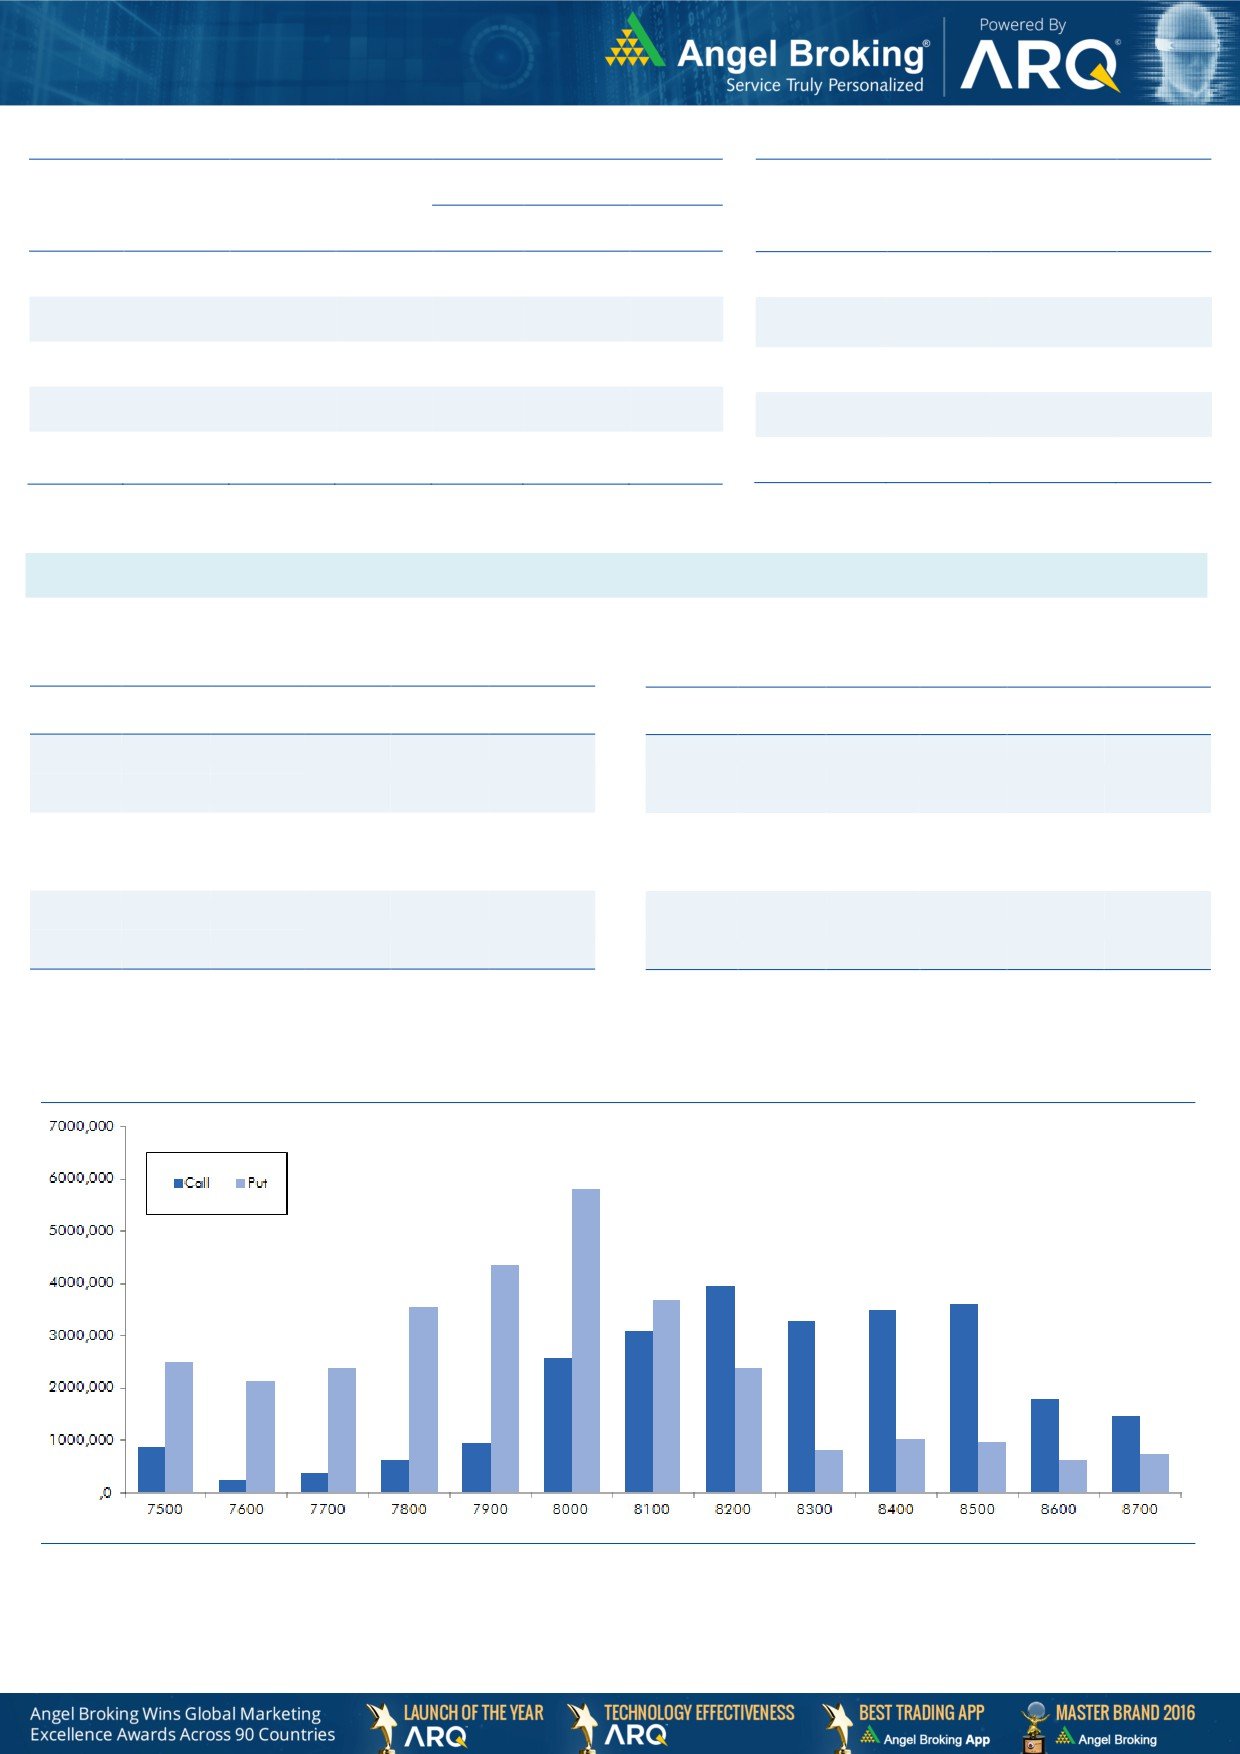
On Index Options front, FIIs bought worth Rs. 1658
NIITTECH
538500
10.80
429.10
0.76
crores with rise in OI. In call options, we hardly saw any
MARUTI
2289300
10.58
5478.95
2.84
relevant activity. On the other hand, in put options, out-
BANKBARODA
37898000
9.93
149.50
-2.42
the-money strike 7500 added some build-up. Maximum
JETAIRWAYS
6020000
9.69
364.10
4.76
OI in January series is placed at 8200 call and 8000 put
CEATLTD
1339800
9.62
1184.45
1.74
options.
Yesterday, the overall market was quite volatile due to
OI Losers
which IV’s jumped higher. FIIs continued their selling
OI
PRICE
streak in equities and they also unwounded some of their
SCRIP
OI
PRICE
CHG. (%)
CHG. (%)
longs in Index Futures. We observed that in yesterday’s
BAJAJ-AUTO
1316500
-4.24
2601.75
-1.44
trading session, stock specific buildup in large cap stocks
JISLJALEQS
37422000
-2.58
89.10
0.68
was on the higher side than that of Nifty. Counters like
IDBI
27648000
-1.96
69.30
-0.43
SBIN, HDFC, MARUTI, BANKBARODA and INDUSINDBK
JUBLFOOD
2181500
-1.89
851.70
1.20
added huge open interest. At current juncture, traders
COALINDIA
9705300
-1.82
297.55
0.63
should look for more of stock specific trades rather than
ULTRACEMCO
2542200
-1.74
3351.45
3.69
forming aggressive positions in Index.
ABIRLANUVO
3558400
-1.60
1295.60
0.82
MARICO
8091200
-1.36
255.10
-2.05
Historical Volatility
Put-Call Ratio
SCRIP
HV
SCRIP
PCR-OI
PCR-VOL
LICHSGFIN
43.57
NIFTY
1.06
0.93
HDFC
30.57
BANKNIFTY
0.91
0.89
M&M
32.24
SBIN
0.48
0.48
AMBUJACEM
36.81
INFY
0.80
0.58
IBULHSGFIN
40.83
SUNPHARMA
0.68
0.37
Technical & Derivatives Report
January 03, 2017
FII Statistics for January 02, 2017
Turnover on January 02, 2017
Open Interest
No. of
Turnover
Change
Detail
Buy
Sell
Net
Instrument
Value
Change
Contracts
( in Cr. )
(%)
Contracts
(in Cr.)
(%)
INDEX
INDEX
684.29
1145.51
(461.22)
162524
10234.60
(0.92)
209335
13846.53
12.13
FUTURES
FUTURES
INDEX
INDEX
28283.09
26625.18
1657.91
784462
48780.61
3.82
3089327
210569.88
37.80
OPTIONS
OPTIONS
STOCK
4331.34
4498.83
(167.48)
849750
51615.67
1.24
STOCK
FUTURES
450946
28814.66
8.31
FUTURES
STOCK
STOCK
2674.96
2652.24
22.72
26152
1619.99
30.32
226332
15165.06
16.25
OPTIONS
OPTIONS
TOTAL
35973.69
34921.77
1051.92
1822888
112250.86
2.46
TOTAL
3975940
268396.13
31.05
Nifty Spot = 8179.50
Lot Size = 75
Bull-Call Spreads
Bear-Put Spreads
Action
Strike
Price
Risk
Reward
BEP
Action
Strike
Price
Risk
Reward
BEP
Buy
8200
110.05
Buy
8100
82.45
46.20
53.80
8246.20
25.30
74.70
8074.70
Sell
8300
63.85
Sell
8000
57.15
Buy
8200
110.05
Buy
8100
82.45
77.40
122.60
8277.40
43.45
156.55
8056.55
Sell
8400
32.65
Sell
7900
39.00
Buy
8300
63.85
Buy
8000
57.15
31.20
68.80
8331.20
18.15
81.85
7981.85
Sell
8400
32.65
Sell
7900
39.00
Note: Above mentioned Bullish or Bearish Spreads in Nifty (January Series) are given as an information and not as a recommendation.
Nifty Put-Call Analysis
Technical & Derivatives Report
January 03, 2017
Daily Pivot Levels for Nifty Constituents
Scrips
S2
S1
PIVOT
R1
R2
ACC
1,331
1,341
1,349
1,360
1,368
ADANIPORTS
263
268
273
278
282
AMBUJACEM
207
211
213
217
219
ASIANPAINT
873
889
898
914
923
AUROPHARMA
654
665
672
683
690
AXISBANK
436
442
447
453
458
BAJAJ-AUTO
2,499
2,549
2,602
2,651
2,704
BANKBARODA
143
146
150
153
157
BHEL
120
121
122
124
125
BPCL
634
637
641
644
648
BHARTIARTL
300
305
309
314
318
INFRATEL
340
342
344
347
349
BOSCH
20,629
20,862
21,074
21,307
21,519
CIPLA
558
562
567
571
576
COALINDIA
294
297
300
303
306
DRREDDY
3,038
3,061
3,089
3,112
3,140
EICHERMOT
22,011
22,267
22,558
22,814
23,105
GAIL
429
432
437
440
445
GRASIM
854
864
870
880
886
HCLTECH
817
823
828
834
840
HDFCBANK
1,182
1,189
1,200
1,207
1,218
HDFC
1,176
1,197
1,234
1,255
1,293
HEROMOTOCO
2,954
2,992
3,031
3,069
3,107
HINDALCO
152
155
158
161
163
HINDUNILVR
815
820
824
829
833
ICICIBANK
244
248
252
256
260
IDEA
72
74
75
76
77
INDUSINDBK
1,063
1,075
1,095
1,107
1,127
INFY
991
996
1,004
1,010
1,018
ITC
237
239
241
243
244
KOTAKBANK
702
708
715
721
727
LT
1,339
1,350
1,359
1,369
1,379
LUPIN
1,464
1,485
1,497
1,518
1,531
M&M
1,148
1,189
1,211
1,252
1,274
MARUTI
5,196
5,331
5,403
5,538
5,609
NTPC
163
164
165
167
168
ONGC
191
191
192
193
194
POWERGRID
181
182
184
185
186
RELIANCE
1,065
1,075
1,082
1,093
1,100
SBIN
236
240
247
251
258
SUNPHARMA
620
627
634
641
647
TCS
2,340
2,351
2,363
2,374
2,386
TATAMTRDVR
293
301
305
313
317
TATAMOTORS
462
475
482
494
501
TATAPOWER
75
75
76
76
77
TATASTEEL
382
394
401
414
421
TECHM
480
484
490
494
501
ULTRACEMCO
3,271
3,321
3,350
3,400
3,429
WIPRO
466
469
473
476
481
YESBANK
1,115
1,130
1,146
1,161
1,177
ZEEL
445
449
453
457
461
Technical & Derivatives Report
January 03, 2017
Research Team Tel: 022 - 39357800
For Technical Queries
For Derivatives Queries
DISCLAIMER
Angel Broking Private Limited (hereinafter referred to as “Angel”) is a registered Member of National Stock Exchange of India Limited,
Bombay Stock Exchange Limited and Metropolitan Stock Exchange Limited. It is also registered as a Depository Participant with CDSL
and Portfolio Manager with SEBI. It also has registration with AMFI as a Mutual Fund Distributor. Angel Broking Private Limited is a
registered entity with SEBI for Research Analyst in terms of SEBI (Research Analyst) Regulations, 2014 vide registration number
INH000000164. Angel or its associates has not been debarred/ suspended by SEBI or any other regulatory authority for accessing
/dealing in securities Market. Angel or its associates/analyst has not received any compensation / managed or co-managed public
offering of securities of the company covered by Analyst during the past twelve months.
This document is solely for the personal information of the recipient, and must not be singularly used as the basis of any investment
decision. Nothing in this document should be construed as investment or financial advice. Each recipient of this document should
make such investigations as they deem necessary to arrive at an independent evaluation of an investment in the securities of the
companies referred to in this document (including the merits and risks involved), and should consult their own advisors to determine
the merits and risks of such an investment.
Reports based on technical and derivative analysis center on studying charts of a stock's price movement, outstanding positions and
trading volume, as opposed to focusing on a company's fundamentals and, as such, may not match with a report on a company's
fundamentals. Investors are advised to refer the Fundamental and Technical Research Reports available on our website to evaluate the
contrary view, if any.
The information in this document has been printed on the basis of publicly available information, internal data and other reliable
sources believed to be true, but we do not represent that it is accurate or complete and it should not be relied on as such, as this
document is for general guidance only. Angel Broking Pvt. Limited or any of its affiliates/ group companies shall not be in any way
responsible for any loss or damage that may arise to any person from any inadvertent error in the information contained in this report.
Angel Broking Pvt. Limited has not independently verified all the information contained within this document. Accordingly, we cannot
testify, nor make any representation or warranty, express or implied, to the accuracy, contents or data contained within this document.
While Angel Broking Pvt. Limited endeavors to update on a reasonable basis the information discussed in this material, there may be
regulatory, compliance, or other reasons that prevent us from doing so.
This document is being supplied to you solely for your information, and its contents, information or data may not be reproduced,
redistributed or passed on, directly or indirectly.
Neither Angel Broking Pvt. Limited, nor its directors, employees or affiliates shall be liable for any loss or damage that may arise from
or in connection with the use of this information.