Technical & Derivatives Report
August 31, 2016
Sensex (28343) / Nifty (8744)
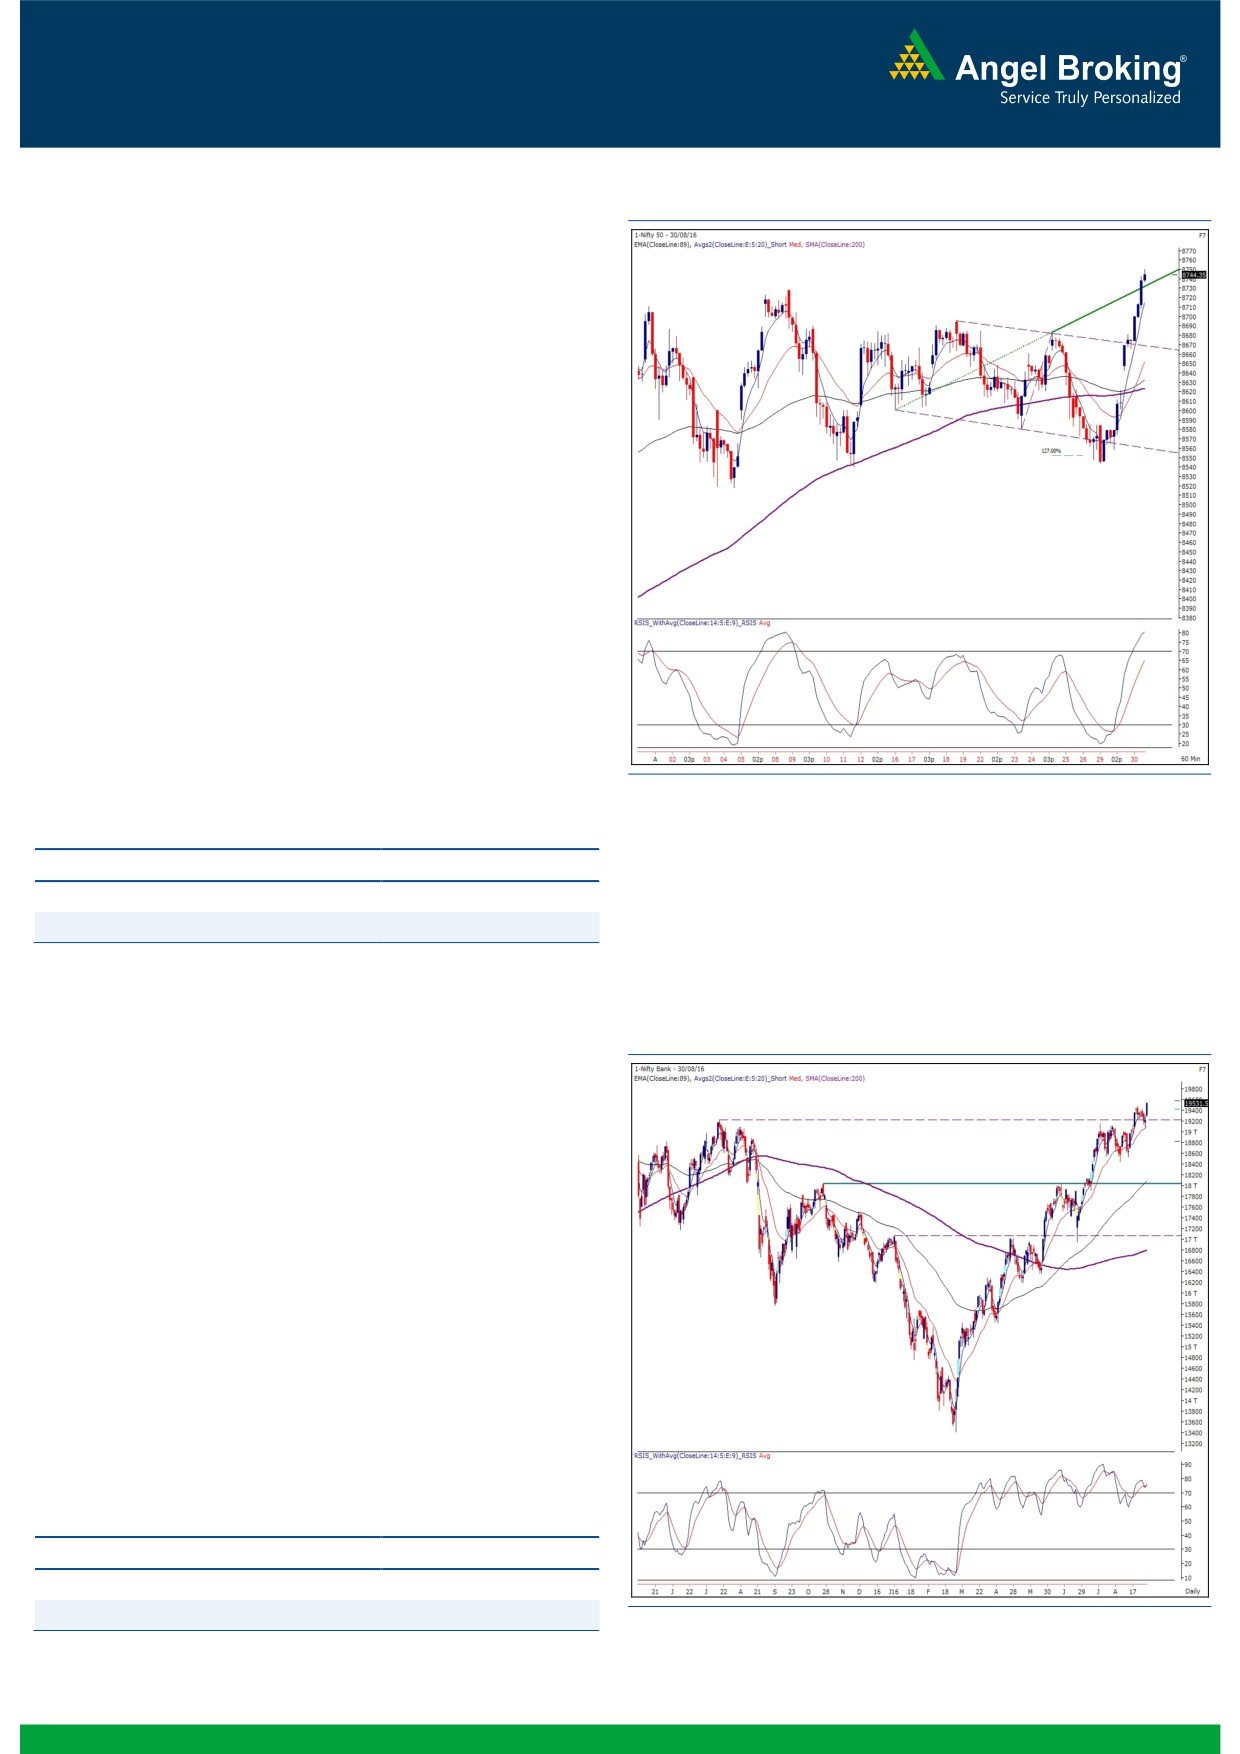
Exhibit 1: Nifty Hourly Chart
Finally, after a (time-wise) pain of nearly a month, the bulls had
something to cheer for. The Nifty opened higher mirroring
positive development across the globe which was followed by a
strong intraday rally to register a new 52-week high. With
reference to our previous reports, we are not so surprised with this
up move; but, the velocity at which it happened is certainly
remarkable.
The Nifty has now slightly surpassed our mentioned targets of
(Bullish Wolfe Wave) 8680 - 8710; but, the momentum is still
quite strong and considering the chart structure of heavyweight
constituents, we expect this rally to extend a bit. We would now
stick to our previously mentioned targets of 8800 - 8850 for the
index. In case of Nifty testing these upside levels; we would advise
traders to keep booking profits in the index and wait for further
developments to happen on charts. Meanwhile, individual stocks
can offer good trading opportunities and thus, traders should
keep following stock specific approach with proper exit strategy.
For the coming session,
8696
-
8683 would be seen as
immediate support levels.
Key Levels
Support 1 - 8696
Resistance 1 - 8800
Support 2 - 8683
Resistance 2 - 8850
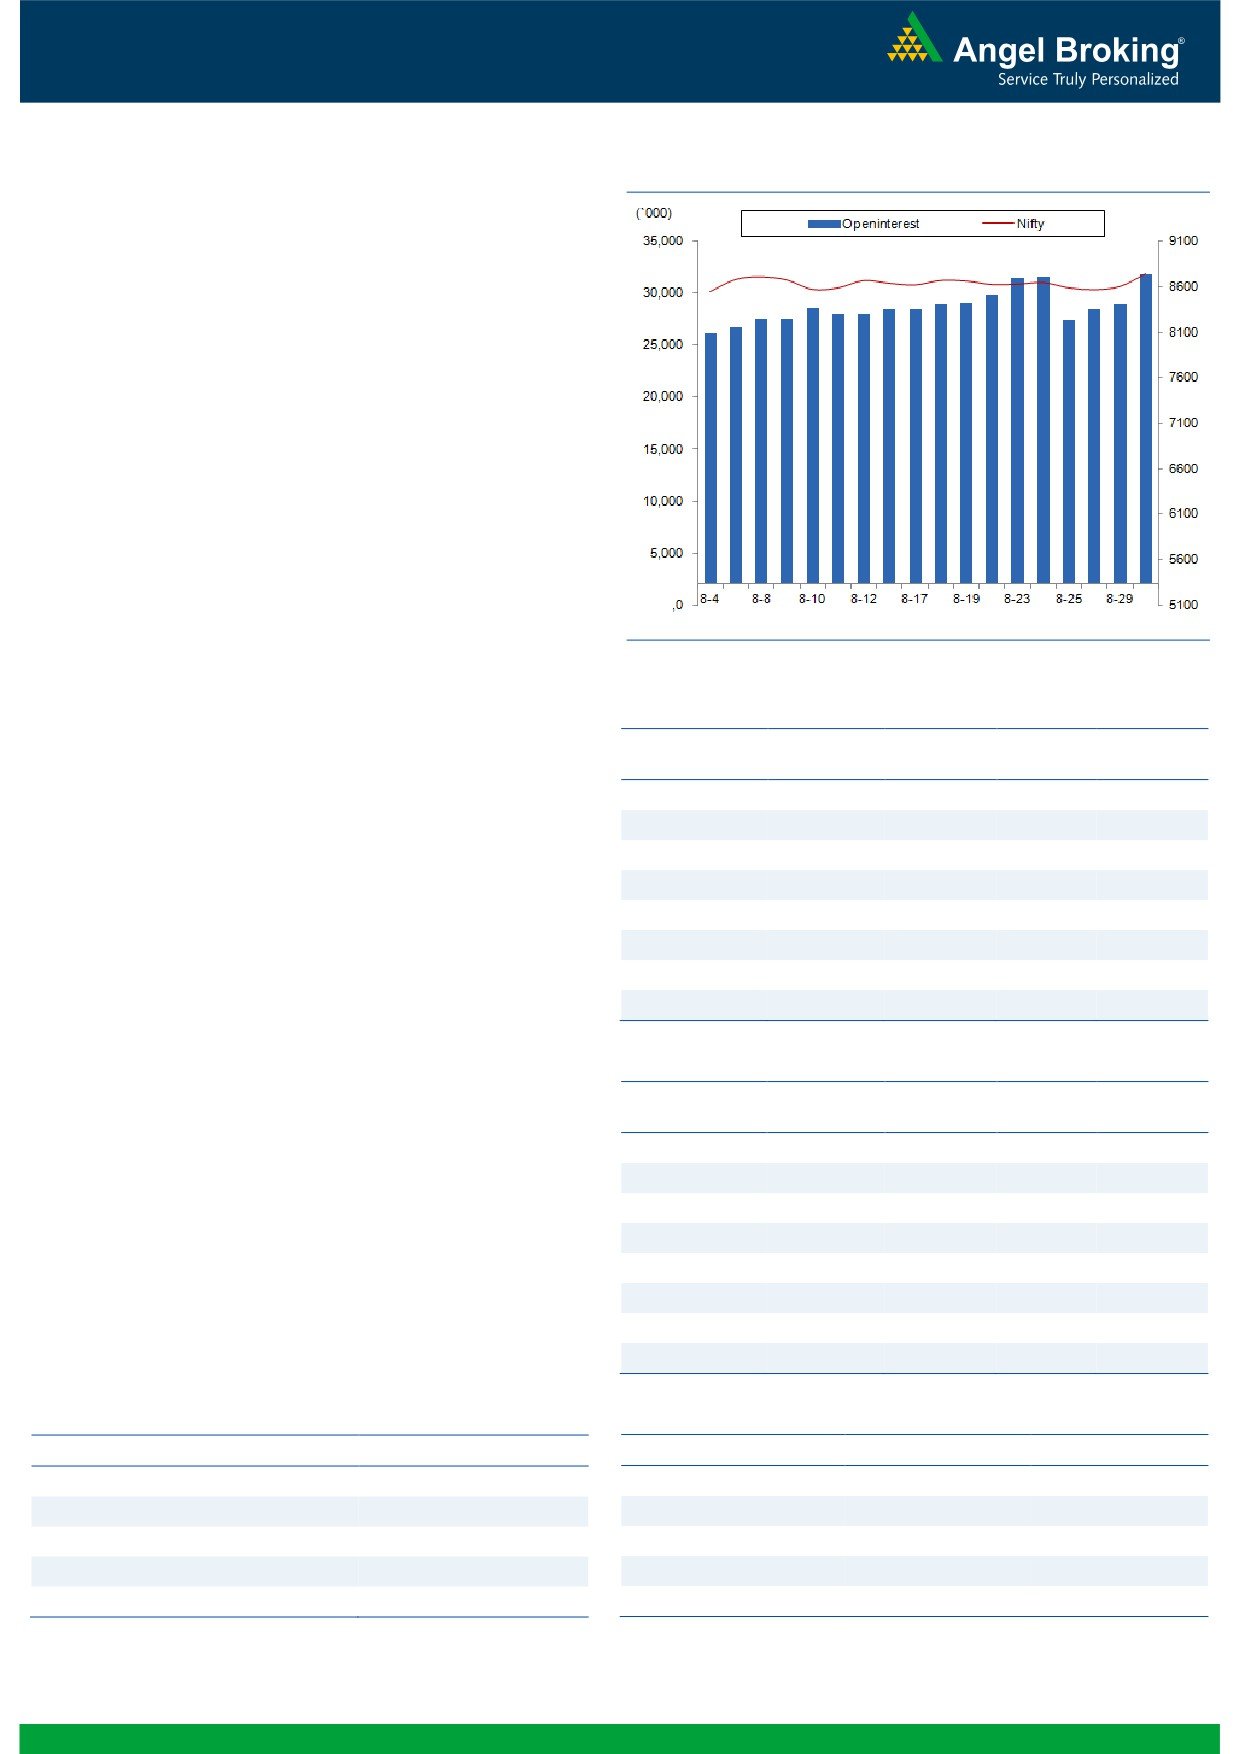
Nifty Bank Outlook - (19532)
Exhibit 2: Nifty Bank Daily Chart
In yesterday's trading session, the Nifty Bank index opened gap
up and continued the positive momentum throughout the session
to end the day with gains of 1.64 percent.
In continuation with the pullback move seen on Monday from the
lower end of the range, the Nifty Bank index continued the
positive momentum post gap up opening. The broad participation
of the individual Private sector as well as the PSU sector banking
stocks is a sign of continuation of the uptrend. Considering the
positive momentum in the heavyweights, the ongoing rally could
continue and the index could move higher upto 19900 - 20000.
Hence, traders are advised to continue to trade with positive bias.
The intraday support for the Nifty Bank index are placed around
19420 and 19360 whereas resistances are seen around 19597
and 19733.
Key Levels
Support 1 - 19420
Resistance 1 - 19597
Support 2 - 19360
Resistance 2 - 19733
1
Technical & Derivatives Report
August 31, 2016
Comments
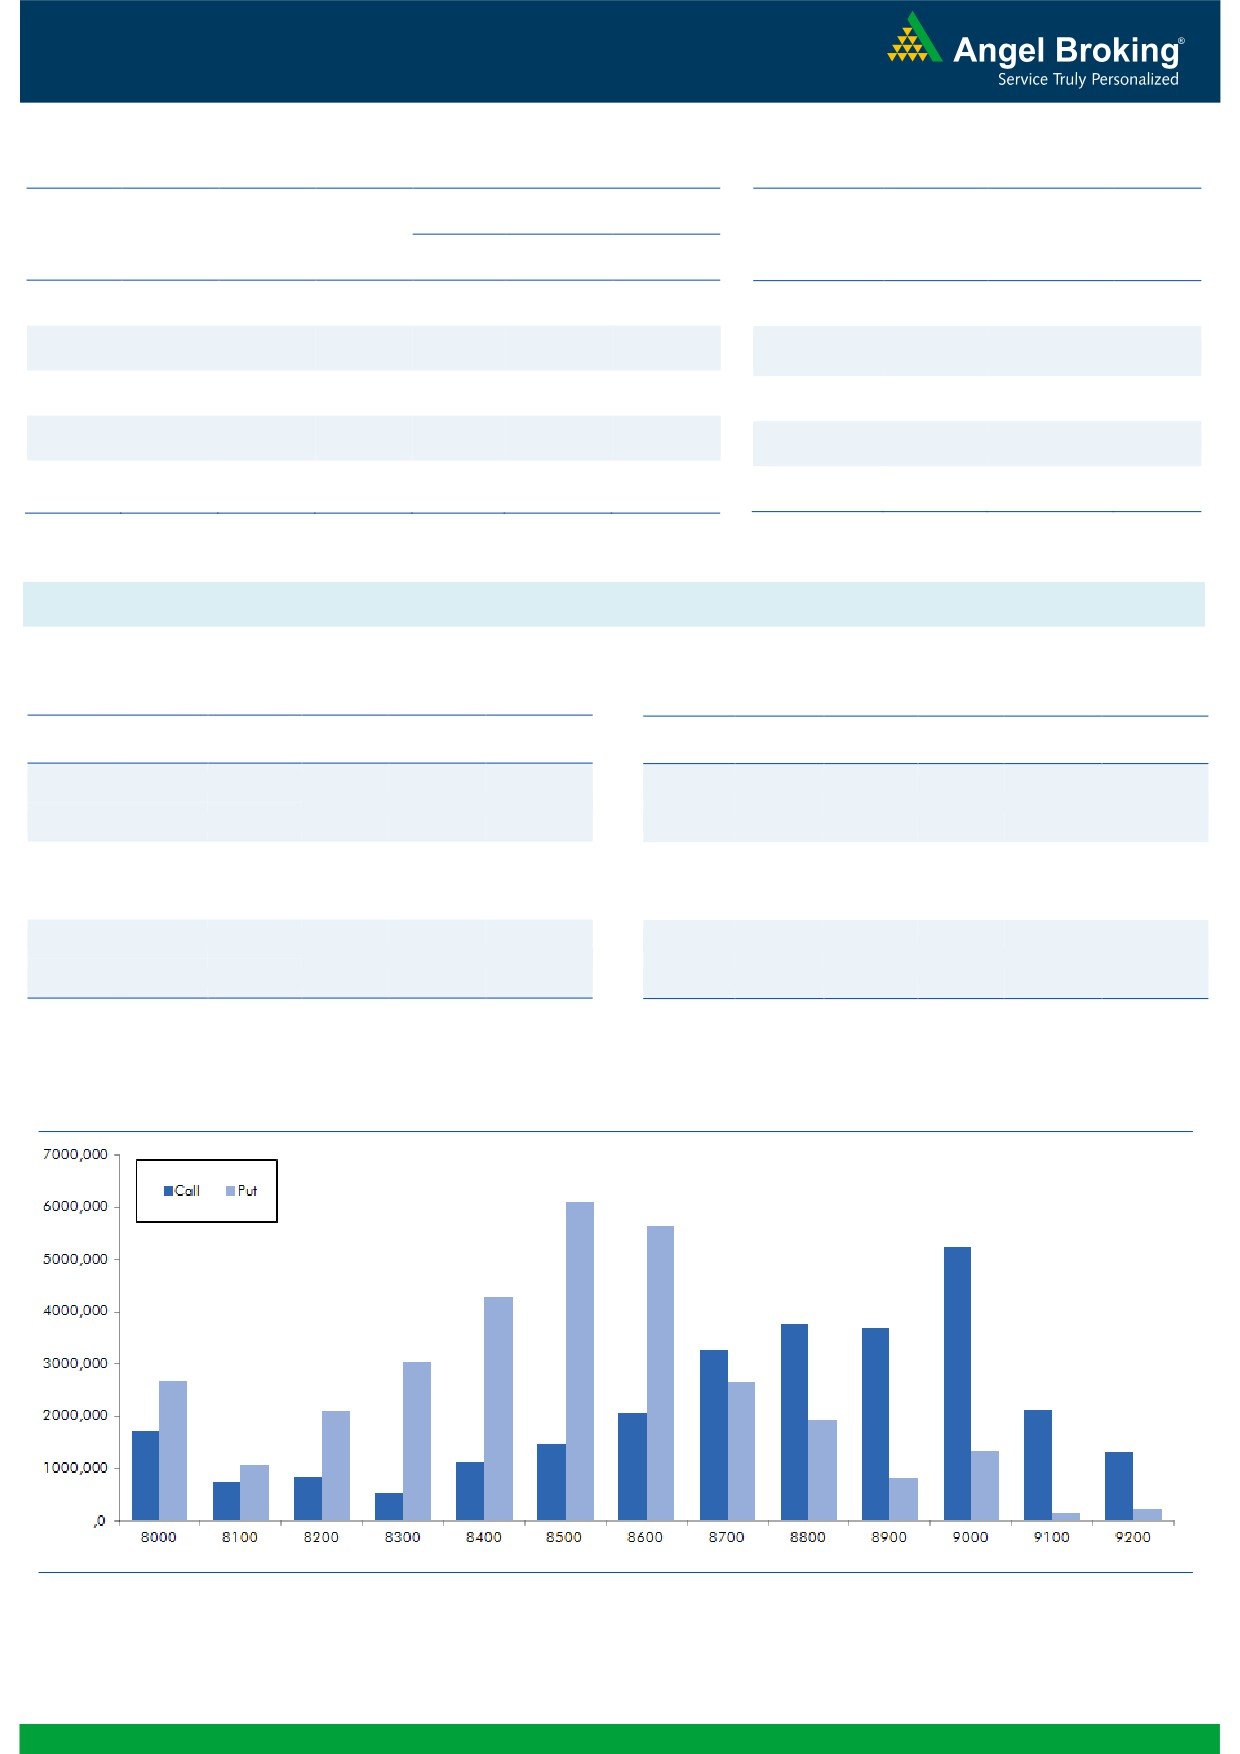
Nifty Vs OI
The Nifty futures open interest has increased by 10.00%
BankNifty futures open interest has increased by 18.42%
as market closed at 8744.35 levels.
The Nifty September future closed with a premium of
50.25 points against a premium of 42.30 points in
previous session. The October series closed at a
premium of 88.90 points.
The Implied Volatility of at the money options has
decreased from 11.78% to 11.48%. At the same time,
the PCR-OI of Nifty has increased from 1.05 to 1.06.
The total OI of the market is Rs. 2,57,650/- cr. and the
stock futures OI is Rs. 79,515/- cr.
Few of the liquid counters where we have seen high cost
of carry are JPASSOCIAT, GMRINFRA, RCOM,
ADANIPOWER and ADANIENT.
Views
OI Gainers
OI
PRICE
FIIs were net buyers in both equity cash and index futures
SCRIP
OI
PRICE
CHG. (%)
CHG. (%)
segment. They bought equities worth Rs. 390 crores.
ALBK
14670000
33.73
84.70
6.81
While, they were net buyers to the tune of Rs. 2066
TVSMOTOR
5398000
20.44
328.45
4.59
crores in Index Futures with rise in OI, indicating huge
EICHERMOT
166800
13.39
23190.80
3.58
fresh long formation in last trading session.w.angelbroking.com
AJANTPHARM
370800
12.91
1946.70
-0.30
On Index Options front, FIIs were net buyers of Rs. 1311
INDUSINDBK
5322600
12.11
1168.35
0.55
crores with significant rise in OI. In call options, 8900-
ANDHRABANK
16050000
11.85
61.30
4.79
9100 strikes were active and added good amount of
JINDALSTEL
56619000
11.33
88.50
2.85
fresh positions. While in put options, 8600-8800 strikes
AMBUJACEM
9790000
10.78
276.40
3.95
added significant build-up. Highest OI in September
series is visible in 9000 call and 8500 put options.
From start of September series, we are witnessing
OI Losers
OI
PRICE
meaningful long addition in Index Futures. In fact,
SCRIP
OI
PRICE
CHG. (%)
CHG. (%)
yesterday we saw fresh long formation in out of the
IGL
1628000
-8.70
772.50
1.02
money strike 8900 and 9000 call options. We believe,
IOC
11598000
-4.50
567.60
0.14
these are long positions formed by FIIs.
M&MFIN
12642500
-3.71
354.00
1.32
Looking at the above data, traders are suggested to hold
AMARAJABAT
498000
-3.71
927.45
0.03
on to their longs as we may see Nifty breaching its
VEDL
33264000
-2.87
176.25
1.00
immediate resistance of 8800-8850 any time soon.
PAGEIND
38200
-2.80
14957.75
1.64
HDIL
27984000
-2.64
93.85
2.01
MRF
64935
-2.50
37808.60
0.13
Historical Volatility
Put-Call Ratio
SCRIP
HV
SCRIP
PCR-OI
PCR-VOL
ORIENTBANK
54.63
NIFTY
1.06
1.04
HDFCBANK
18.45
BANKNIFTY
1.31
1.05
SYNDIBANK
42.27
RELIANCE
0.63
0.49
TVSMOTOR
35.41
SBIN
0.76
0.52
ALBK
52.94
TATAMOTORS
1.12
0.79
2
Technical & Derivatives Report
August 31, 2016
FII Statistics for 30-August 2016
Turnover on 30-August 2016
Open Interest
No. of
Turnover
Change
Detail
Buy
Sell
Net
Instrument
Value
Contracts
( in Cr. )
(%)
Contracts
Change (%)
(in Cr.)
INDEX
INDEX
4246.90
2180.54
2066.36
396412
26597.80
10.88
269361
18715.23
23.60
FUTURES
FUTURES
INDEX
INDEX
37136.50
35825.19
1311.31
929264
61800.46
5.08
3442965
243742.97
49.56
OPTIONS
OPTIONS
STOCK
5909.33
6363.65
(454.32)
838191
55913.87
1.74
STOCK
FUTURES
569619
40791.22
22.37
FUTURES
STOCK
STOCK
3428.83
3469.54
(40.71)
58398
3978.18
22.64
OPTIONS
263566
19048.73
7.34
OPTIONS
TOTAL
50721.56
47838.92
2882.64
2222265
148290.31
5.16
TOTAL
4545511
322298.16
40.63
Nifty Spot = 8744.35
Lot Size = 75
Bull-Call Spreads
Bear-Put Spreads
Action
Strike
Price
Risk
Reward
BEP
Action
Strike
Price
Risk
Reward
BEP
Buy
8800
109.75
Buy
8700
79.90
44.30
55.70
8844.30
26.30
73.70
8673.70
Sell
8900
65.45
Sell
8600
53.60
Buy
8800
109.75
Buy
8700
79.90
74.00
126.00
8874.00
44.00
156.00
8656.00
Sell
9000
35.75
Sell
8500
35.90
Buy
8900
65.45
Buy
8600
53.60
29.70
70.30
8929.70
17.70
82.30
8582.30
Sell
9000
35.75
Sell
8500
35.90
Note: Above mentioned Bullish or Bearish Spreads in Nifty (September Series) are given as an information and not as a recommendation.
Nifty Put-Call Analysis
3
Technical & Derivatives Report
August 31, 2016
Daily Pivot Levels for Nifty Constituents
Scrips
S2
S1
PIVOT
R1
R2
ACC
1,620
1,654
1,675
1,709
1,730
ADANIPORTS
258
260
263
266
268
AMBUJACEM
259
267
273
281
286
ASIANPAINT
1,097
1,121
1,135
1,159
1,173
AUROPHARMA
783
791
796
804
810
AXISBANK
582
587
593
597
604
BAJAJ-AUTO
2,849
2,914
2,962
3,027
3,075
BANKBARODA
159
162
163
166
167
BHEL
138
139
141
142
144
BPCL
597
603
607
613
617
BHARTIARTL
320
326
335
341
350
INFRATEL
332
339
343
349
353
BOSCH
23,401
24,068
24,436
25,103
25,471
CIPLA
561
569
575
582
589
COALINDIA
331
333
334
336
338
DRREDDY
3,018
3,055
3,077
3,114
3,136
EICHERMOT
21,860
22,451
22,768
23,359
23,676
GAIL
375
381
385
391
395
GRASIM
4,451
4,567
4,651
4,767
4,851
HCLTECH
746
760
768
782
790
HDFCBANK
1,234
1,252
1,261
1,278
1,288
HDFC
1,366
1,379
1,387
1,400
1,407
HEROMOTOCO
3,395
3,436
3,461
3,502
3,526
HINDALCO
157
160
162
164
166
HINDUNILVR
901
913
920
932
938
ICICIBANK
250
253
255
258
260
IDEA
92
93
94
95
96
INDUSINDBK
1,150
1,155
1,162
1,168
1,175
INFY
1,017
1,029
1,037
1,049
1,057
ITC
251
254
256
259
261
KOTAKBANK
778
782
784
789
791
LT
1,450
1,463
1,470
1,483
1,490
LUPIN
1,468
1,488
1,500
1,520
1,532
M&M
1,419
1,428
1,433
1,442
1,447
MARUTI
4,888
4,978
5,041
5,131
5,194
NTPC
158
160
161
163
164
ONGC
235
238
240
244
246
POWERGRID
178
181
182
185
186
RELIANCE
1,047
1,057
1,063
1,072
1,078
SBIN
249
250
252
254
255
SUNPHARMA
755
765
771
781
787
TCS
2,483
2,514
2,532
2,562
2,580
TATAMTRDVR
334
337
339
342
344
TATAMOTORS
521
525
528
532
535
TATAPOWER
75
76
77
78
79
TATASTEEL
373
375
377
380
382
TECHM
446
455
460
468
473
ULTRACEMCO
3,760
3,826
3,868
3,934
3,976
WIPRO
474
482
486
494
498
YESBANK
1,322
1,339
1,357
1,373
1,391
ZEEL
516
523
529
535
541
4
Technical & Derivatives Report
August 31, 2016
Research Team Tel: 022 - 39357800
For Technical Queries
For Derivatives Queries
DISCLAIMER
Angel Broking Private Limited (hereinafter referred to as “Angel”) is a registered Member of National Stock Exchange of India Limited,
Bombay Stock Exchange Limited and Metropolitan Stock Exchange Limited. It is also registered as a Depository Participant with CDSL
and Portfolio Manager with SEBI. It also has registration with AMFI as a Mutual Fund Distributor. Angel Broking Private Limited is a
registered entity with SEBI for Research Analyst in terms of SEBI (Research Analyst) Regulations, 2014 vide registration number
INH000000164. Angel or its associates has not been debarred/ suspended by SEBI or any other regulatory authority for accessing
/dealing in securities Market. Angel or its associates/analyst has not received any compensation / managed or co-managed public
offering of securities of the company covered by Analyst during the past twelve months.
This document is solely for the personal information of the recipient, and must not be singularly used as the basis of any investment
decision. Nothing in this document should be construed as investment or financial advice. Each recipient of this document should
make such investigations as they deem necessary to arrive at an independent evaluation of an investment in the securities of the
companies referred to in this document (including the merits and risks involved), and should consult their own advisors to determine
the merits and risks of such an investment.
Reports based on technical and derivative analysis center on studying charts of a stock's price movement, outstanding positions and
trading volume, as opposed to focusing on a company's fundamentals and, as such, may not match with a report on a company's
fundamentals. Investors are advised to refer the Fundamental and Technical Research Reports available on our website to evaluate the
contrary view, if any.
The information in this document has been printed on the basis of publicly available information, internal data and other reliable
sources believed to be true, but we do not represent that it is accurate or complete and it should not be relied on as such, as this
document is for general guidance only. Angel Broking Pvt. Limited or any of its affiliates/ group companies shall not be in any way
responsible for any loss or damage that may arise to any person from any inadvertent error in the information contained in this report.
Angel Broking Pvt. Limited has not independently verified all the information contained within this document. Accordingly, we cannot
testify, nor make any representation or warranty, express or implied, to the accuracy, contents or data contained within this document.
While Angel Broking Pvt. Limited endeavors to update on a reasonable basis the information discussed in this material, there may be
regulatory, compliance, or other reasons that prevent us from doing so.
This document is being supplied to you solely for your information, and its contents, information or data may not be reproduced,
redistributed or passed on, directly or indirectly.
Neither Angel Broking Pvt. Limited, nor its directors, employees or affiliates shall be liable for any loss or damage that may arise from
or in connection with the use of this information.
5