Technical & Derivatives Report
March 31, 2016
Sensex (25339) / Nifty (7735)
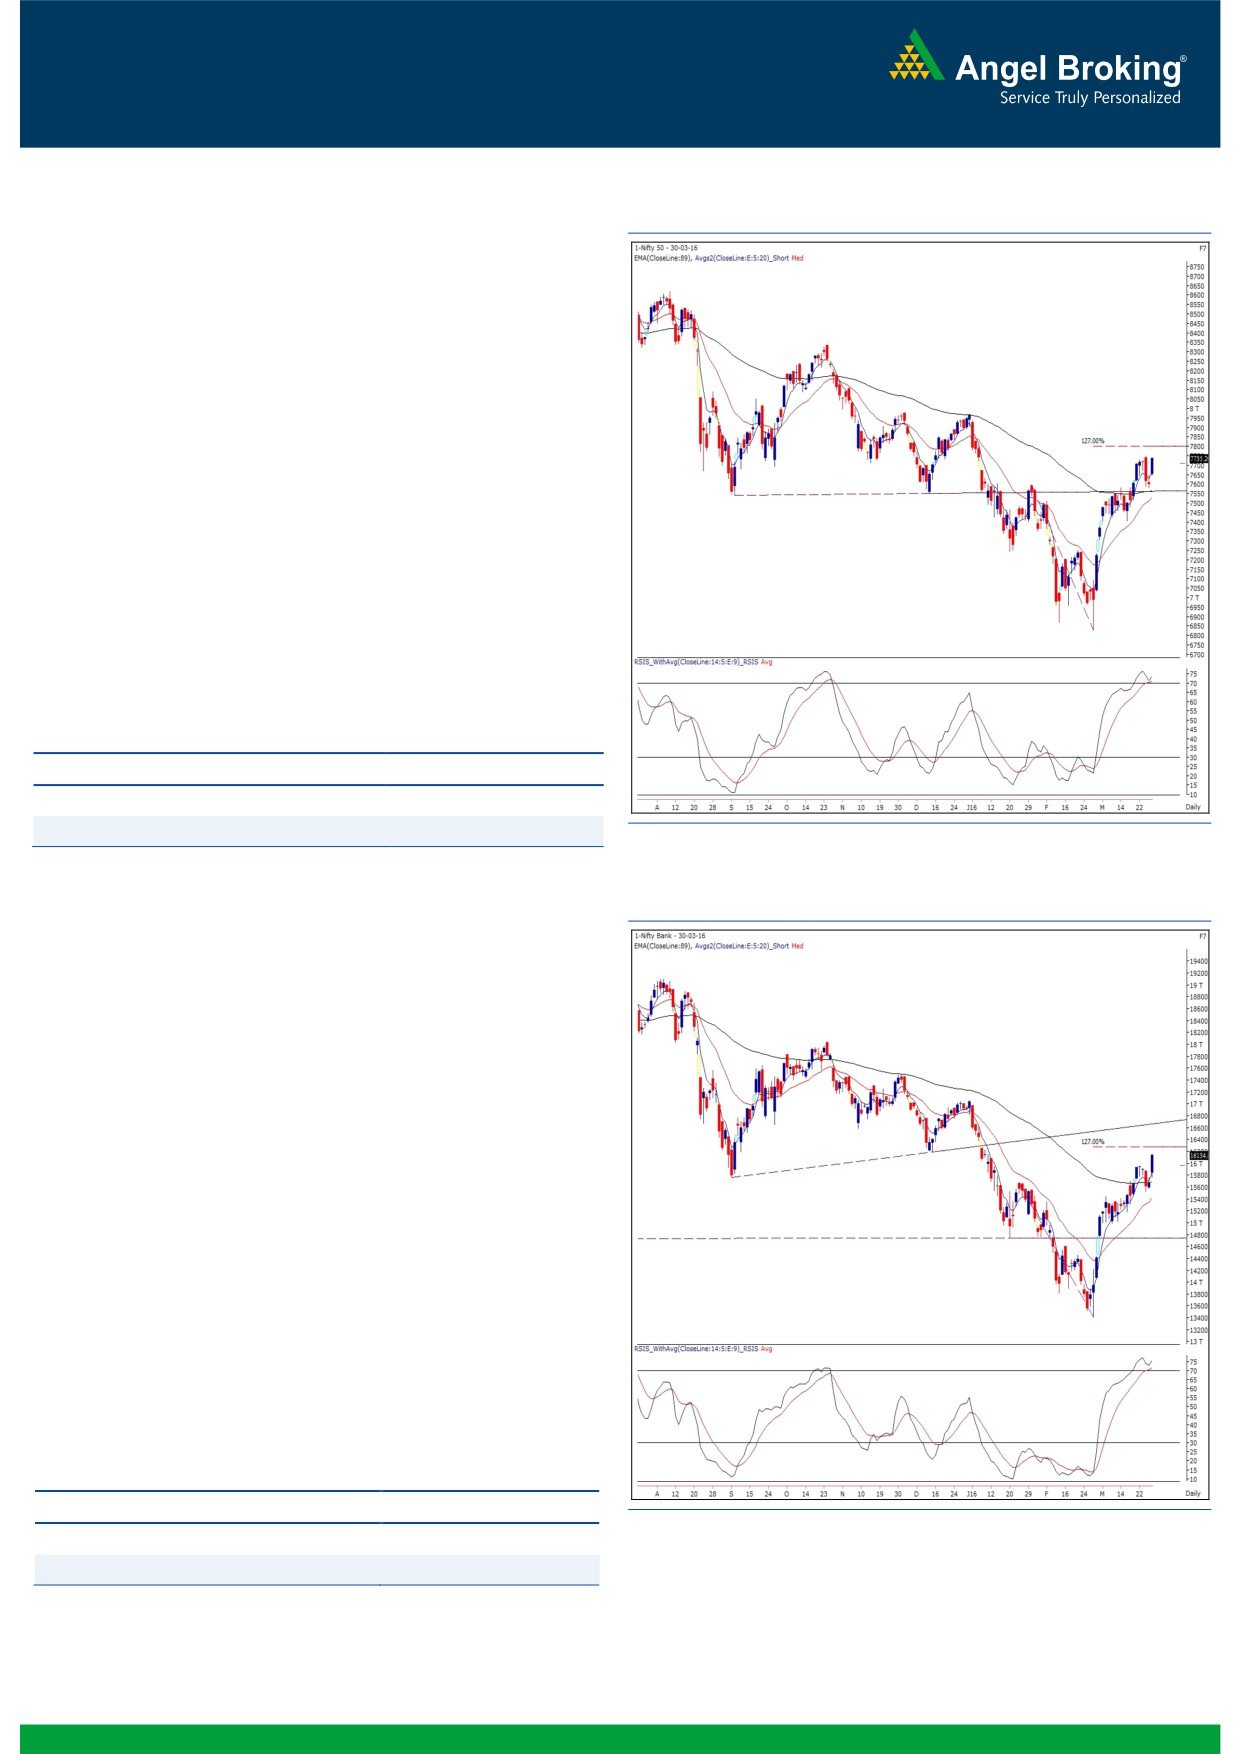
Exhibit 1: Nifty Daily Chart
Yesterday, our benchmark index opened on a cheerful note
owing to strong global cues post the Federal Reserve Chair
Person Janet Yellen called for caution on raising interest rates.
Our market participants too participated heavily to lift the index
well above the opening tick.
We saw a good two percent rally during yesterday's session to
push the Nifty convincingly above the 7700 mark one day ahead
of the March series derivative expiry. Yesterday's magnitude of the
up move was slightly surprising to us but not the direction as we
have been a bit vocal on not to stay on the short side since last
couple of days. As expected, 7580 played a sheet anchor role
and eventually, yesterday's sharp rally caught many bears on the
wrong foot. Going forward, we expect this momentum to continue
towards 7760 - 7790 where traders should look to book out
some of their profits. On the downside, 7685 - 7650 is likely to
act as a strong support zone in the forthcoming session.
Key Levels
Support 1 - 7685
Resistance 1 - 7760
Support 2 - 7650
Resistance 2 -
7790
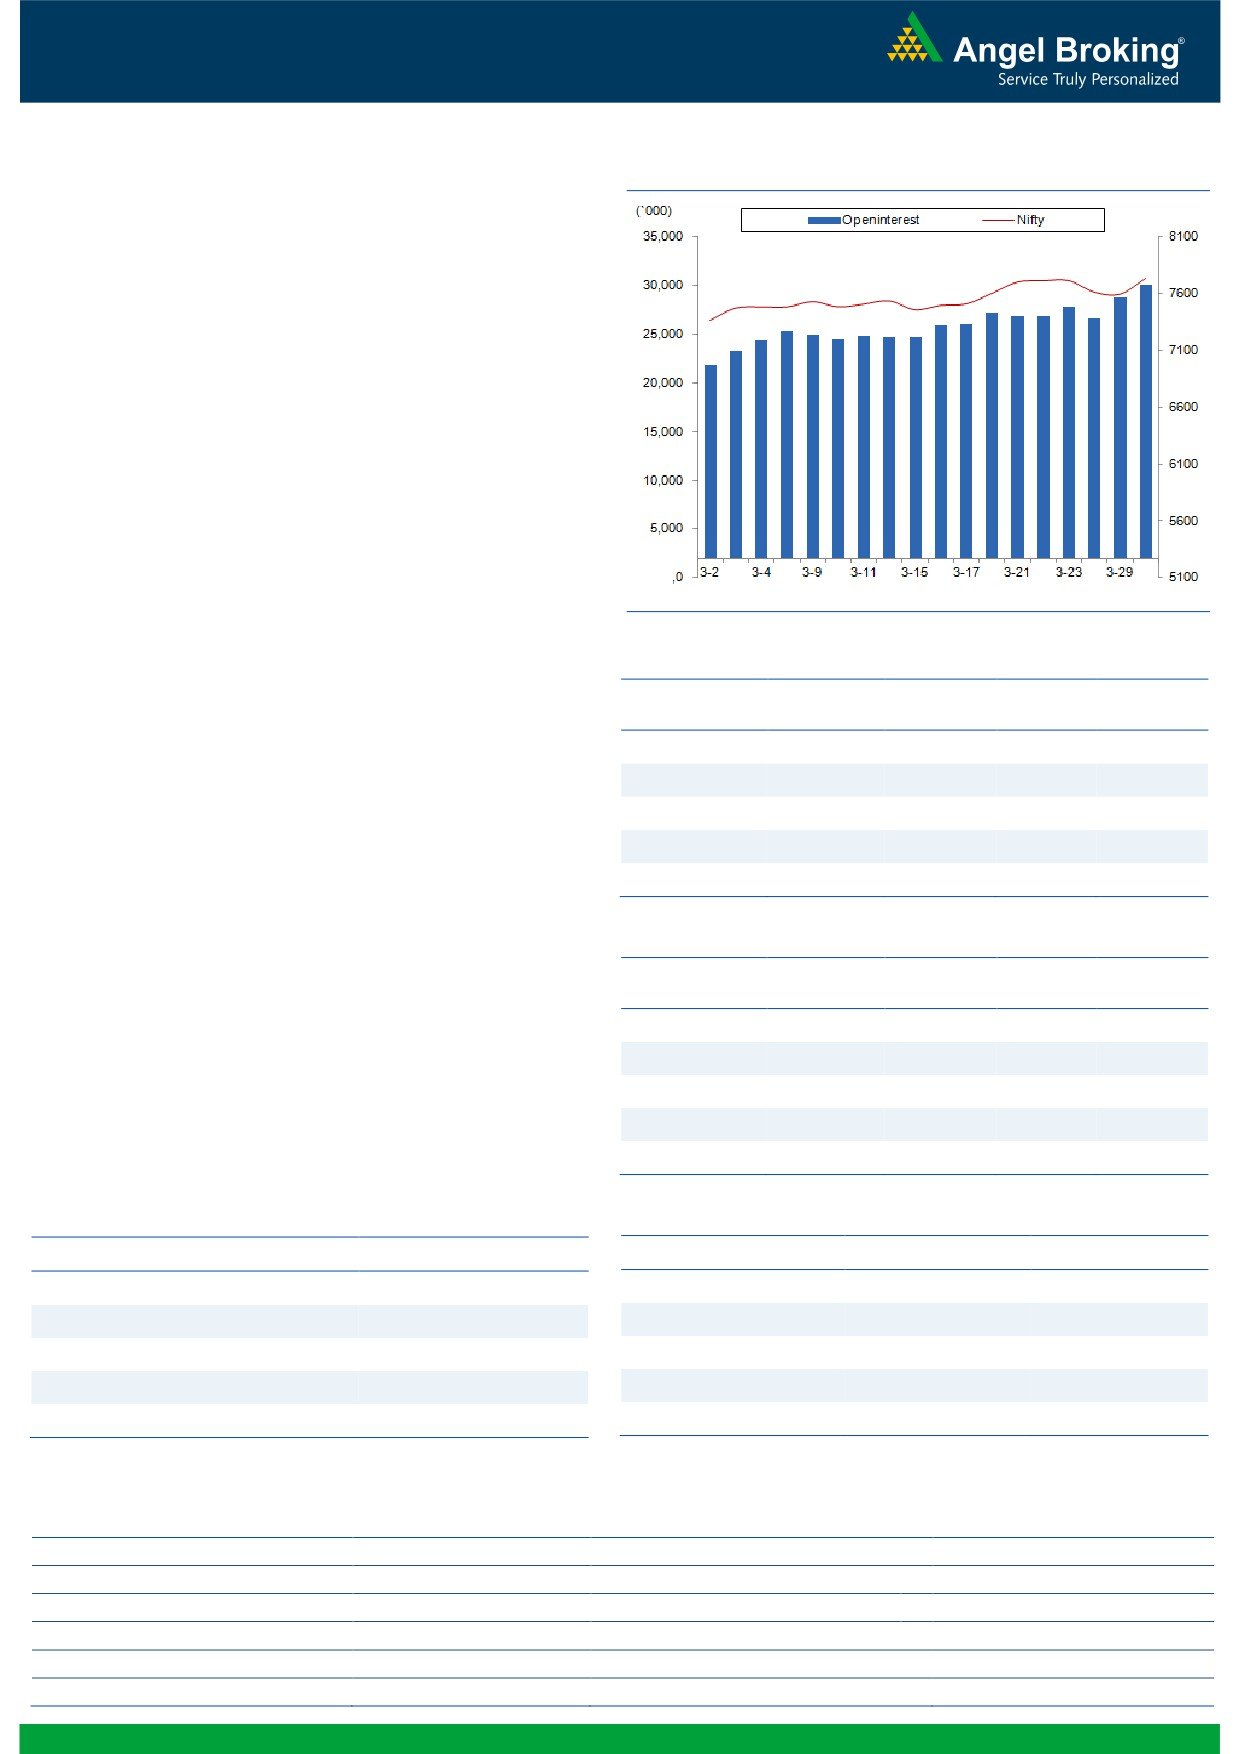
Exhibit 2: Nifty Bank Daily Chart
Nifty Bank Outlook - (16135)
In-line with the benchmark indices, the Nifty Bank index too
opened with gains of around a percent in yesterday’s session.
Post some corrective price action in the initial hour of the trade,
the banking index started rallying. The Nifty Bank index continued
to make ‘Higher Highs’ throughout the day and eventually ended
the session with huge gains of 2.99 percent over its previous
close.
Once again, the banking index had taken the lead and showed
it’s out performance in yesterday’s session. At current juncture,
the banking index is trading around the ’89 EMA’ on weekly
chart, which coincides with the 61.80% retracement levels of
previous fall from 18029.05 to 13407.25. Traders are advised to
continue to trade with positive bias in individual stocks within the
sector untill any signs of reversal seen. The intraday support for
the banking index is placed around 15965 - 15760; whereas,
resistance is seen at 16300 - 16404.
Key Levels
Support 1 - 15965
Resistance 1 - 16300
Support 2 - 15760
Resistance 2 - 16404
1
Technical & Derivatives Report
March 31, 2016
Comments
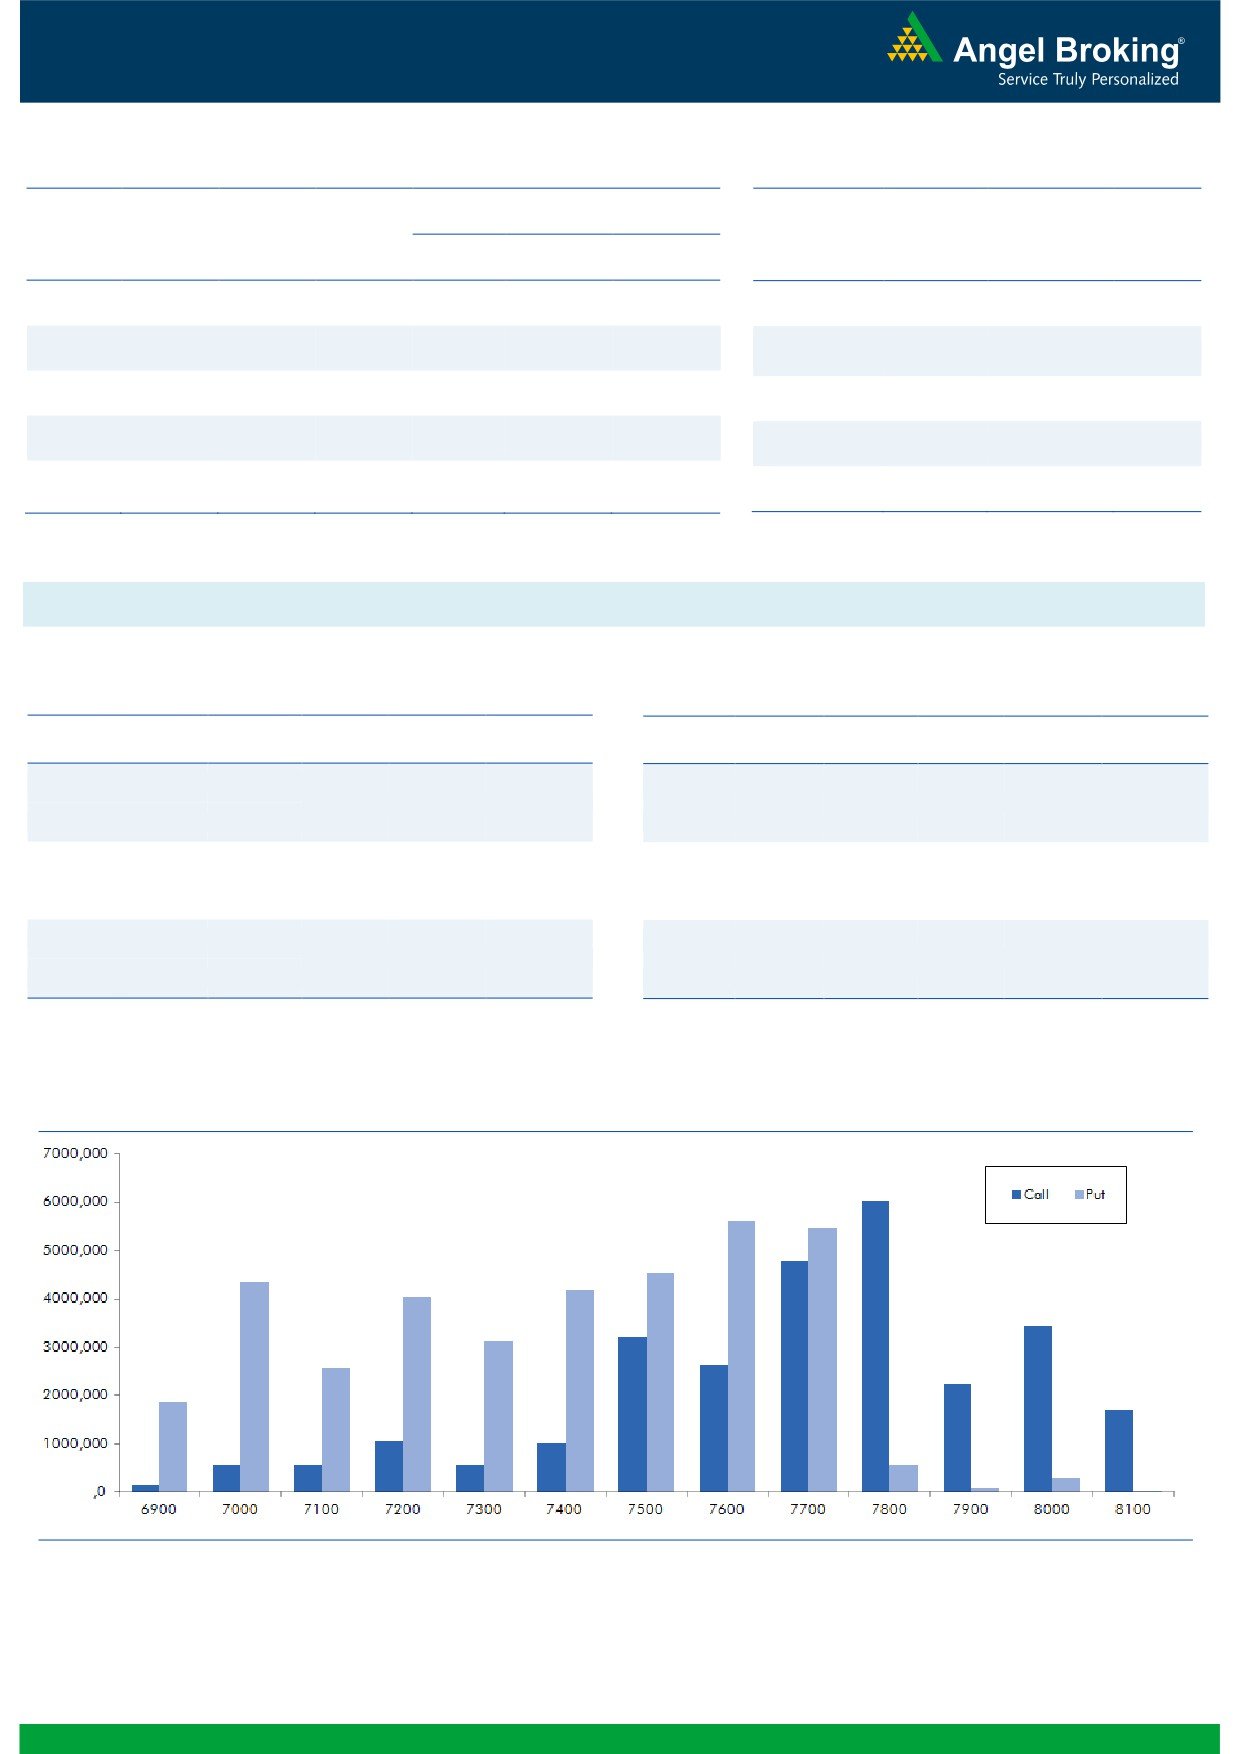
Nifty Vs OI
The Nifty futures open interest has increased by 4.61%
BankNifty futures open interest has increased by 1.06%
as market closed at 7735.20 levels.
The Nifty March future closed at a premium of 5.80
points against a premium of 23.05 points. The April
series closed at a premium of 48.15 points.
The Implied Volatility of at the money options has
decreased from 16.90% to 14.81%.
The total OI of the market is Rs. 2,62,123/- cr. and the
stock futures OI is Rs. 62,083 /- cr.
Few of the liquid counters where we have seen high cost
of carry are UNITECH, ABIRLANUVO, PETRONET, OIL
and GMRINFRA.
Views
FIIs were net buyers in both Cash market and Index
OI Gainers
Futures segment. They bought equities to the tune of Rs.
OI
PRICE
SCRIP
OI
PRICE
1442 crores. While in Index Futures, they bought of
CHG. (%)
CHG. (%)
HINDZINC
4361600
30.93
174.95
2.79
worth Rs.
395 crores with substantial rise in OI,
suggesting mix of both long and short positions in last
GODREJIND
2259400
24.68
358.75
3.10
trading session.
CUMMINSIND
210600
22.30
848.95
-0.06
FEDERALBNK
46024000
20.13
46.80
-0.64
In Index Options front, FIIs sold of worth Rs. 686 crores
ADANIPOWER
100800000
18.53
32.65
11.05
with some fall in OI. In call options, we hardly saw any
meaningful OI addition. Good amount of unwinding was
witnessed in
7600-7700 call options. While in put
OI Losers
options, 7700 strike added significant build-up, some OI
OI
PRICE
SCRIP
OI
PRICE
addition was also 7650 and 7750 put options. We
CHG. (%)
CHG. (%)
IOB
12404000
-25.48
29.30
7.13
believe it’s more of writing which took place in these put
option, suggesting expiry near 7700 mark. Maximum OI
HDIL
22368000
-20.36
70.55
4.83
in current series is visible in 7800 call and 7600 put
TITAN
6409500
-14.45
338.35
2.24
options. Rollover in Nifty & BankNifty is on the higher
SYNDIBANK
7930000
-11.99
66.15
3.44
side at 51.98% and 54.00% respectively.
PCJEWELLER
1651000
-11.68
353.70
3.24
Historical Volatility
Put-Call Ratio
SCRIP
HV
SCRIP
PCR-OI
PCR-VOL
ADANIPOWER
68.70
NIFTY
1.08
0.89
ADANIENT
54.84
BANKNIFTY
1.22
0.86
MINDTREE
62.11
SBIN
0.94
0.36
ICICIBANK
54.69
LUPIN
0.56
0.63
TATASTEEL
61.05
ICICIBANK
1.29
0.68
Strategy Date
Symbol
Strategy
Status
February 29, 2016
RELIANCE
Ratio Bull Call Spread
Active
March 07, 2016
BHEL
Long Call Ladder
Profit booked on 28-03-2016
March 14, 2016
NIFTY
Ratio Bull Call Spread
Not Activated
March 21, 2016
BANKNIFTY
Long Call
Profit booked on 30-03-2016.
March 28, 2016
NIFTY
Ratio Bull Call Spread
Active
2
Technical & Derivatives Report
March 31, 2016
FII Statistics for 30-March 2016
Turnover on 30-March 2016
Open Interest
No. of
Turnover
Change
Detail
Buy
Sell
Net
Instrument
Value
Contracts
( in Cr. )
(%)
Contracts
Change (%)
(in Cr.)
INDEX
INDEX
4933.43
4538.80
394.63
431379
24534.28
12.35
465679
25254.69
-6.39
FUTURES
FUTURES
INDEX
INDEX
37457.04
38143.52
(686.48)
1519601
87029.64
(2.33)
7159328
400308.82
17.10
OPTIONS
OPTIONS
STOCK
15972.71
16537.66
(564.95)
1122000
52588.15
2.31
STOCK
FUTURES
1252076
58959.08
-7.79
FUTURES
STOCK
STOCK
2948.01
2996.40
(48.39)
97247
4577.25
(3.82)
OPTIONS
445352
21461.42
2.31
OPTIONS
TOTAL
61311.19
62216.38
(905.19)
3170227
168729.32
1.04
TOTAL
9322435
505984.00
11.51
Nifty Spot = 7735.20
Lot Size = 75
Bull-Call Spreads
Bear-Put Spreads
Action
Strike
Price
Risk
Reward
BEP
Action
Strike
Price
Risk
Reward
BEP
Buy
7700
47.35
Buy
7800
63.35
42.55
57.45
7742.55
52.50
47.50
7747.50
Sell
7800
4.80
Sell
7700
10.85
Buy
7700
47.35
Buy
7800
63.35
46.80
153.20
7746.80
61.60
138.40
7738.40
Sell
7900
0.55
Sell
7600
1.75
Buy
7800
4.80
Buy
7700
10.85
4.25
95.75
7804.25
9.10
90.90
7690.90
Sell
7900
0.55
Sell
7600
1.75
Note: Above mentioned Bullish or Bearish Spreads in Nifty (March Series) are given as an information and not as a recommendation.
Nifty Put-Call Analysis
3
Technical & Derivatives Report
March 31, 2016
Daily Pivot Levels for Nifty 50 Stocks
Scrips
S2
S1
PIVOT
R1
R2
ACC
1,362
1,374
1,383
1,395
1,404
ADANIPORTS
236
241
245
250
254
AMBUJACEM
228
229
232
234
237
ASIANPAINT
853
867
876
891
899
AXISBANK
427
436
441
449
454
BAJAJ-AUTO
2,331
2,377
2,408
2,454
2,485
BANKBARODA
138
142
146
150
153
BHARTIARTL
347
350
355
358
363
BHEL
109
112
114
117
119
BOSCHLTD
20,321
20,527
20,682
20,888
21,042
BPCL
858
880
894
915
929
CAIRN
152
154
157
159
161
CIPLA
496
504
510
518
524
COALINDIA
294
296
297
298
299
DRREDDY
2,888
2,952
2,989
3,053
3,090
GAIL
347
353
357
363
367
GRASIM
3,743
3,791
3,825
3,873
3,907
HCLTECH
799
810
816
827
833
HDFC
1,098
1,107
1,119
1,128
1,140
HDFCBANK
1,047
1,056
1,063
1,072
1,079
HEROMOTOCO
2,849
2,886
2,907
2,945
2,966
HINDALCO
83
86
88
90
92
HINDUNILVR
846
854
867
874
887
ICICIBANK
222
230
234
242
247
IDEA
105
107
109
111
113
INDUSINDBK
930
939
944
952
957
INFY
1,189
1,198
1,204
1,212
1,218
ITC
317
322
326
331
334
KOTAKBANK
658
671
679
692
700
LT
1,190
1,209
1,220
1,239
1,251
LUPIN
1,390
1,433
1,461
1,504
1,533
M&M
1,195
1,207
1,228
1,241
1,261
MARUTI
3,655
3,691
3,720
3,757
3,786
NTPC
126
128
129
131
132
ONGC
210
214
216
221
223
PNB
81
83
85
87
89
POWERGRID
137
139
139
141
141
RELIANCE
1,038
1,043
1,047
1,052
1,056
SBIN
188
193
195
200
203
VEDL
87
89
91
93
95
SUNPHARMA
795
803
809
818
824
TATAMOTORS
371
380
386
394
400
TATAPOWER
60
61
62
64
64
TATASTEEL
298
311
318
332
339
TCS
2,440
2,465
2,485
2,510
2,530
TECHM
459
466
472
479
486
ULTRACEMCO
3,132
3,158
3,191
3,217
3,250
WIPRO
547
554
559
567
571
YESBANK
840
853
862
875
883
ZEEL
369
373
378
382
388
4
Technical & Derivatives Report
March 31, 2016
Research Team Tel: 022 - 39357800
For Technical Queries
For Derivatives Queries
DISCLAIMER
Angel Broking Private Limited (hereinafter referred to as “Angel”) is a registered Member of National Stock Exchange of India Limited,
Bombay Stock Exchange Limited and MCX Stock Exchange Limited. It is also registered as a Depository Participant with CDSL and
Portfolio Manager with SEBI. It also has registration with AMFI as a Mutual Fund Distributor. Angel Broking Private Limited is a
registered entity with SEBI for Research Analyst in terms of SEBI (Research Analyst) Regulations, 2014 vide registration number
INH000000164. Angel or its associates has not been debarred/ suspended by SEBI or any other regulatory authority for accessing
/dealing in securities Market. Angel or its associates including its relatives/analyst do not hold any financial interest/beneficial
ownership of more than 1% in the company covered by Analyst. Angel or its associates/analyst has not received any compensation /
managed or co-managed public offering of securities of the company covered by Analyst during the past twelve months. Angel/analyst
has not served as an officer, director or employee of company covered by Analyst and has not been engaged in market making activity
of the company covered by Analyst.
This document is solely for the personal information of the recipient, and must not be singularly used as the basis of any investment
decision. Nothing in this document should be construed as investment or financial advice. Each recipient of this document should
make such investigations as they deem necessary to arrive at an independent evaluation of an investment in the securities of the
companies referred to in this document (including the merits and risks involved), and should consult their own advisors to determine
the merits and risks of such an investment.
Reports based on technical and derivative analysis center on studying charts of a stock's price movement, outstanding positions and
trading volume, as opposed to focusing on a company's fundamentals and, as such, may not match with a report on a company's
fundamentals.
The information in this document has been printed on the basis of publicly available information, internal data and other reliable
sources believed to be true, but we do not represent that it is accurate or complete and it should not be relied on as such, as this
document is for general guidance only. Angel Broking Pvt. Limited or any of its affiliates/ group companies shall not be in any way
responsible for any loss or damage that may arise to any person from any inadvertent error in the information contained in this report.
Angel Broking Pvt. Limited has not independently verified all the information contained within this document. Accordingly, we cannot
testify, nor make any representation or warranty, express or implied, to the accuracy, contents or data contained within this document.
While Angel Broking Pvt. Limited endeavors to update on a reasonable basis the information discussed in this material, there may be
regulatory, compliance, or other reasons that prevent us from doing so.
This document is being supplied to you solely for your information, and its contents, information or data may not be reproduced,
redistributed or passed on, directly or indirectly.
Neither Angel Broking Pvt. Limited, nor its directors, employees or affiliates shall be liable for any loss or damage that may arise from
or in connection with the use of this information.
Note: Please refer to the important ‘Stock Holding Disclosure' report on the Angel website (Research Section). Also, please refer to the
latest update on respective stocks for the disclosure status in respect of those stocks. Angel Broking Pvt. Limited and its affiliates may
have investment positions in the stocks recommended in this report.
5