Technical & Derivatives Report
May 30, 2016
Sensex (26654) / Nifty (8157)
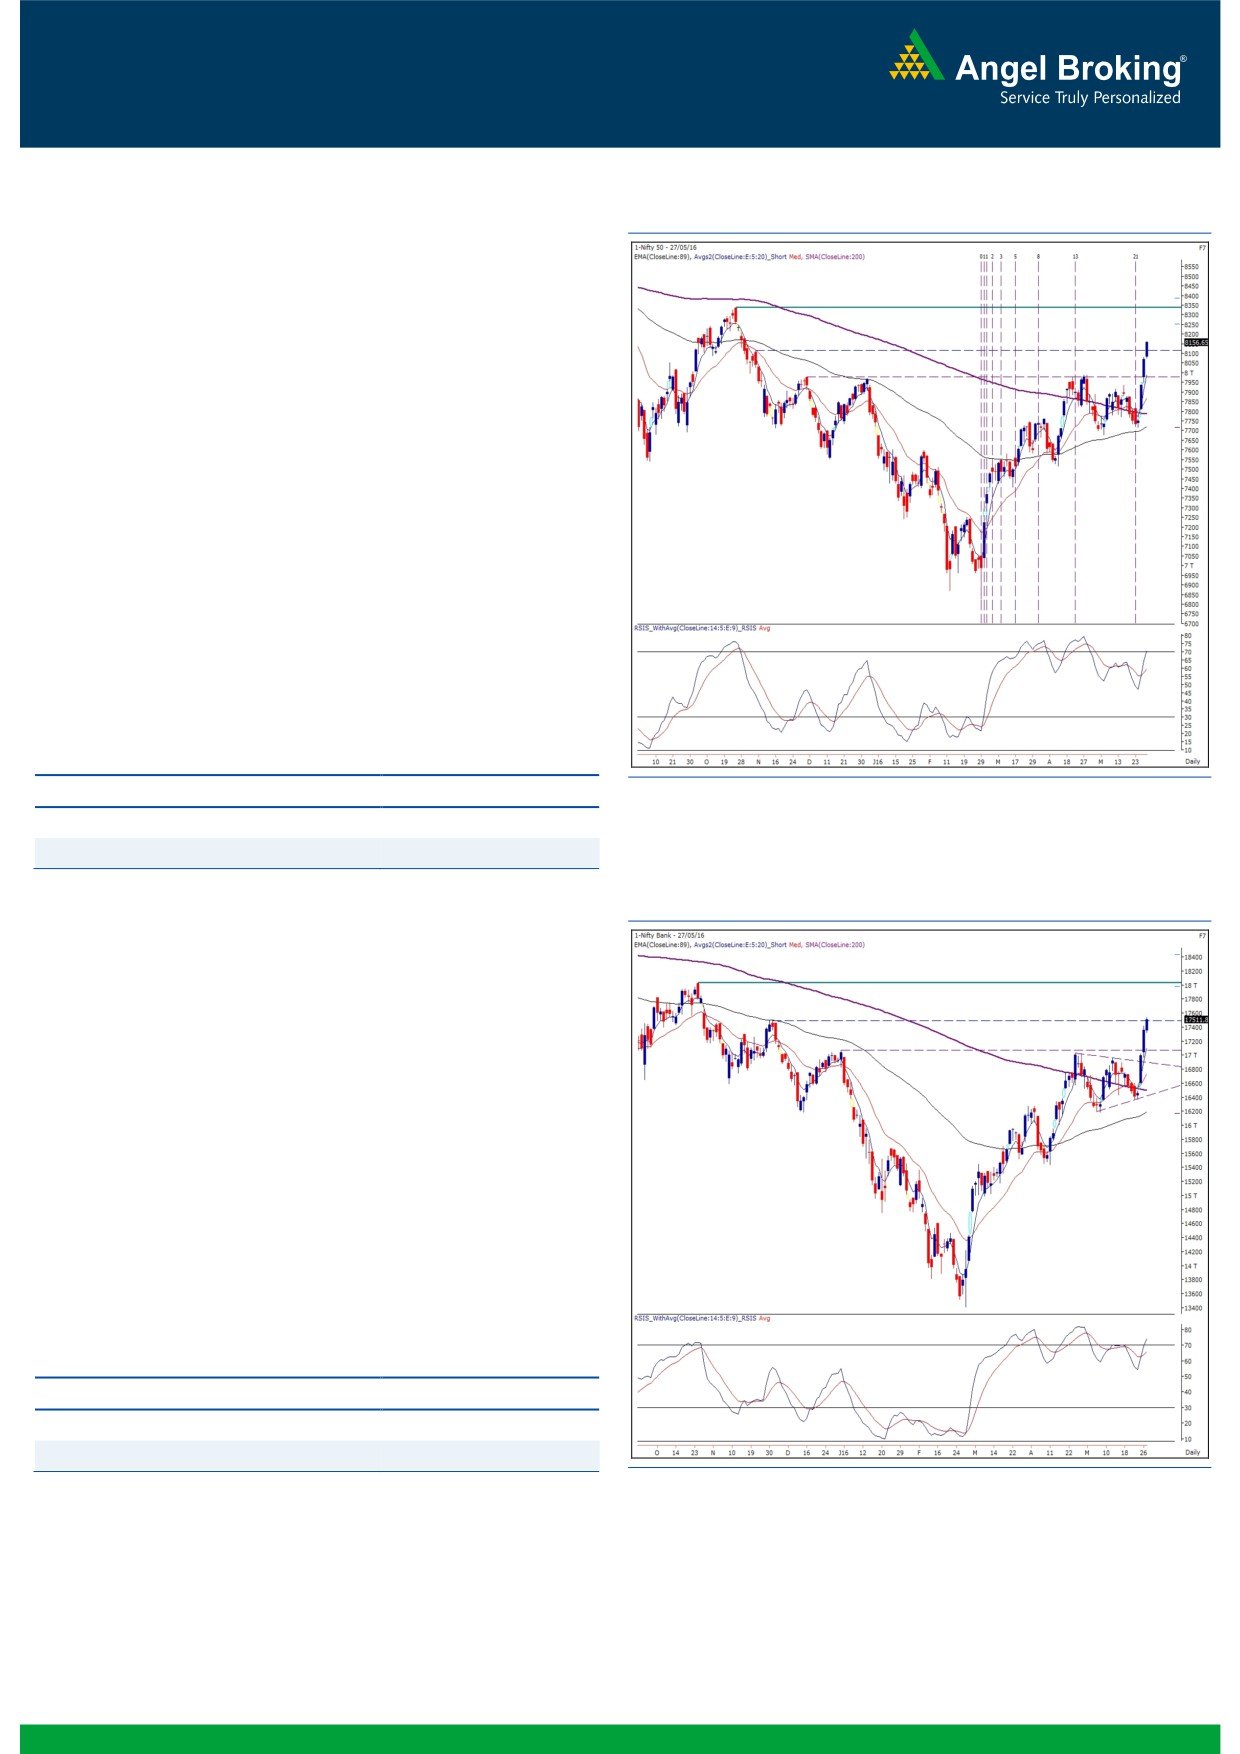
Exhibit 1: Nifty Daily Chart
In Friday’s trading session, the Nifty index continued its positive
momentum and ended the session with gains of 1.08%.
It was a remarkable week for our markets as we witnessed the
second biggest weekly gains in the calendar year 2016. The Nifty
has now confirmed a breakout from the ‘Inverse Head and
Shoulder’ pattern and thus, we expect this momentum to continue
towards the next major resistance of 8336. On the downside, if
we go by the ‘Change of Polarity’ rule, the neckline level of 8000
- 7950 would now act as a strong support zone. We reiterate that
traders shouldn't be expecting any immediate reversal in the
ongoing upward momentum because given the strong optimism
that the market is riding on, there is a tendency of even minor
intraday dips getting bought into. After such a sharp move, it
would be difficult for those who have missed this move to initiate
fresh positions in the index considering the risk - reward ratio. But
there is still room to earn by concentrating on individual stocks
which may now offer potential trades on the long side.
Key Levels
Support 1 - 8115
Resistance 1 - 8210
Support 2 - 8077
Resistance 2 - 8242
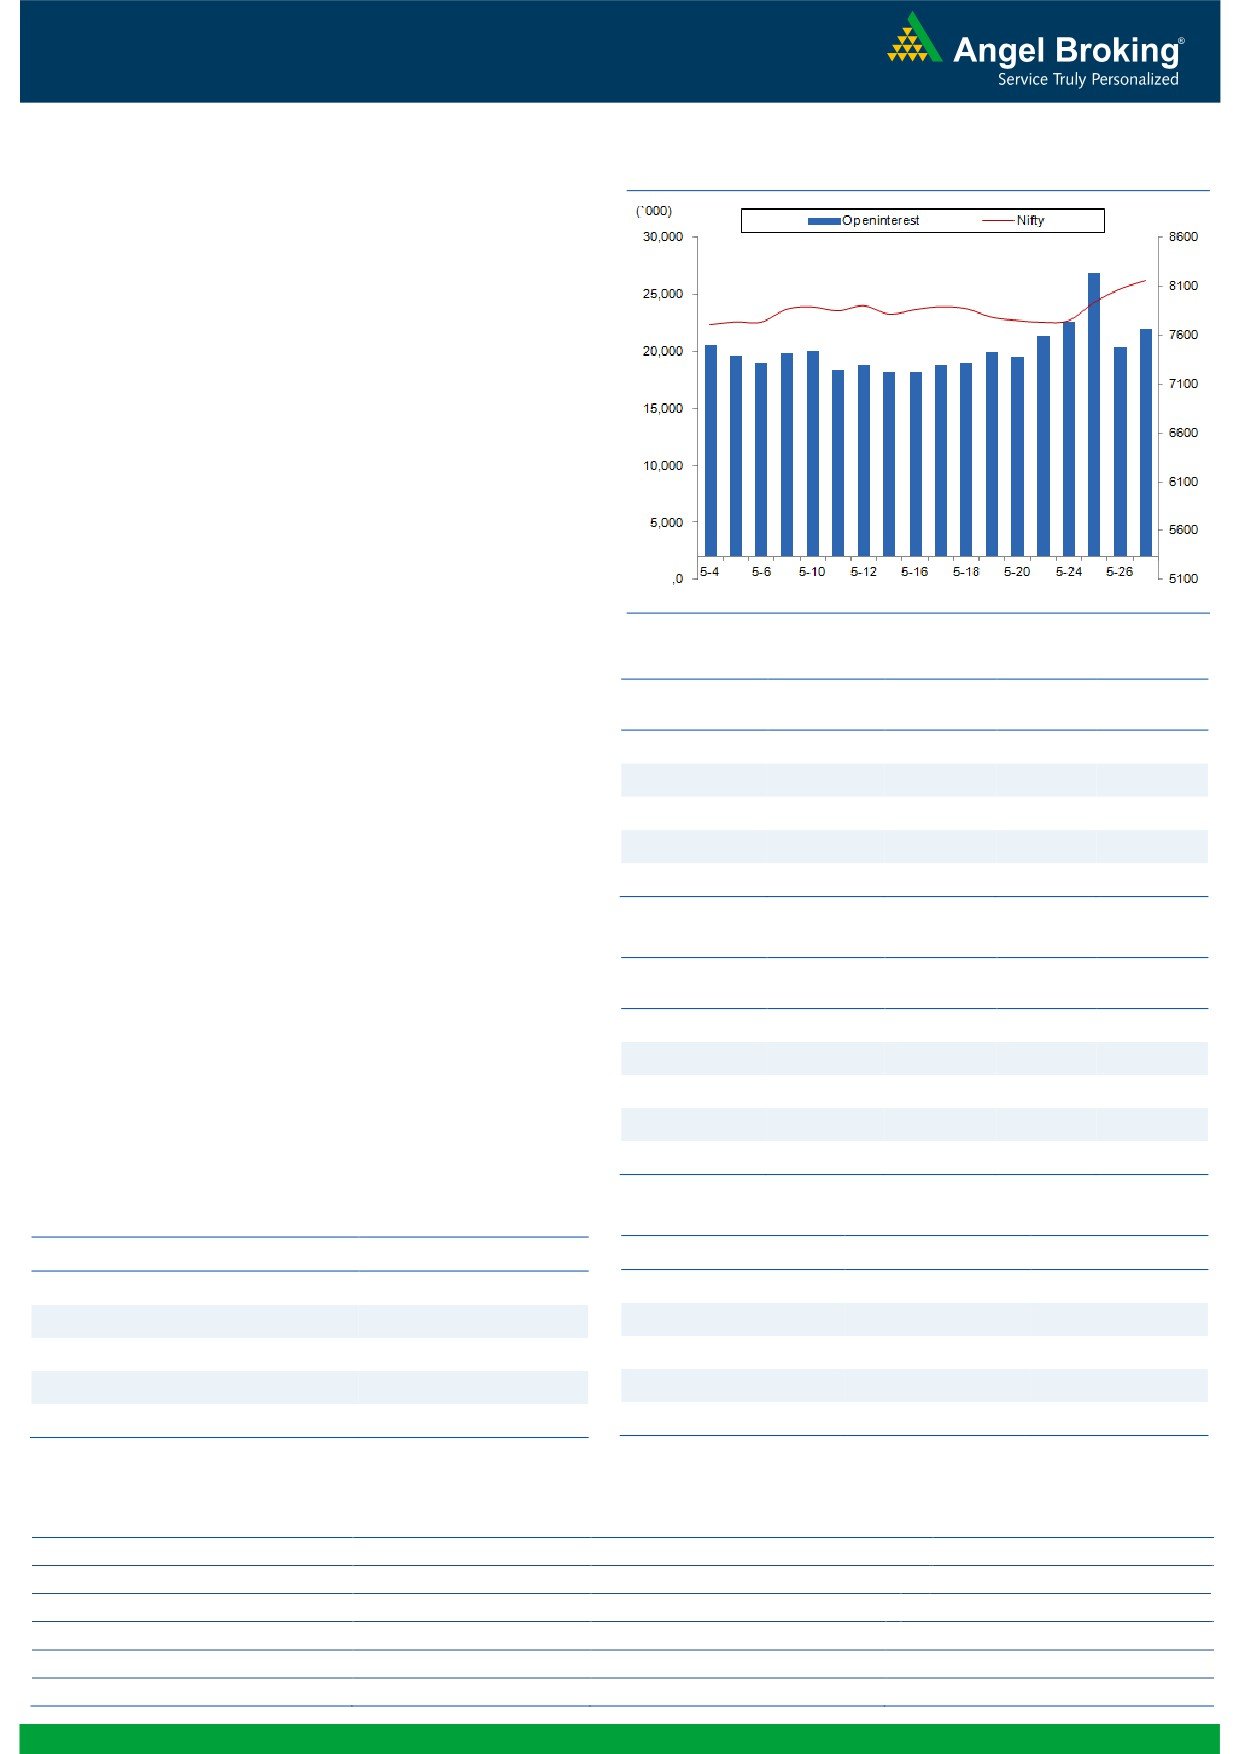
Exhibit 2: Nifty Bank Daily Chart
Nifty Bank Outlook - (17512)
The Nifty Bank index continued the positive momentum and
ended the session with gains of 0.88% over its previous day's
close.
In the week gone by, the index moved in line of our expectation
and gained over 6%. The positive momentum, which picked up
post breach of the resistance zone of
17000-17080, still
continues with index heavyweights moving higher. Traders are
advised to continue to hold the long positions till the trend
remains intact. The stock specific moves within the sector still
provide opportunity to earn by trading on long side with proper
risk management. The near term support for the index is placed
around 17300 and 17070 whereas resistances are seen around
17690 and 17780.
Key Levels
Support 1 - 17300
Resistance 1 - 17690
Support 2 - 17070
Resistance 2 - 17780
1
Technical & Derivatives Report
May 30, 2016
Comments
Nifty Vs OI
The Nifty futures open interest has increased by 8.00%
BankNifty futures open interest has increased by 7.07%
as market closed at 8156.65 levels.
The Nifty June future closed with a premium of 15.80
points against flat closing in previous session. The July
series closed at a premium of 35.35 points.
The Implied Volatility of at the money options has
increased from 13.37% to 13.63%.
The total OI of the market is Rs. 1,88,116/- cr. and the
stock futures OI is Rs. 60,331/- cr.
Few of the liquid counters where we have seen high cost
of carry are JPASSOCIAT, SYNDIBANK, GMRINFRA,
NHPC and UNITECH.
Views
Nifty continued to show strength in Friday’s session, FIIs
OI Gainers
too participated in a big way. In cash market segment,
OI
PRICE
they bought to the tune of Rs. 480 crores. While in Index
SCRIP
OI
PRICE
CHG. (%)
CHG. (%)
Futures, they continue buying significantly of Rs. 2162
BPCL
5539200
29.43
1005.25
7.66
crores with huge amount of rise in OI, indicating huge
CUMMINSIND
1200000
27.96
789.30
-1.27
long formation.
IOC
7260000
23.94
416.70
2.72
On the other hand in options front, they were net buyers
BIOCON
3009600
22.97
705.65
6.59
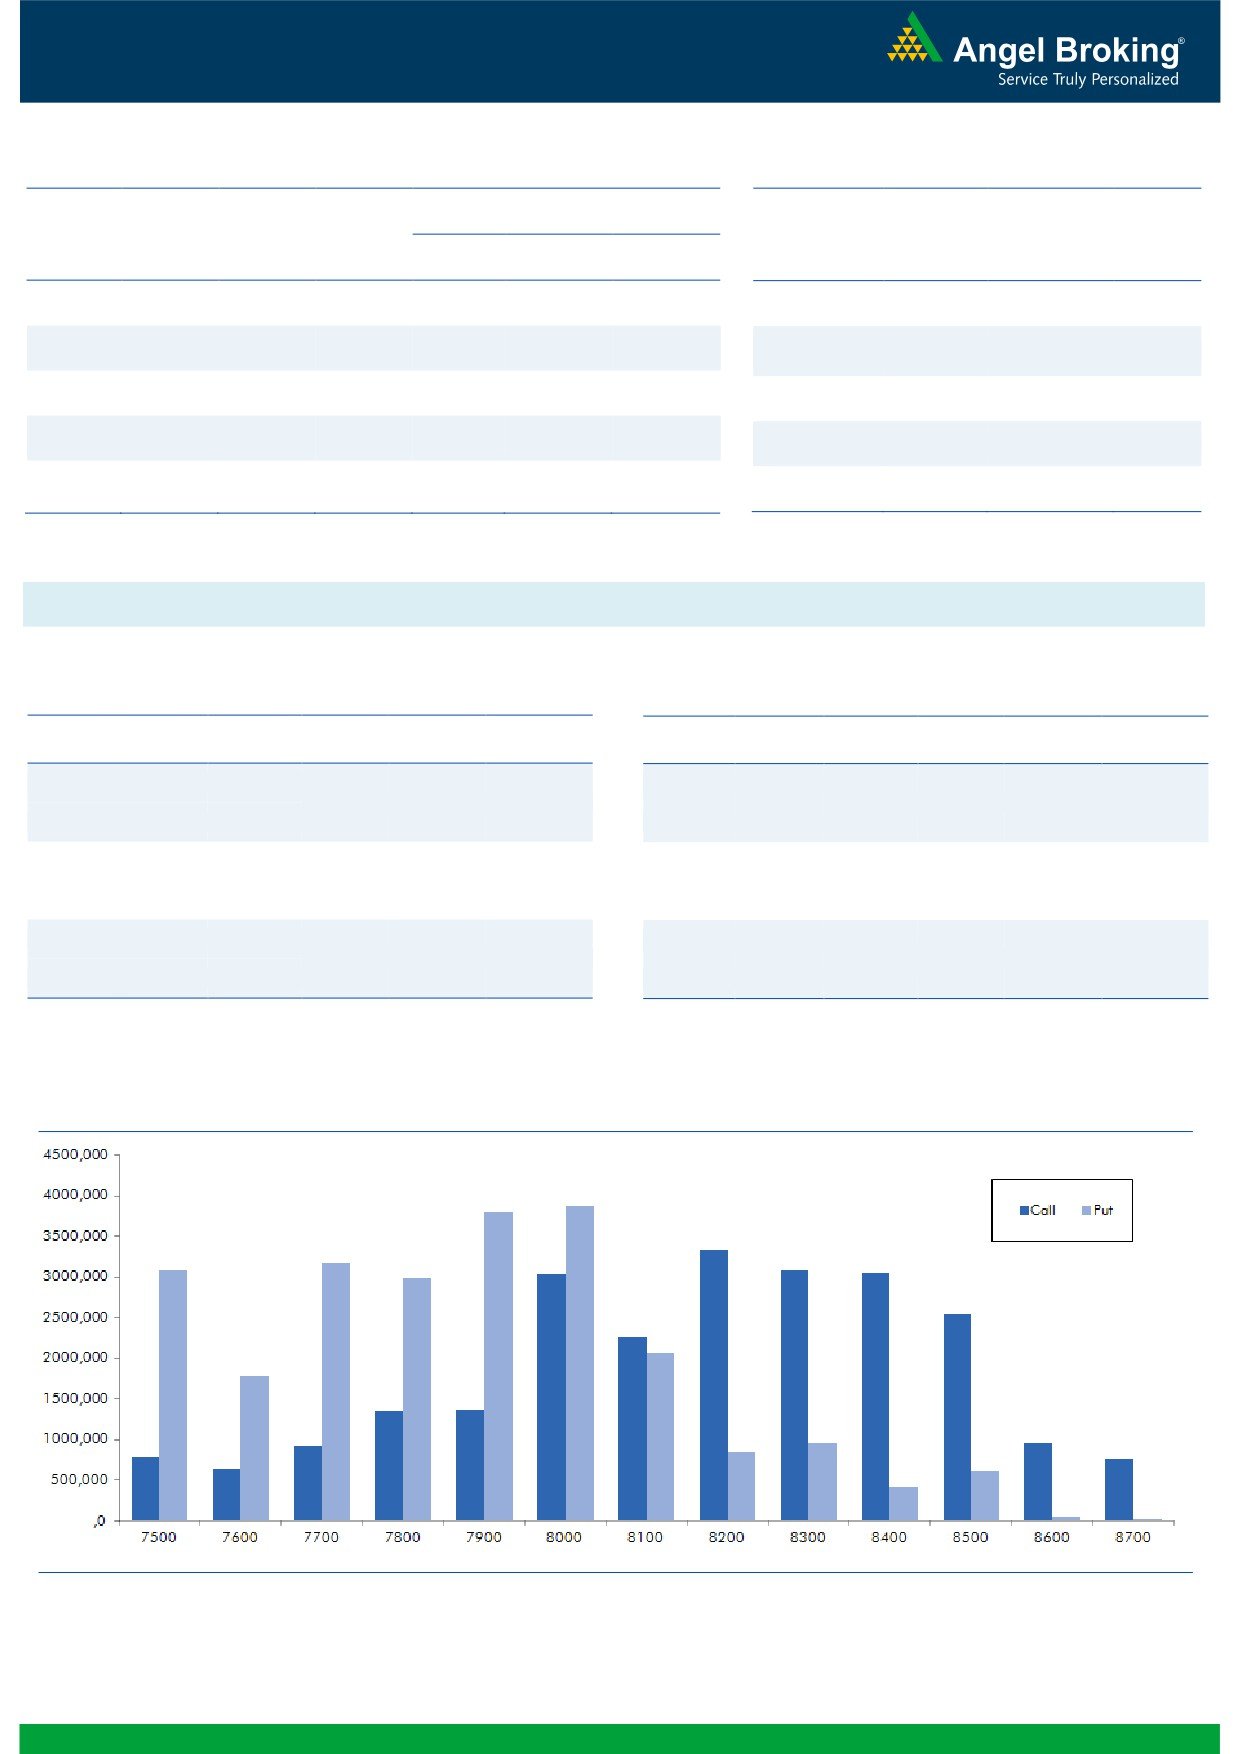
worth Rs. 1909 crores with rise in open interest. In call
options, 8400-8500 call options were active and added
CANBK
9399000
20.12
192.50
-1.28
good amount of OI. We believe FIIs are continuously
forming longs in call options expecting further strength.
OI Losers
While in put options, 7900-8100 strikes added good
OI
PRICE
SCRIP
OI
PRICE
amount of OI, which may be blend of long and short
CHG. (%)
CHG. (%)
formation. Maximum build-up in June series is visible in
SUNTV
3562000
-6.75
384.80
1.10
8200 call and of put options has shifted from 7500 to
SAIL
41304000
-6.50
43.05
5.00
8000 strike.
MOTHERSUMI
11596500
-4.62
280.10
1.43
Seeing the quantum of buying in last three trading
RELIANCE
24562000
-4.52
980.40
2.65
sessions, we believe Nifty may continue to show strength,
RPOWER
43944000
-4.46
52.70
7.33
one can expect Nifty breaching 8300 levels in near term.
Historical Volatility
Put-Call Ratio
SCRIP
HV
SCRIP
PCR-OI
PCR-VOL
SUNPHARMA
37.02
NIFTY
0.99
0.81
HINDPETRO
53.63
BANKNIFTY
1.05
0.84
BPCL
50.82
SBIN
1.01
0.60
BIOCON
42.38
LT
1.07
0.75
RPOWER
48.83
RELIANCE
0.83
0.68
Strategy Date
Symbol
Strategy
Status
2
Technical & Derivatives Report
May 30, 2016
FII Statistics for 27-May 2016
Turnover on 27-May 2016
Open Interest
No. of
Turnover
Change
Detail
Buy
Sell
Net
Instrument
Value
Contracts
( in Cr. )
(%)
Contracts
Change (%)
(in Cr.)
INDEX
INDEX
4854.25
2691.77
2162.48
281850
16906.85
11.27
292711
17013.27
-47.56
FUTURES
FUTURES
INDEX
INDEX
33648.50
31739.14
1909.36
783886
47644.47
9.74
2418868
146127.93
-74.79
OPTIONS
OPTIONS
STOCK
6365.50
5351.40
1014.10
981776
48310.54
1.28
STOCK
FUTURES
746720
37165.80
-53.91
FUTURES
STOCK
STOCK
4063.97
3947.81
116.16
35754
1746.60
2066.91
OPTIONS
427814
20769.14
-31.37
OPTIONS
TOTAL
48932.22
43730.13
5202.09
2083266
114608.46
7.46
TOTAL
3886113
221076.15
-69.42
Nifty Spot = 8156.65
Lot Size = 75
Bull-Call Spreads
Bear-Put Spreads
Action
Strike
Price
Risk
Reward
BEP
Action
Strike
Price
Risk
Reward
BEP
Buy
8200
121.85
Buy
8100
108.40
43.85
56.15
8243.85
32.15
67.85
8067.85
Sell
8300
78.00
Sell
8000
76.25
Buy
8200
121.85
Buy
8100
108.40
75.10
124.90
8275.10
55.10
144.90
8044.90
Sell
8400
46.75
Sell
7900
53.30
Buy
8300
78.00
Buy
8000
76.25
31.25
68.75
8331.25
22.95
77.05
7977.05
Sell
8400
46.75
Sell
7900
53.30
Note: Above mentioned Bullish or Bearish Spreads in Nifty (June Series) are given as an information and not as a recommendation.
Nifty Put-Call Analysis
3
Technical & Derivatives Report
May 30, 2016
Daily Pivot Levels for Nifty Constituents
Scrips
S2
S1
PIVOT
R1
R2
ACC
1,489
1,507
1,520
1,538
1,551
ADANIPORTS
182
187
190
195
198
AMBUJACEM
223
227
229
233
235
ASIANPAINT
980
988
995
1,004
1,010
AUROPHARMA
729
746
759
776
789
AXISBANK
500
507
516
523
532
BAJAJ-AUTO
2,449
2,506
2,544
2,601
2,639
BANKBARODA
132
135
138
141
144
BHEL
123
126
129
131
135
BPCL
915
960
992
1,037
1,070
BHARTIARTL
345
348
353
356
361
INFRATEL
381
383
388
390
394
BOSCH
21,440
21,670
21,884
22,115
22,329
CIPLA
464
469
474
478
483
COALINDIA
278
280
282
284
286
DRREDDY
3,047
3,081
3,110
3,144
3,173
EICHERMOT
18,282
18,512
18,656
18,886
19,029
GAIL
373
376
381
384
389
GRASIM
4,304
4,333
4,359
4,387
4,414
HCLTECH
736
747
753
764
770
HDFCBANK
1,171
1,179
1,185
1,192
1,198
HDFC
1,196
1,223
1,246
1,273
1,296
HEROMOTOCO
2,941
2,968
2,989
3,016
3,037
HINDALCO
90
91
92
93
94
HINDUNILVR
844
852
859
868
875
ICICIBANK
233
237
243
247
253
IDEA
110
111
113
115
117
INDUSINDBK
1,092
1,098
1,105
1,111
1,118
INFY
1,217
1,231
1,245
1,259
1,273
ITC
352
356
360
364
368
KOTAKBANK
729
736
740
747
752
LT
1,436
1,455
1,471
1,491
1,507
LUPIN
1,436
1,458
1,497
1,519
1,557
M&M
1,307
1,320
1,341
1,355
1,376
MARUTI
4,062
4,104
4,133
4,175
4,204
NTPC
138
139
140
141
143
ONGC
207
210
215
217
222
POWERGRID
147
149
151
153
154
RELIANCE
939
957
967
985
995
SBIN
174
188
195
209
216
SUNPHARMA
776
801
814
839
852
TCS
2,538
2,556
2,568
2,585
2,597
TATAMTRDVR
267
269
271
274
276
TATAMOTORS
393
398
402
407
411
TATAPOWER
71
72
73
74
76
TATASTEEL
321
325
329
333
336
TECHM
529
533
537
540
544
ULTRACEMCO
3,201
3,225
3,240
3,264
3,279
WIPRO
538
542
546
550
554
YESBANK
1,005
1,015
1,028
1,039
1,052
ZEEL
438
446
450
458
462
4
Technical & Derivatives Report
May 30, 2016
Research Team Tel: 022 - 39357800
For Technical Queries
For Derivatives Queries
DISCLAIMER
Angel Broking Private Limited (hereinafter referred to as “Angel”) is a registered Member of National Stock Exchange of India Limited,
Bombay Stock Exchange Limited and MCX Stock Exchange Limited. It is also registered as a Depository Participant with CDSL and
Portfolio Manager with SEBI. It also has registration with AMFI as a Mutual Fund Distributor. Angel Broking Private Limited is a
registered entity with SEBI for Research Analyst in terms of SEBI (Research Analyst) Regulations, 2014 vide registration number
INH000000164. Angel or its associates has not been debarred/ suspended by SEBI or any other regulatory authority for accessing
/dealing in securities Market. Angel or its associates including its relatives/analyst do not hold any financial interest/beneficial
ownership of more than 1% in the company covered by Analyst. Angel or its associates/analyst has not received any compensation /
managed or co-managed public offering of securities of the company covered by Analyst during the past twelve months. Angel/analyst
has not served as an officer, director or employee of company covered by Analyst and has not been engaged in market making activity
of the company covered by Analyst.
This document is solely for the personal information of the recipient, and must not be singularly used as the basis of any investment
decision. Nothing in this document should be construed as investment or financial advice. Each recipient of this document should
make such investigations as they deem necessary to arrive at an independent evaluation of an investment in the securities of the
companies referred to in this document (including the merits and risks involved), and should consult their own advisors to determine
the merits and risks of such an investment.
Reports based on technical and derivative analysis center on studying charts of a stock's price movement, outstanding positions and
trading volume, as opposed to focusing on a company's fundamentals and, as such, may not match with a report on a company's
fundamentals.
The information in this document has been printed on the basis of publicly available information, internal data and other reliable
sources believed to be true, but we do not represent that it is accurate or complete and it should not be relied on as such, as this
document is for general guidance only. Angel Broking Pvt. Limited or any of its affiliates/ group companies shall not be in any way
responsible for any loss or damage that may arise to any person from any inadvertent error in the information contained in this report.
Angel Broking Pvt. Limited has not independently verified all the information contained within this document. Accordingly, we cannot
testify, nor make any representation or warranty, express or implied, to the accuracy, contents or data contained within this document.
While Angel Broking Pvt. Limited endeavors to update on a reasonable basis the information discussed in this material, there may be
regulatory, compliance, or other reasons that prevent us from doing so.
This document is being supplied to you solely for your information, and its contents, information or data may not be reproduced,
redistributed or passed on, directly or indirectly.
Neither Angel Broking Pvt. Limited, nor its directors, employees or affiliates shall be liable for any loss or damage that may arise from
or in connection with the use of this information.
Note: Please refer to the important ‘Stock Holding Disclosure' report on the Angel website (Research Section). Also, please refer to the
latest update on respective stocks for the disclosure status in respect of those stocks. Angel Broking Pvt. Limited and its affiliates may
have investment positions in the stocks recommended in this report.
5