Technical & Derivatives Report
March 30, 2016
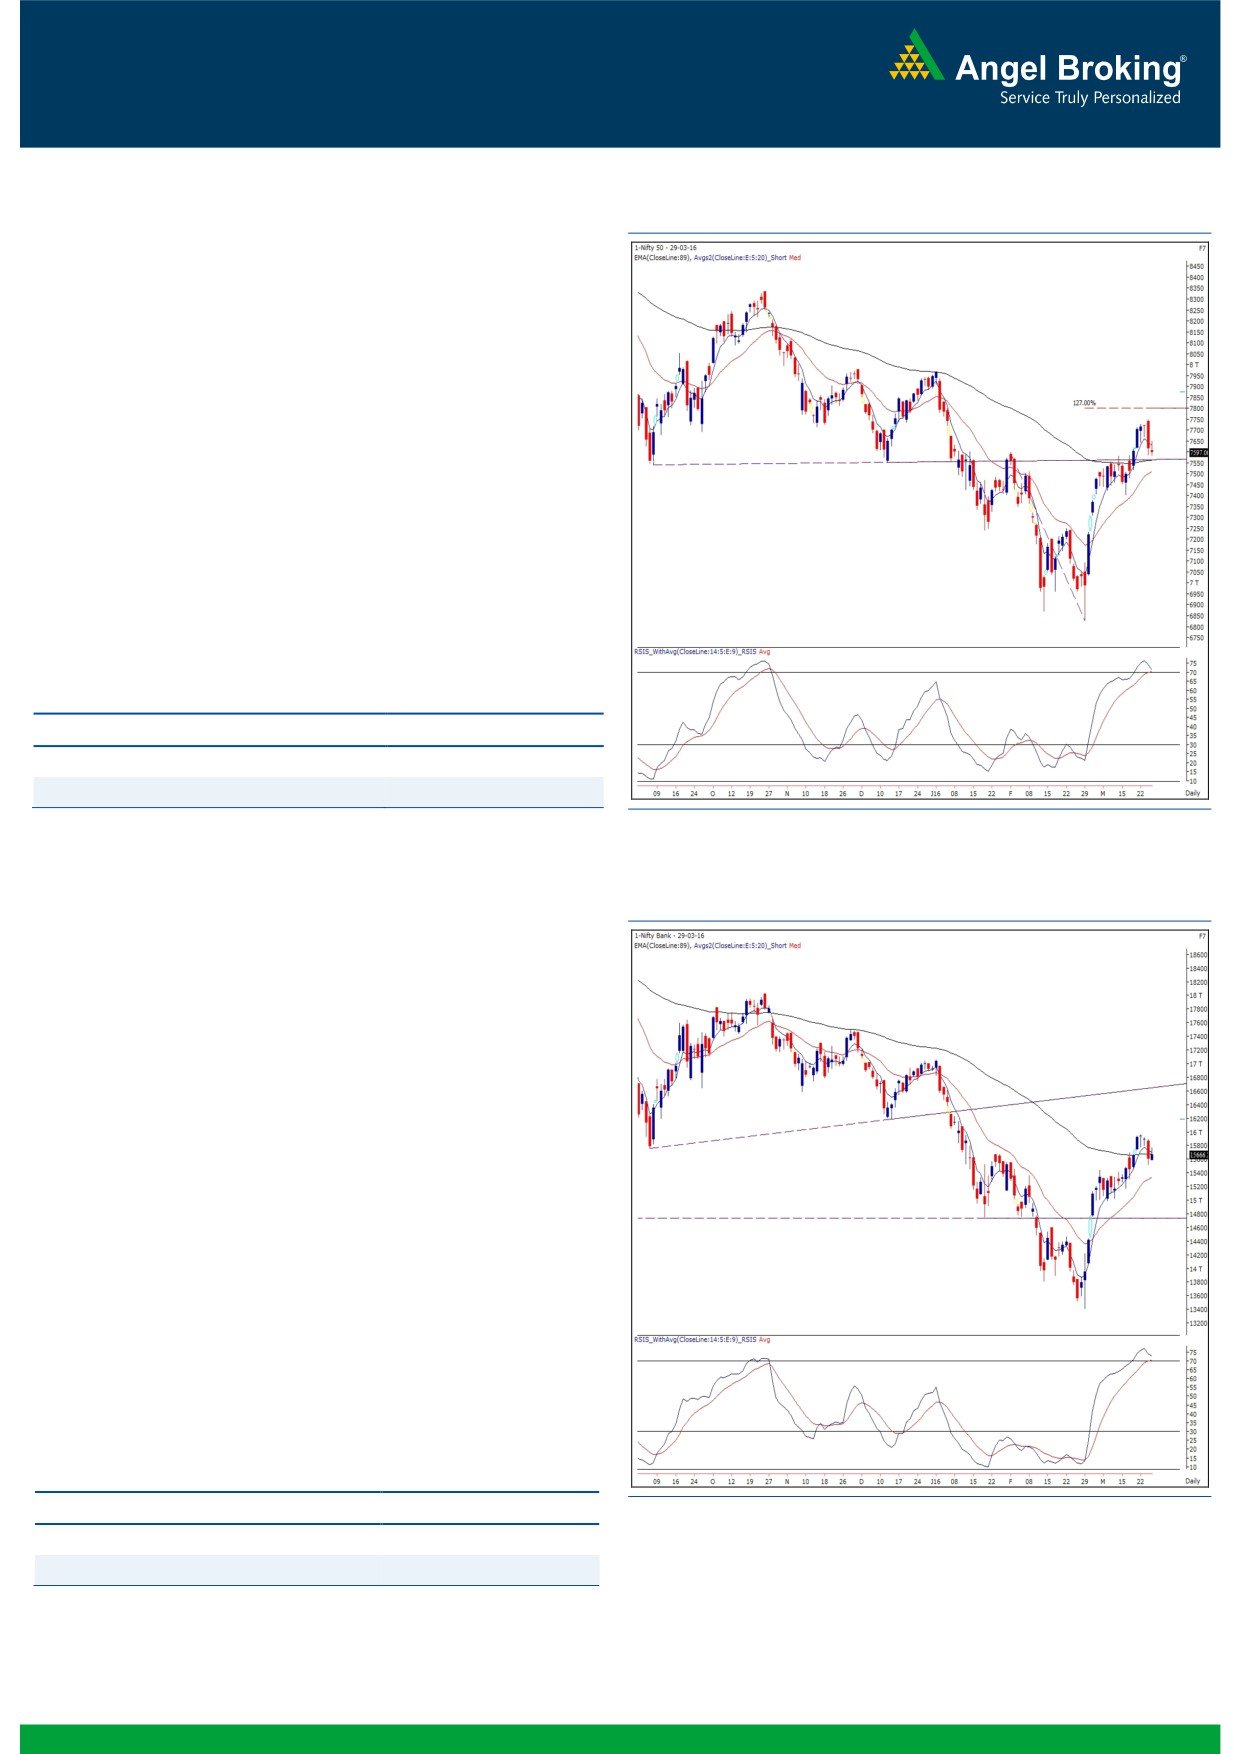
Sensex (24900) / Nifty (7597)
Exhibit 1: Nifty Daily Chart
Yesterday, our markets opened on a flat note in-line with quiet
global cues. Subsequently, the index remained slightly under
pressure to once again sneak below the 7600 mark. However,
similar to previous session, we saw index finding some support
around 7580. Overall, the entire session was a bit range
bound with a mildly negative bias.
At present, we do not see any major change in the chart
structure and thus, the view remains unchanged. We maintain
our view that traders should not remain on the short side as
7580 - 7550 seems to be a strong support zone. On the
flipside, 7680 is likely to act as an immediate resistance in the
forthcoming session.
Key Levels
Support 1 - 7580
Resistance 1 - 7680
Support 2 - 7550
Resistance 2 -
7750
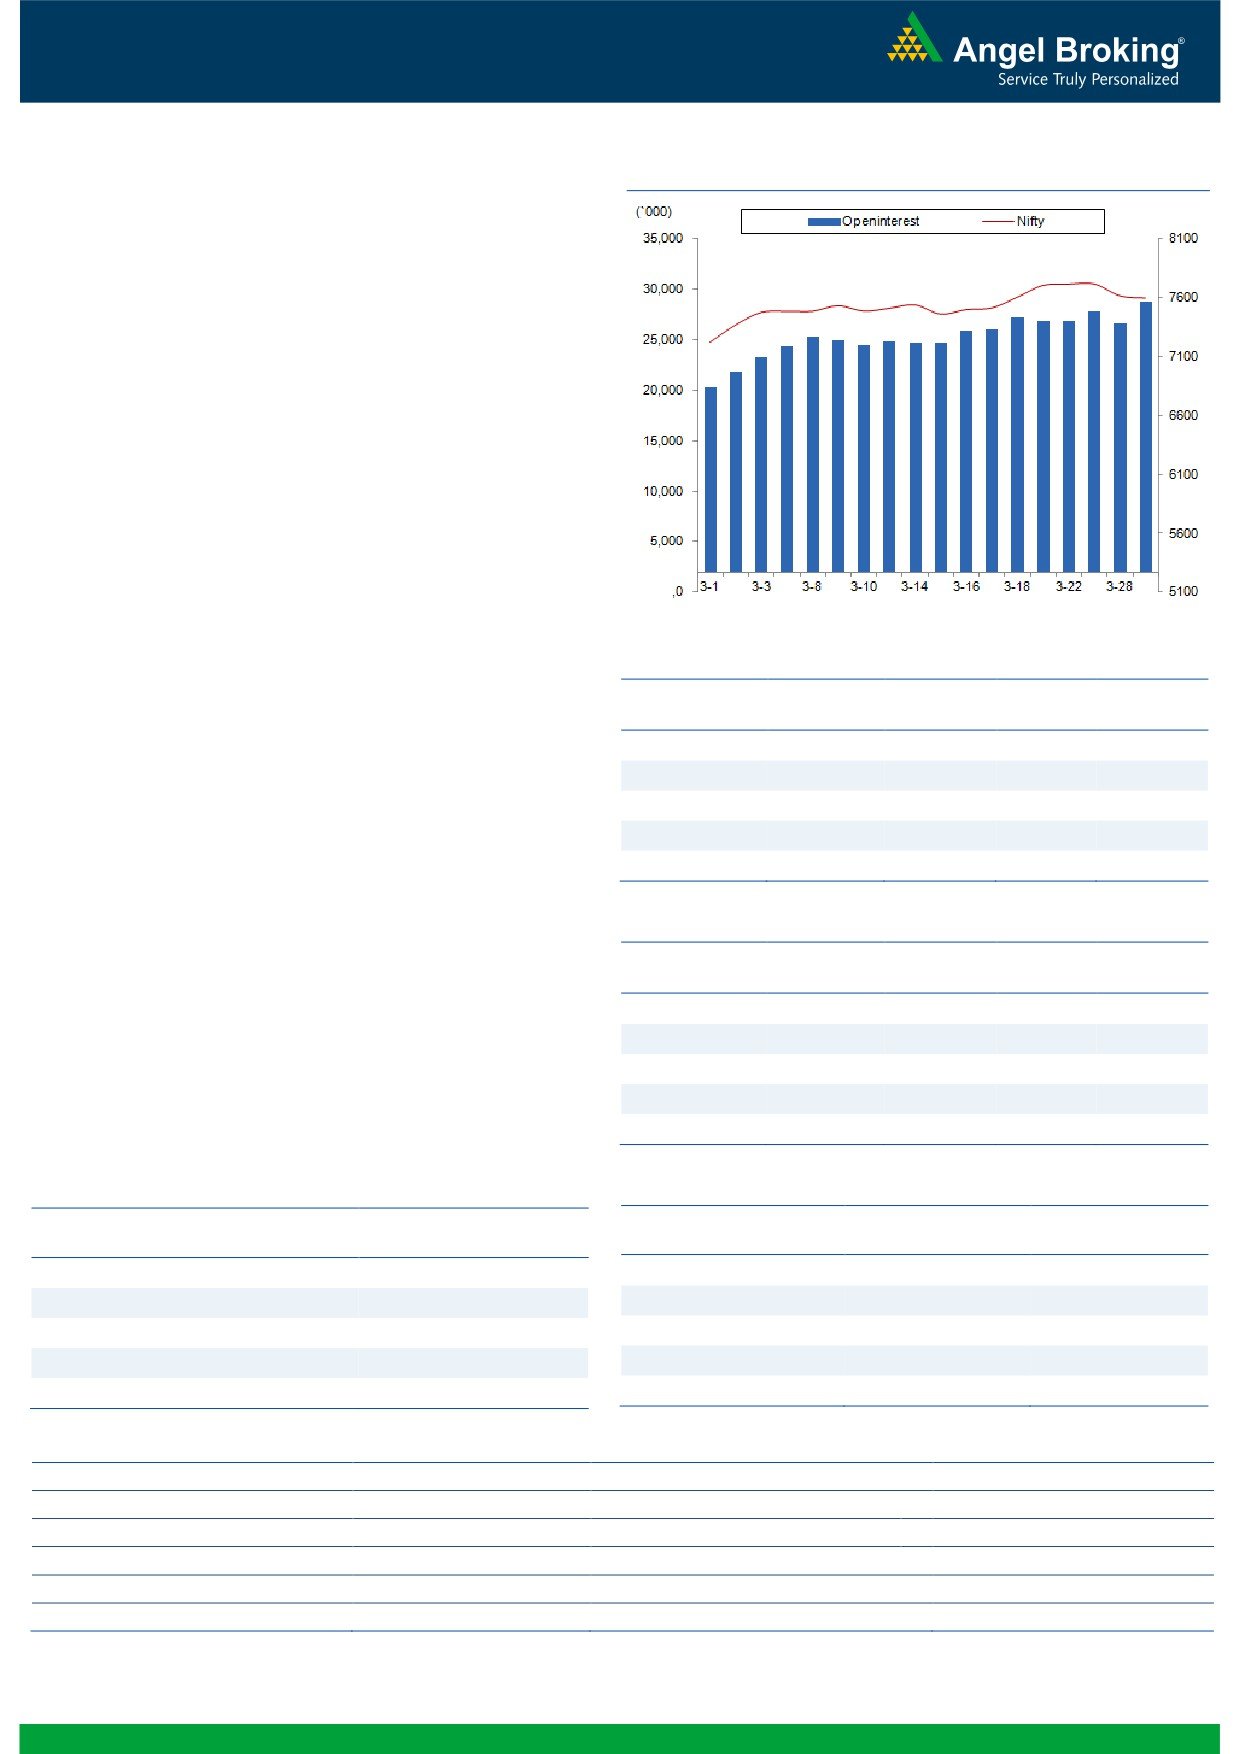
Exhibit 2: Nifty Bank Daily Chart
Nifty Bank Outlook - (15666)
Yesterday, the Nifty Bank index opened with negligible loss
and started moving higher from the first tick. Post the up move
in the initial hour of the trade, the banking index traded in a
narrow range and eventually ended the session with marginal
gains of 0.39 percent over its previous close.
The banking index clearly showed its outperformance during
yesterday's session by maintaining its position well inside the
positive territory despite some decent profit booking in the
broader market. Similar to Nifty, we do not see any notable
change in the chart structure and thus, we reiterate our view
that the correction in last couple of sessions could just be a
pull-back within a short term up move. Traders are therefore
advised to trade with a stock specific approach and wait for
further developments to happen on the index front. The
intraday support for the banking index is placed around
15522 - 15450; whereas, resistance is seen at 15775 -
15857.
Key Levels
Support 1 - 15522
Resistance 1 - 15775
Support 2 - 15450
Resistance 2 - 15857
1
Technical & Derivatives Report
March 30, 2016
Comments
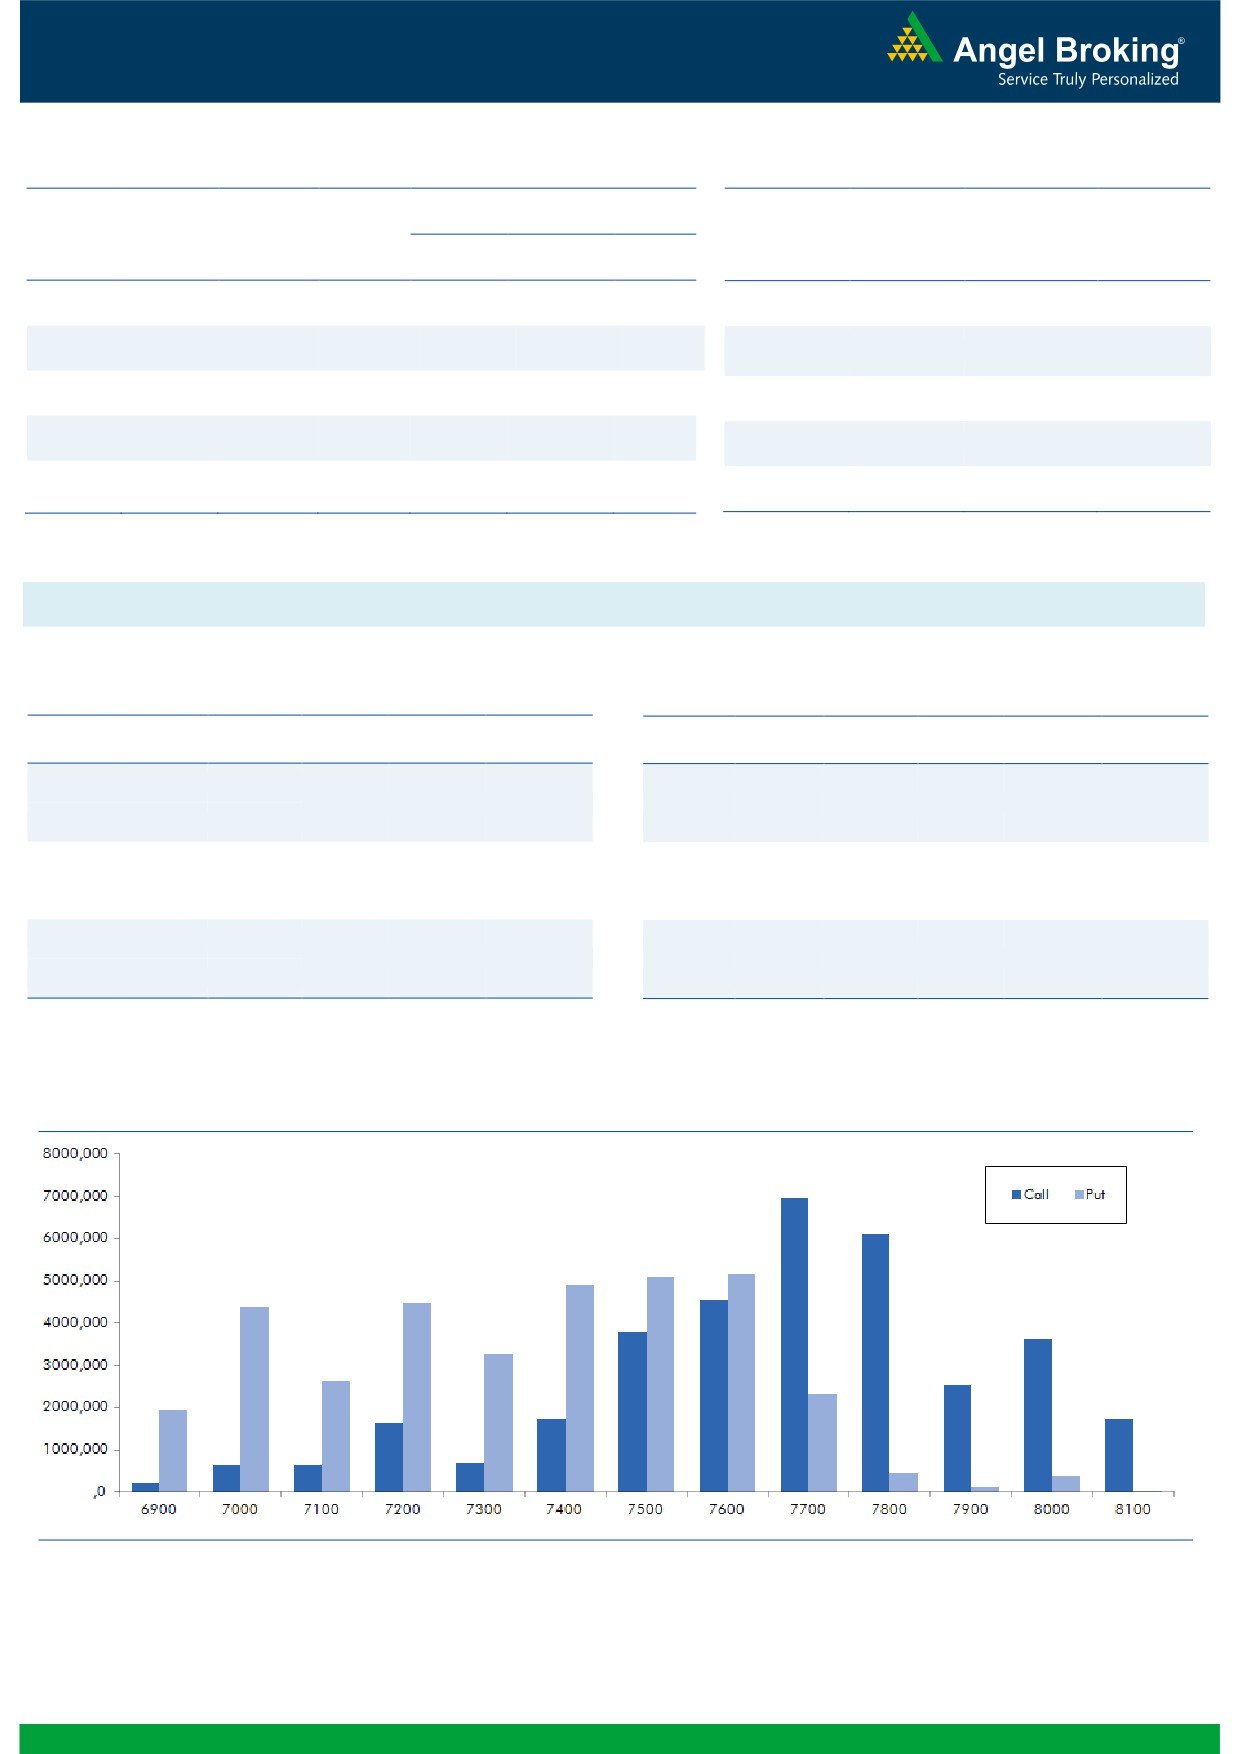
Nifty Vs OI
The Nifty futures open interest has increased by 8.03%
BankNifty futures open interest has decreased by 0.59%
as market closed at 7597.00 levels.
The Nifty March future closed at a premium of 23.05
points against a premium of 23.50 points. The April
series closed at a premium of 69.40 points.
The Implied Volatility of at the money options has
decreased from 17.39% to 16.90%.
The total OI of the market is Rs. 2,57,161/- cr. and the
stock futures OI is Rs. 60,677 /- cr.
Few of the liquid counters where we have seen high cost
of carry are UNITECH, JPASSOCIAT, MINDTREE,
APOLLOTYRE and VOLTAS.
Views
FIIs were net buyers in both Cash market and Index
OI Gainers
Futures segment. They bought equities to the tune of Rs.
OI
PRICE
SCRIP
OI
PRICE
513 crores. While in Index Futures, they bought of worth
CHG. (%)
CHG. (%)
HEXAWARE
4062000
47.28
259.35
-1.93
Rs. 207 crores with substantial rise in OI, suggesting mix
APOLLOHOSP
1229200
20.18
1341.55
-2.70
of both long and short positions in last trading session.
BANKBARODA
58258300
19.08
140.75
0.93
In Index Options front, FIIs sold of worth Rs. 906 crores
IFCI
66080000
17.83
23.05
-1.71
with some fall in OI. In call options, 7600 strike added
decent build-up; we believe it’s more ofwbuying whichng.com
UNITECH
255640000
17.19
4.90
-1.01
took place. While in put options, we hardly saw any
meaningful OI addition. Continuation of unwinding in
OI Losers
7700 strike suggests; writers of this put have lost their
OI
PRICE
SCRIP
OI
PRICE
hope on Nifty giving expiry above 7700 levels. Maximum
CHG. (%)
CHG. (%)
L&TFH
29312000
-14.73
62.75
-0.71
OI in current series is visible in 7700 call and 7600 put
PIDILITIND
1162000
-10.41
594.80
2.79
options. Rollover in Nifty & BankNifty is on the higher
PNB
29216000
-9.83
82.30
-0.12
side at 44.26% and 40.36% respectively. We expect
March series to expire around 7650-7680 levels, Trade
GODREJIND
1812200
-9.77
347.95
0.77
accordingly.
UCOBANK
10280000
-9.03
37.25
0.27
Historical Volatility
Put-Call Ratio
SCRIP
HV
SCRIP
PCR-OI
PCR-VOL
AJANTPHARM
35.75
NIFTY
0.97
0.90
CIPLA
32.12
BANKNIFTY
1.01
0.94
GLENMARK
38.97
SBIN
0.80
0.47
LUPIN
62.47
LUPIN
0.39
0.52
JINDALSTEL
83.27
ICICIBANK
1.17
0.88
Strategy Date
Symbol
Strategy
Status
February 29, 2016
RELIANCE
Ratio Bull Call Spread
Active
March 07, 2016
BHEL
Long Call Ladder
Profit booked on 28-03-2016
March 14, 2016
NIFTY
Ratio Bull Call Spread
Not Activated
March 21, 2016
BANKNIFTY
Long Call
Active
March 28, 2016
NIFTY
Ratio Bull Call Spread
Active
2
Technical & Derivatives Report
March 30, 2016
FII Statistics for 29-March 2016
Turnover on 29-March 2016
Open Interest
No. of
Turnover
Change
Detail
Buy
Sell
Net
Instrument
Value
Change
Contracts
( in Cr. )
(%)
Contracts
(in Cr.)
(%)
INDEX
INDEX
8529.56
8322.06
207.50
383957
21401.49
17.32
495229
26977.75
24.19
FUTURES
FUTURES
INDEX
INDEX
44089.27
44995.48
(906.21)
1555773
87217.15
1.04
6103148
341863.71
20.50
OPTIONS
OPTIONS
STOCK
22490.35
23246.79
(756.43)
1096628
50374.71
3.00
STOCK
FUTURES
1384520
63941.52
35.42
FUTURES
STOCK
STOCK
3286.51
3400.39
(113.88)
101111
4641.16
0.30
OPTIONS
439522
20976.69
16.52
OPTIONS
TOTAL
78395.69
79964.72
(1569.02)
3137469
163634.51
3.46
TOTAL
8422419
453759.67
22.43
Nifty Spot = 7597.00
Lot Size = 75
Bull-Call Spreads
Bear-Put Spreads
Action
Strike
Price
Risk
Reward
BEP
Action
Strike
Price
Risk
Reward
BEP
Buy
7600
47.00
Buy
7600
28.90
36.40
63.60
7636.40
22.30
77.70
7577.70
Sell
7700
10.60
Sell
7500
6.60
Buy
7600
47.00
Buy
7600
28.90
45.15
154.85
7645.15
26.85
173.15
7573.15
Sell
7800
1.85
Sell
7400
2.05
Buy
7700
10.60
Buy
7500
6.60
8.75
91.25
7708.75
4.55
95.45
7495.45
Sell
7800
1.85
Sell
7400
2.05
Note: Above mentioned Bullish or Bearish Spreads in Nifty (March Series) are given as an information and not as a recommendation.
Nifty Put-Call Analysis
3
Technical & Derivatives Report
March 30, 2016
Daily Pivot Levels for Nifty 50 Stocks
Scrips
S2
S1
PIVOT
R1
R2
ACC
1,334
1,350
1,369
1,385
1,404
ADANIPORTS
229
233
238
242
247
AMBUJACEM
223
227
230
234
237
ASIANPAINT
839
847
854
862
869
AXISBANK
418
424
428
434
439
BAJAJ-AUTO
2,311
2,331
2,353
2,373
2,395
BANKBARODA
136
138
140
142
144
BHARTIARTL
341
348
353
359
364
BHEL
108
110
112
113
116
BOSCHLTD
20,204
20,395
20,543
20,734
20,882
BPCL
858
866
878
886
897
CAIRN
150
152
155
157
160
CIPLA
477
490
508
521
538
COALINDIA
291
293
295
297
300
DRREDDY
2,810
2,876
2,953
3,018
3,096
GAIL
335
341
352
358
368
GRASIM
3,719
3,743
3,772
3,795
3,824
HCLTECH
791
799
808
815
824
HDFC
1,108
1,117
1,129
1,138
1,151
HDFCBANK
1,037
1,046
1,053
1,061
1,068
HEROMOTOCO
2,823
2,840
2,860
2,877
2,897
HINDALCO
82
83
85
86
87
HINDUNILVR
851
856
864
869
876
ICICIBANK
220
222
224
226
229
IDEA
104
106
107
109
110
INDUSINDBK
906
917
924
935
941
INFY
1,175
1,186
1,203
1,214
1,230
ITC
314
317
322
325
330
KOTAKBANK
661
666
674
679
687
LT
1,174
1,184
1,200
1,210
1,226
LUPIN
1,179
1,290
1,391
1,502
1,603
M&M
1,212
1,222
1,238
1,248
1,263
MARUTI
3,591
3,660
3,715
3,784
3,839
NTPC
125
126
128
129
131
ONGC
208
210
213
215
218
PNB
80
81
82
83
84
POWERGRID
135
137
139
140
142
RELIANCE
1,011
1,024
1,033
1,045
1,055
SBIN
185
187
189
192
194
VEDL
85
86
88
89
91
SUNPHARMA
750
772
792
814
834
TATAMOTORS
356
364
371
380
387
TATAPOWER
59
60
61
62
63
TATASTEEL
296
300
304
308
312
TCS
2,439
2,454
2,470
2,486
2,502
TECHM
455
461
470
477
486
ULTRACEMCO
3,070
3,103
3,149
3,182
3,228
WIPRO
542
548
553
559
564
YESBANK
827
837
846
855
864
ZEEL
374
378
383
387
392
4
Technical & Derivatives Report
March 30, 2016
Research Team Tel: 022 - 39357800
For Technical Queries
For Derivatives Queries
DISCLAIMER
Angel Broking Private Limited (hereinafter referred to as “Angel”) is a registered Member of National Stock Exchange of India Limited,
Bombay Stock Exchange Limited and MCX Stock Exchange Limited. It is also registered as a Depository Participant with CDSL and
Portfolio Manager with SEBI. It also has registration with AMFI as a Mutual Fund Distributor. Angel Broking Private Limited is a
registered entity with SEBI for Research Analyst in terms of SEBI (Research Analyst) Regulations, 2014 vide registration number
INH000000164. Angel or its associates has not been debarred/ suspended by SEBI or any other regulatory authority for accessing
/dealing in securities Market. Angel or its associates including its relatives/analyst do not hold any financial interest/beneficial
ownership of more than 1% in the company covered by Analyst. Angel or its associates/analyst has not received any compensation /
managed or co-managed public offering of securities of the company covered by Analyst during the past twelve months. Angel/analyst
has not served as an officer, director or employee of company covered by Analyst and has not been engaged in market making activity
of the company covered by Analyst.
This document is solely for the personal information of the recipient, and must not be singularly used as the basis of any investment
decision. Nothing in this document should be construed as investment or financial advice. Each recipient of this document should
make such investigations as they deem necessary to arrive at an independent evaluation of an investment in the securities of the
companies referred to in this document (including the merits and risks involved), and should consult their own advisors to determine
the merits and risks of such an investment.
Reports based on technical and derivative analysis center on studying charts of a stock's price movement, outstanding positions and
trading volume, as opposed to focusing on a company's fundamentals and, as such, may not match with a report on a company's
fundamentals.
The information in this document has been printed on the basis of publicly available information, internal data and other reliable
sources believed to be true, but we do not represent that it is accurate or complete and it should not be relied on as such, as this
document is for general guidance only. Angel Broking Pvt. Limited or any of its affiliates/ group companies shall not be in any way
responsible for any loss or damage that may arise to any person from any inadvertent error in the information contained in this report.
Angel Broking Pvt. Limited has not independently verified all the information contained within this document. Accordingly, we cannot
testify, nor make any representation or warranty, express or implied, to the accuracy, contents or data contained within this document.
While Angel Broking Pvt. Limited endeavors to update on a reasonable basis the information discussed in this material, there may be
regulatory, compliance, or other reasons that prevent us from doing so.
This document is being supplied to you solely for your information, and its contents, information or data may not be reproduced,
redistributed or passed on, directly or indirectly.
Neither Angel Broking Pvt. Limited, nor its directors, employees or affiliates shall be liable for any loss or damage that may arise from
or in connection with the use of this information.
Note: Please refer to the important ‘Stock Holding Disclosure' report on the Angel website (Research Section). Also, please refer to the
latest update on respective stocks for the disclosure status in respect of those stocks. Angel Broking Pvt. Limited and its affiliates may
have investment positions in the stocks recommended in this report.
5