Technical & Derivatives Report
December 29, 2016
Sensex (26211) / Nifty (8035)
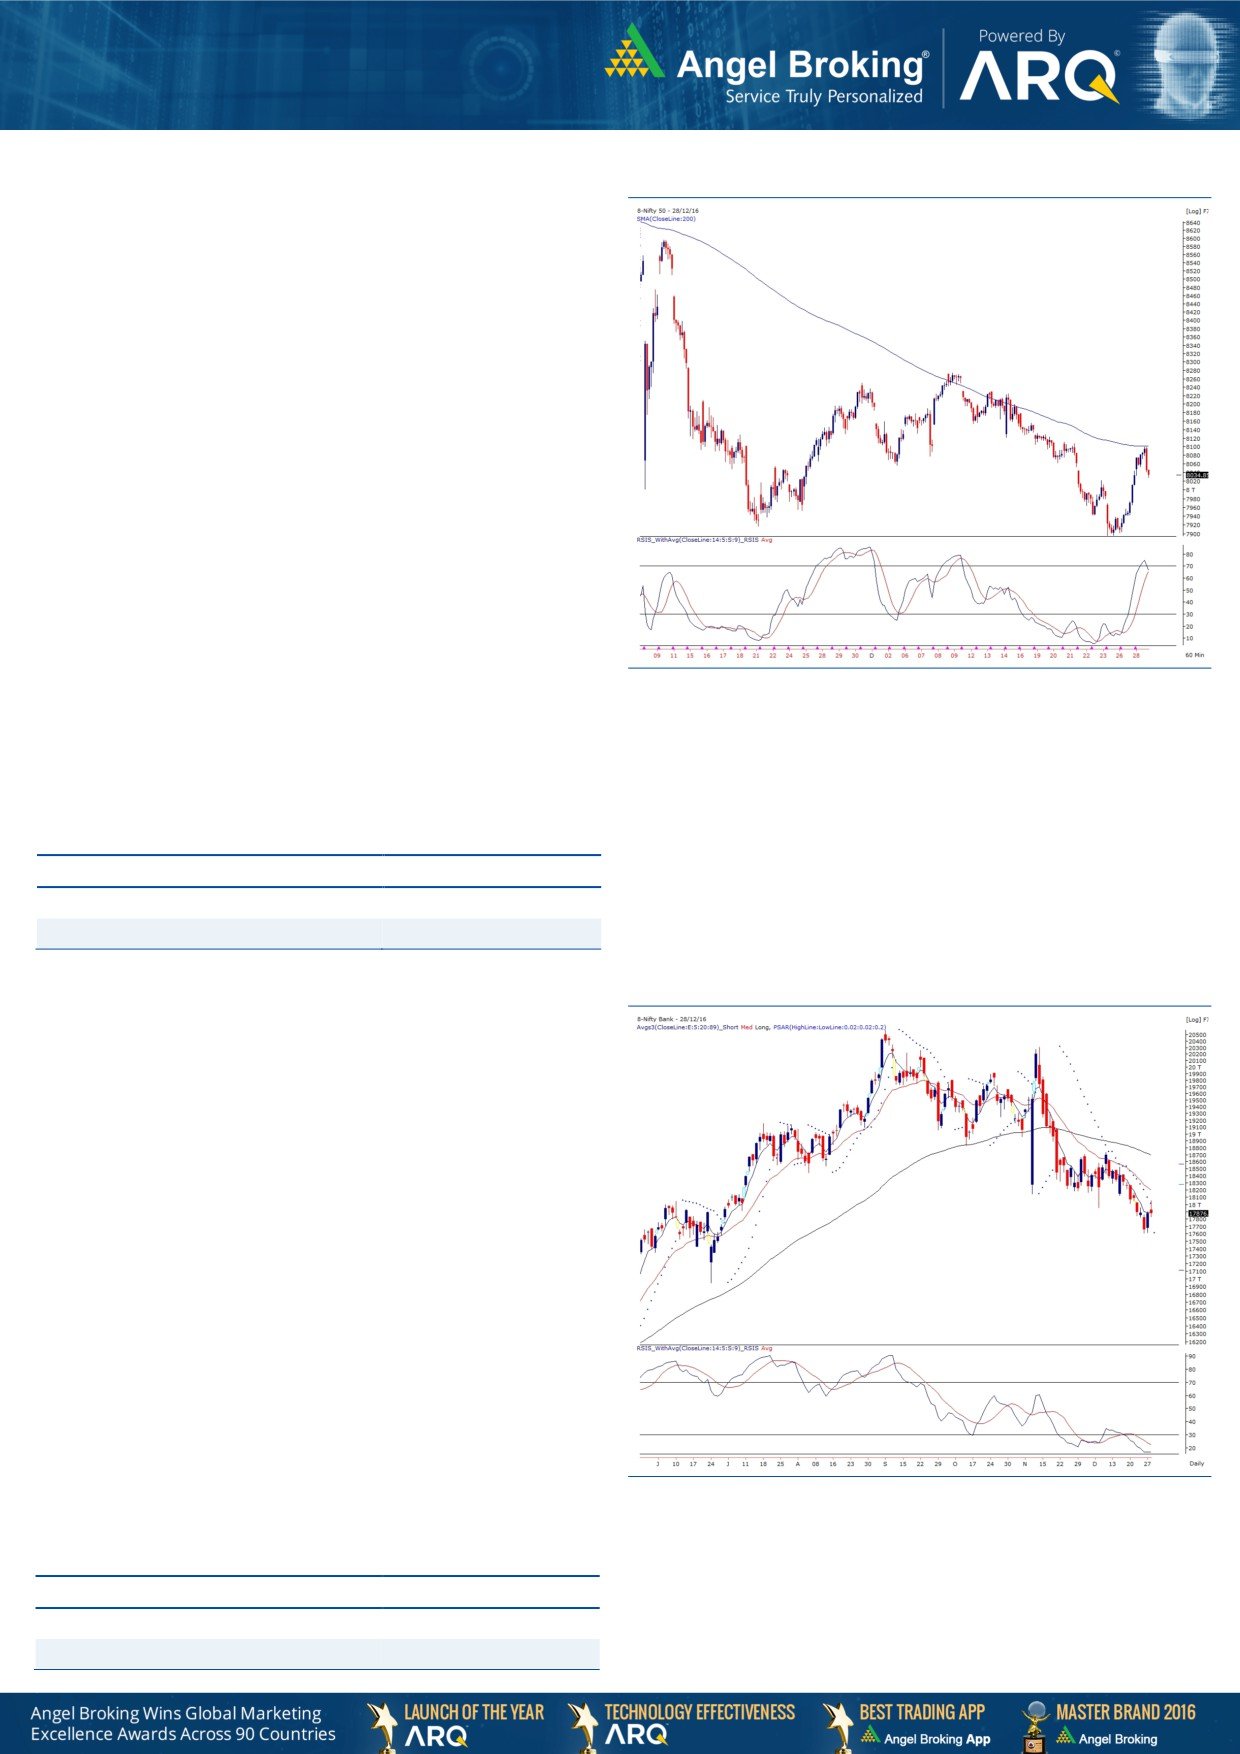
Exhibit 1: Nifty Daily Chart
A stunning intraday rally on Tuesday was followed by a positive
start with a marginal upside gap as indicated by the SGX Nifty.
Subsequently, we saw some follow up buying during the mid-
session to surpass the intraday hurdle of 8060. However, as
expected, the
‘200 SMA’ on hourly chart acted as a stiff
resistance; resulting into a sharp decline of 70 points after posting
a high of 8100.55. Eventually, the Nifty ended the volatile session
around the previous day’s close.
Yesterday’s tail end correction was slightly on cards considering
a steep rally of 200 points in such a short span and importantly,
8100 coincided with the psychological as well as technical level.
Going ahead, looking at the hourly chart structure, we interpret
this decline as a corrective move of the rally from 7893.80 to
8100.55 and thus, we expect 8022 - 8000 to provide a decent
support. On the other hand, the December F & O series is going
to expire today and hence, breaking 8100 would be a daunting
task for the market. However, having said that sooner or later we
expect the index to surpass this hurdle to extend the bounce back
rally. We advise traders to stay optimistic and continue with a
stock centric approach.
Key Levels
Support 1 - 8000
Resistance 1 - 8100
Support 2 - 7955
Resistance 2 - 8140
Nifty Bank Outlook - (17877)
Exhibit 2: Nifty Bank Daily Chart
The Nifty Bank index continued its previous session's positive
momentum and rallied higher during the day. However, a sharp
sell-off post 2 p.m. led to the index erasing the gains and the
Nifty Bank ended the session on a flat note.
The index rallied higher near our mentioned target of 18075
(yesterday's high 18059.65). The mentioned level, which was the
'89EMA' on hourly chart acted as resistance which resulted in the
last hour's corrective move. Although the indices were flat, the
overall market breadth at end of the day yesterday was positive.
Also, the Nifty Bank index has strong support around 17600
(weekly 89EMA). Thus, for short term, 17600 - 18075 can be
expected as the trading range and breakout of the range can
then lead to a directional momentum. Traders are advised to
trade on stock specific move keeping a tab on the mentioned
levels. The intraday supports for the index are placed around
17780 and 17600 whereas resistances are seen around 18075
and 18125.
Key Levels
Support 1 - 17780
Resistance 1 - 18075
Support 2 - 17600
Resistance 2 - 18125
Technical & Derivatives Report
December 29, 2016
Comments
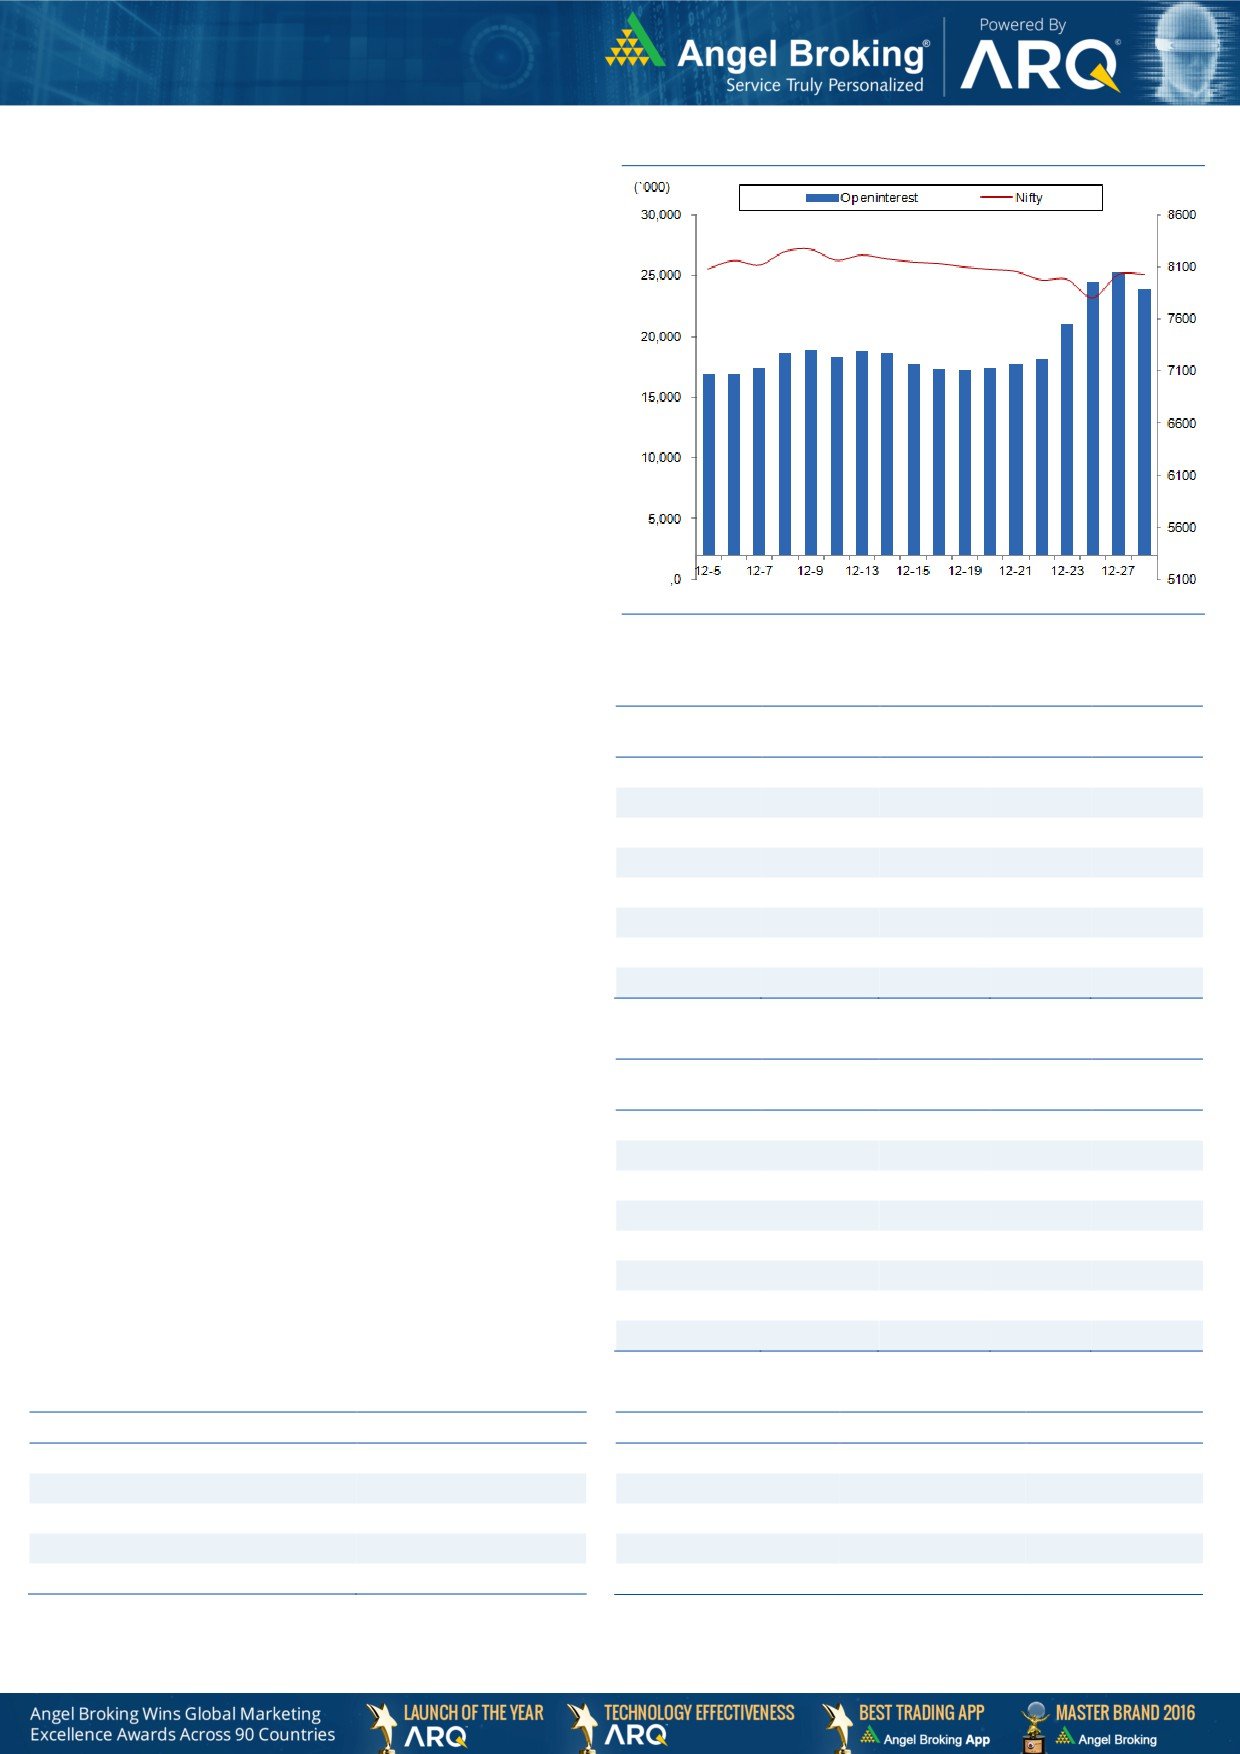
Nifty Vs OI
The Nifty futures open interest has decreased by 5.70%
BankNifty futures open interest has decreased by 2.22%
as market closed at 8034.85 levels.
The Nifty December future closed with a discount of 3.50
against the discount of
1.50 points in last trading
session. The January series closed at a premium of
21.40 points.
The Implied Volatility of at the money options has
increased from 14.45 % to 14.86%. At the same time,
the PCR-OI of Nifty has increased from 0.95 to 0.96
levels.
The total OI of the market is Rs. 2,90,813/- cr. and the
stock futures OI is Rs. 74,652/- cr.
Few of the liquid counters where we have seen high cost
of carry are GMRINFRA, IBREALEST, MINDTREE,
JUSTDIAL and SYNDIBANK.
Views
OI Gainers
FIIs continued their selling streak in cash segment; they
OI
PRICE
SCRIP
OI
PRICE
sold equities worth Rs. 527 crores. While, in index
CHG. (%)
CHG. (%)
M&MFIN
13852500
26.30
261.70
2.23
futures, they were net buyer to the tune of Rs. 1628
SOUTHBANK
65700000
13.88
19.05
-1.30
crores with fall in open interest, indicating short covering
took place in yesterday’s trading session.
TV18BRDCST
93925000
12.78
36.40
1.11
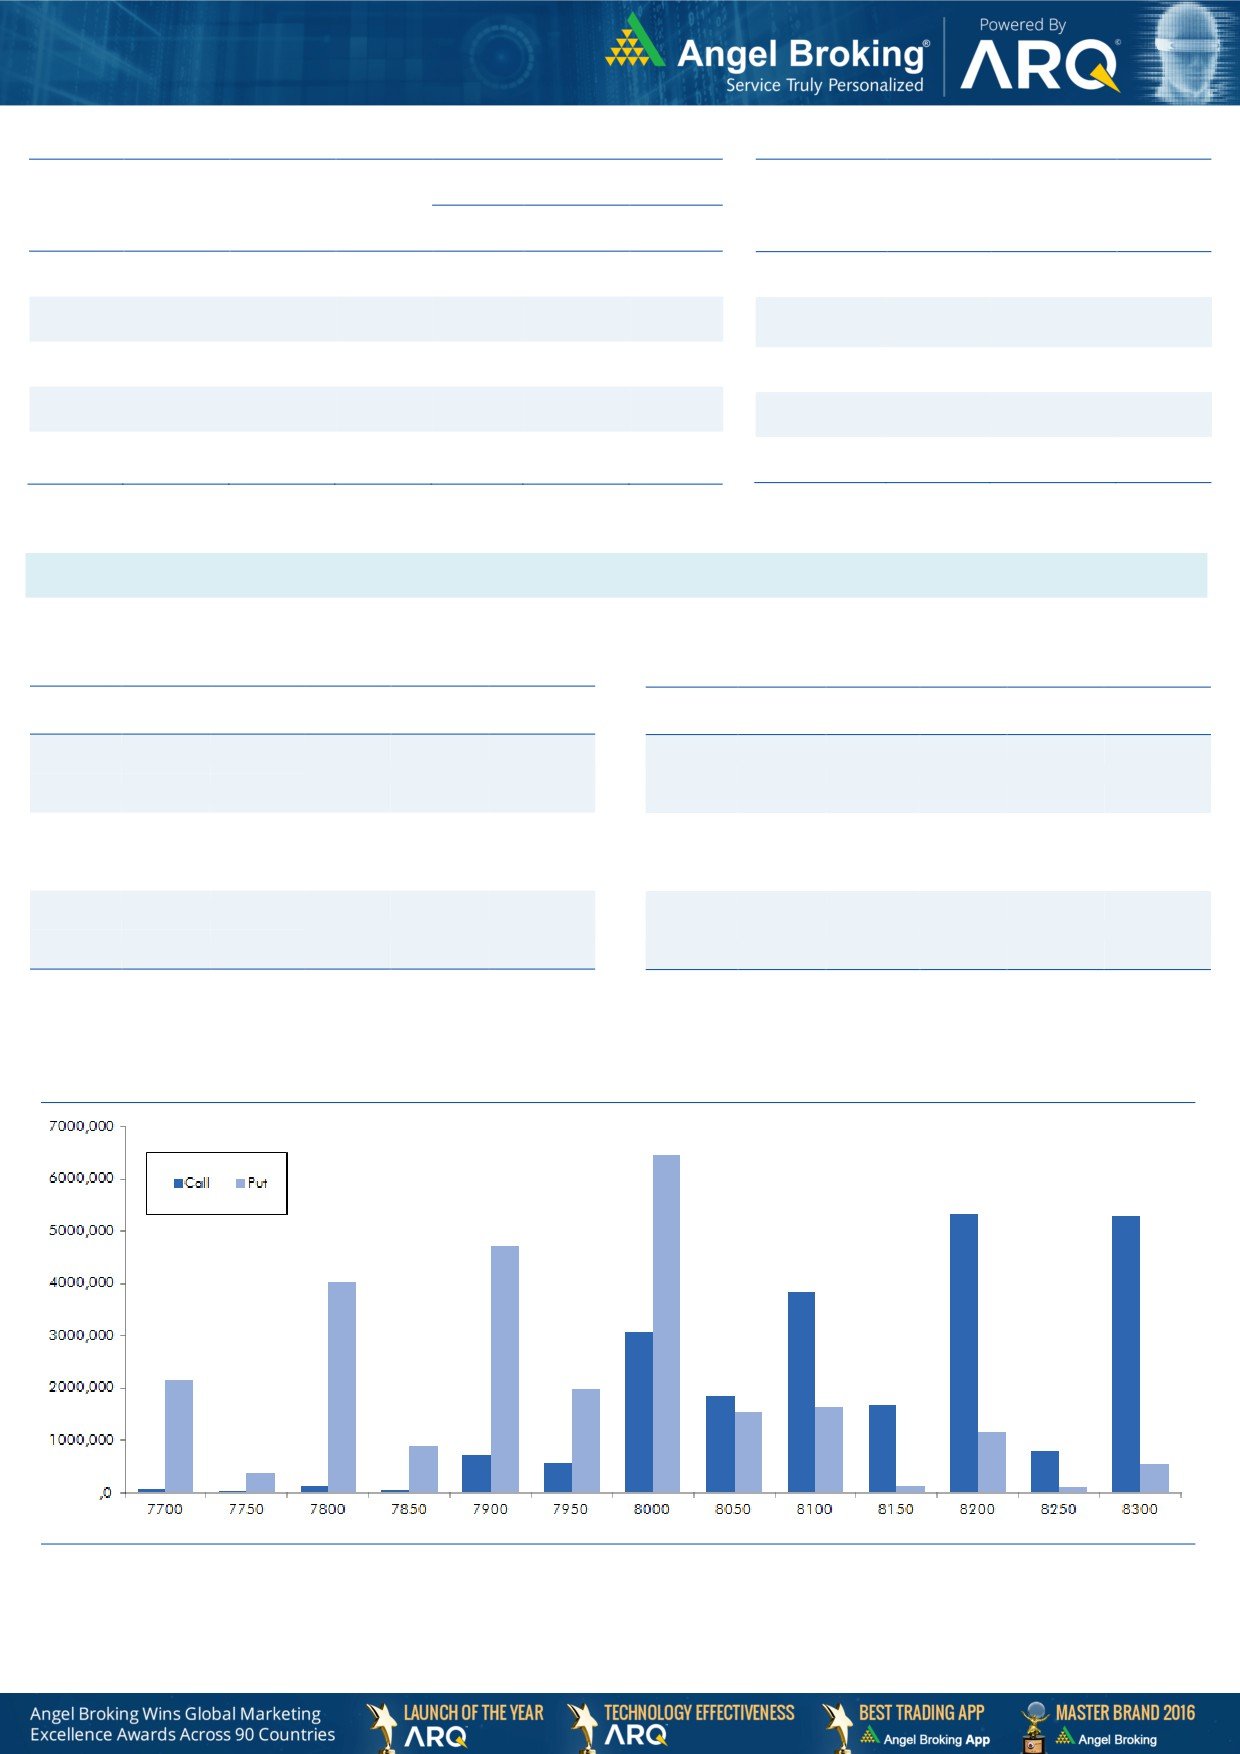
On Index Options front, FIIs bought of worth Rs. 285
CANBK
17253000
12.37
263.40
-1.51
crores with rise in OI. In call options, 8150 and 8050
ORIENTBANK
17460000
12.10
104.05
-1.14
strikes added some positions, followed by unwinding in
JINDALSTEL
48960000
9.43
67.85
1.50
7900 and 8000 strikes. On the other hand in put
FEDERALBNK
59653000
9.38
65.25
1.32
options, 8000 and 8050 strikes added good amount of
CONCOR
776000
8.76
1091.55
-0.68
positions. While, good amount of unwinding was also
visible in 7900 put option. Maximum OI in November
OI Losers
series is placed at 8200 call and 8000 put options.
OI
PRICE
SCRIP
OI
PRICE
Yesterday, we witness good amount of short covering in
CHG. (%)
CHG. (%)
Index Futures from FIIs desk. While, they continue writing
CEATLTD
1592500
-20.32
1129.55
-1.31
8050-8100 call options. Thus, looking at the options
BHARATFIN
10351000
-18.43
574.70
10.72
data, it seems Nifty may find difficult to sustain above
CUMMINSIND
618000
-14.24
812.40
1.82
these levels which may lead December series expire on a
PETRONET
4078500
-12.38
365.50
2.14
flat note. Hence, traders are suggested to avoid
JPASSOCIAT
156332000
-10.89
7.55
2.03
aggressive position for expiry and those traders who are
GODREJIND
1683000
-10.17
411.75
0.62
long in Index can rollover their positions for next series.
CROMPGREAV
23160000
-9.60
58.60
2.63
IBREALEST
32540000
-9.56
70.90
1.50
Historical Volatility
Put-Call Ratio
SCRIP
HV
SCRIP
PCR-OI
PCR-VOL
MINDTREE
38.63
NIFTY
0.96
0.91
BHARATFIN
95.48
BANKNIFTY
1.09
0.96
BATAINDIA
28.52
SUNPHARMA
0.45
0.50
COALINDIA
28.92
SBIN
0.49
0.43
APOLLOTYRE
38.32
ICICIBANK
0.46
0.38
Technical & Derivatives Report
December 29, 2016
FII Statistics for December 28, 2016
Turnover on December 28, 2016
Open Interest
No. of
Turnover
Change
Detail
Buy
Sell
Net
Instrument
Value
Change
Contracts
( in Cr. )
(%)
Contracts
(in Cr.)
(%)
INDEX
INDEX
6826.77
5198.53
1628.24
269965
16667.86
(6.96)
410011
26227.70
19.25
FUTURES
FUTURES
INDEX
INDEX
55616.81
55332.06
284.75
1207687
74212.41
1.74
8349323
532837.03
43.49
OPTIONS
OPTIONS
STOCK
22772.97
21953.93
819.03
980748
57843.76
0.28
STOCK
FUTURES
1188595
72441.62
15.38
FUTURES
STOCK
STOCK
3720.08
3541.84
178.25
95262
5893.50
(0.52)
376833
25536.68
2.85
OPTIONS
OPTIONS
TOTAL
88936.63
86026.36
2910.27
2553662
154617.53
0.10
TOTAL
10324762
657043.03
36.61
Nifty Spot = 8034.85
Lot Size = 75
Bull-Call Spreads
Bear-Put Spreads
Action
Strike
Price
Risk
Reward
BEP
Action
Strike
Price
Risk
Reward
BEP
Buy
8000
42.55
Buy
8000
16.90
38.30
61.70
8038.30
13.45
86.55
7986.55
Sell
8100
4.25
Sell
7900
3.45
Buy
8000
42.55
Buy
8000
16.90
41.80
158.20
8041.80
15.80
184.20
7984.20
Sell
8200
0.75
Sell
7800
1.10
Buy
8100
4.25
Buy
7900
3.45
3.50
96.50
8103.50
2.35
97.65
7897.65
Sell
8200
0.75
Sell
7800
1.10
Note: Above mentioned Bullish or Bearish Spreads in Nifty (December Series) are given as an information and not as a recommendation.
Nifty Put-Call Analysis
Technical & Derivatives Report
December 29, 2016
Daily Pivot Levels for Nifty Constituents
Scrips
S2
S1
PIVOT
R1
R2
ACC
1,273
1,284
1,294
1,305
1,316
ADANIPORTS
264
266
269
271
274
AMBUJACEM
198
200
202
204
206
ASIANPAINT
858
867
878
887
899
AUROPHARMA
632
642
651
661
670
AXISBANK
432
436
442
446
452
BAJAJ-AUTO
2,606
2,620
2,637
2,650
2,668
BANKBARODA
147
149
151
152
154
BHEL
118
119
120
121
122
BPCL
606
611
615
620
624
BHARTIARTL
294
297
300
303
306
INFRATEL
326
332
339
345
352
BOSCH
19,680
19,926
20,206
20,452
20,732
CIPLA
554
558
565
569
576
COALINDIA
286
290
293
298
301
DRREDDY
2,999
3,034
3,073
3,108
3,147
EICHERMOT
20,602
20,743
20,872
21,013
21,142
GAIL
416
420
424
428
431
GRASIM
791
801
816
826
840
HCLTECH
796
802
810
815
823
HDFCBANK
1,174
1,180
1,188
1,194
1,202
HDFC
1,211
1,225
1,236
1,250
1,261
HEROMOTOCO
2,962
2,982
3,016
3,036
3,070
HINDALCO
149
151
155
157
160
HINDUNILVR
797
804
813
819
828
ICICIBANK
249
250
253
254
256
IDEA
69
70
71
72
73
INDUSINDBK
1,042
1,062
1,080
1,100
1,118
INFY
986
992
1,001
1,007
1,016
ITC
231
233
235
237
239
KOTAKBANK
704
708
714
718
723
LT
1,336
1,343
1,353
1,360
1,370
LUPIN
1,435
1,445
1,457
1,466
1,478
M&M
1,161
1,168
1,176
1,183
1,191
MARUTI
5,184
5,208
5,243
5,266
5,301
NTPC
159
160
161
162
163
ONGC
188
189
190
192
193
POWERGRID
177
178
181
182
185
RELIANCE
1,033
1,041
1,055
1,064
1,078
SBIN
244
246
249
251
254
SUNPHARMA
613
617
623
627
633
TCS
2,275
2,294
2,322
2,341
2,369
TATAMTRDVR
287
289
293
295
299
TATAMOTORS
458
461
465
467
471
TATAPOWER
73
73
74
75
75
TATASTEEL
382
385
390
393
397
TECHM
465
470
473
478
481
ULTRACEMCO
3,089
3,124
3,162
3,197
3,235
WIPRO
460
464
470
475
480
YESBANK
1,092
1,103
1,121
1,131
1,149
ZEEL
431
437
443
449
454
Technical & Derivatives Report
December 29, 2016
Research Team Tel: 022 - 39357800
For Technical Queries
For Derivatives Queries
DISCLAIMER
Angel Broking Private Limited (hereinafter referred to as “Angel”) is a registered Member of National Stock Exchange of India Limited,
Bombay Stock Exchange Limited and Metropolitan Stock Exchange Limited. It is also registered as a Depository Participant with CDSL
and Portfolio Manager with SEBI. It also has registration with AMFI as a Mutual Fund Distributor. Angel Broking Private Limited is a
registered entity with SEBI for Research Analyst in terms of SEBI (Research Analyst) Regulations, 2014 vide registration number
INH000000164. Angel or its associates has not been debarred/ suspended by SEBI or any other regulatory authority for accessing
/dealing in securities Market. Angel or its associates/analyst has not received any compensation / managed or co-managed public
offering of securities of the company covered by Analyst during the past twelve months.
This document is solely for the personal information of the recipient, and must not be singularly used as the basis of any investment
decision. Nothing in this document should be construed as investment or financial advice. Each recipient of this document should
make such investigations as they deem necessary to arrive at an independent evaluation of an investment in the securities of the
companies referred to in this document (including the merits and risks involved), and should consult their own advisors to determine
the merits and risks of such an investment.
Reports based on technical and derivative analysis center on studying charts of a stock's price movement, outstanding positions and
trading volume, as opposed to focusing on a company's fundamentals and, as such, may not match with a report on a company's
fundamentals. Investors are advised to refer the Fundamental and Technical Research Reports available on our website to evaluate the
contrary view, if any.
The information in this document has been printed on the basis of publicly available information, internal data and other reliable
sources believed to be true, but we do not represent that it is accurate or complete and it should not be relied on as such, as this
document is for general guidance only. Angel Broking Pvt. Limited or any of its affiliates/ group companies shall not be in any way
responsible for any loss or damage that may arise to any person from any inadvertent error in the information contained in this report.
Angel Broking Pvt. Limited has not independently verified all the information contained within this document. Accordingly, we cannot
testify, nor make any representation or warranty, express or implied, to the accuracy, contents or data contained within this document.
While Angel Broking Pvt. Limited endeavors to update on a reasonable basis the information discussed in this material, there may be
regulatory, compliance, or other reasons that prevent us from doing so.
This document is being supplied to you solely for your information, and its contents, information or data may not be reproduced,
redistributed or passed on, directly or indirectly.
Neither Angel Broking Pvt. Limited, nor its directors, employees or affiliates shall be liable for any loss or damage that may arise from
or in connection with the use of this information.