Technical & Derivatives Report
November 29, 2016
Sensex (26350) / Nifty (8127)
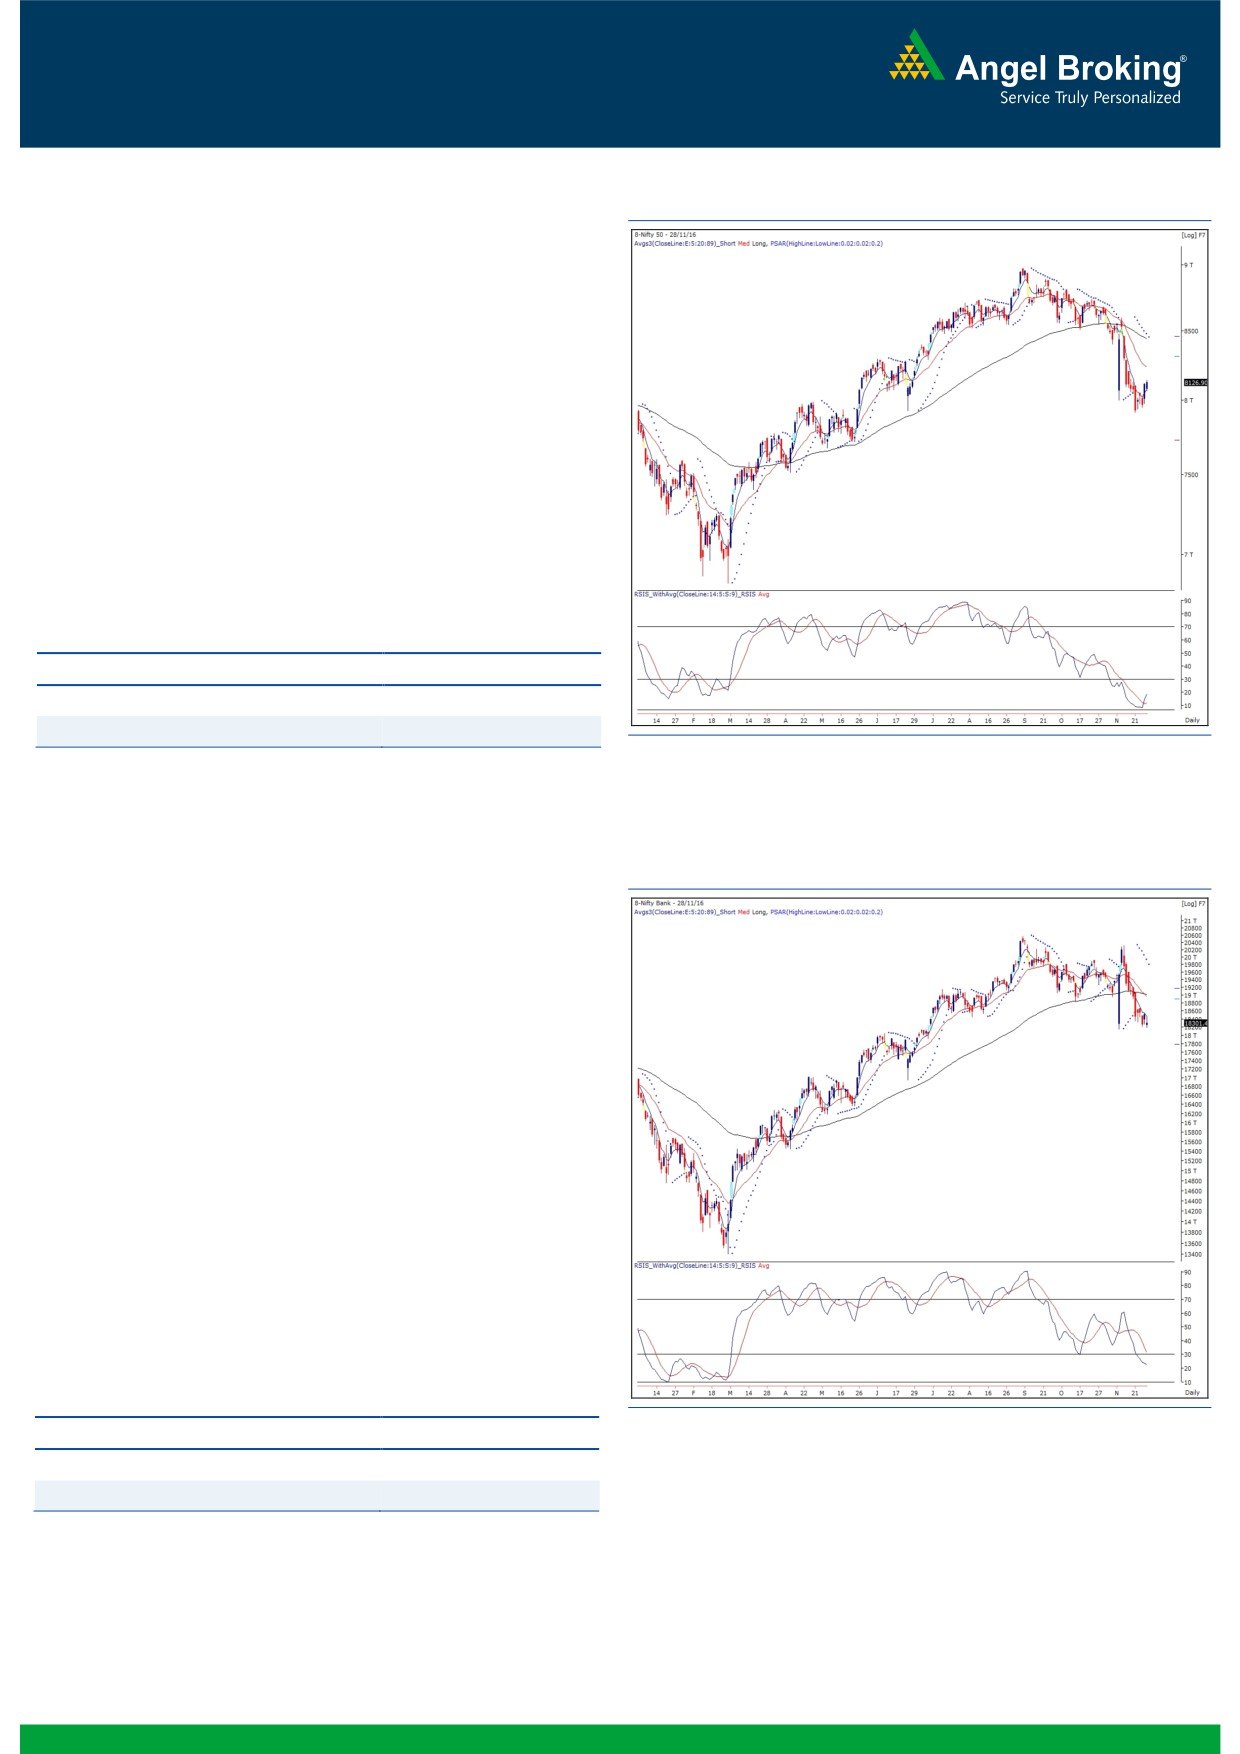
Exhibit 1: Nifty Daily Chart
A strong opening of new derivatives (December) series on Friday
was followed by a weak start for the week on the back of RBI’s
announcement on CRR over the weekend. However, other
heavyweight pockets like, the IT and FMCG held out well to pull
the index back above 8100 to end the session with marginal
gains.
Although, market remained in pressure for quite some time
during the session, the individual stocks had shown good traction.
This indicates that if the banking conglomerates stabilize in the
forthcoming session, we may expect the Nifty trading in a positive
territory. We continue with our optimistic view on the market and
reiterate the possibility of testing 8250 - 8300 levels. On the
flipside, 8080 - 8020 would now be seen an immediate support
levels.
Key Levels
Support 1 - 8080
Resistance 1 - 8250
Support 2 - 8020
Resistance 2 - 8300
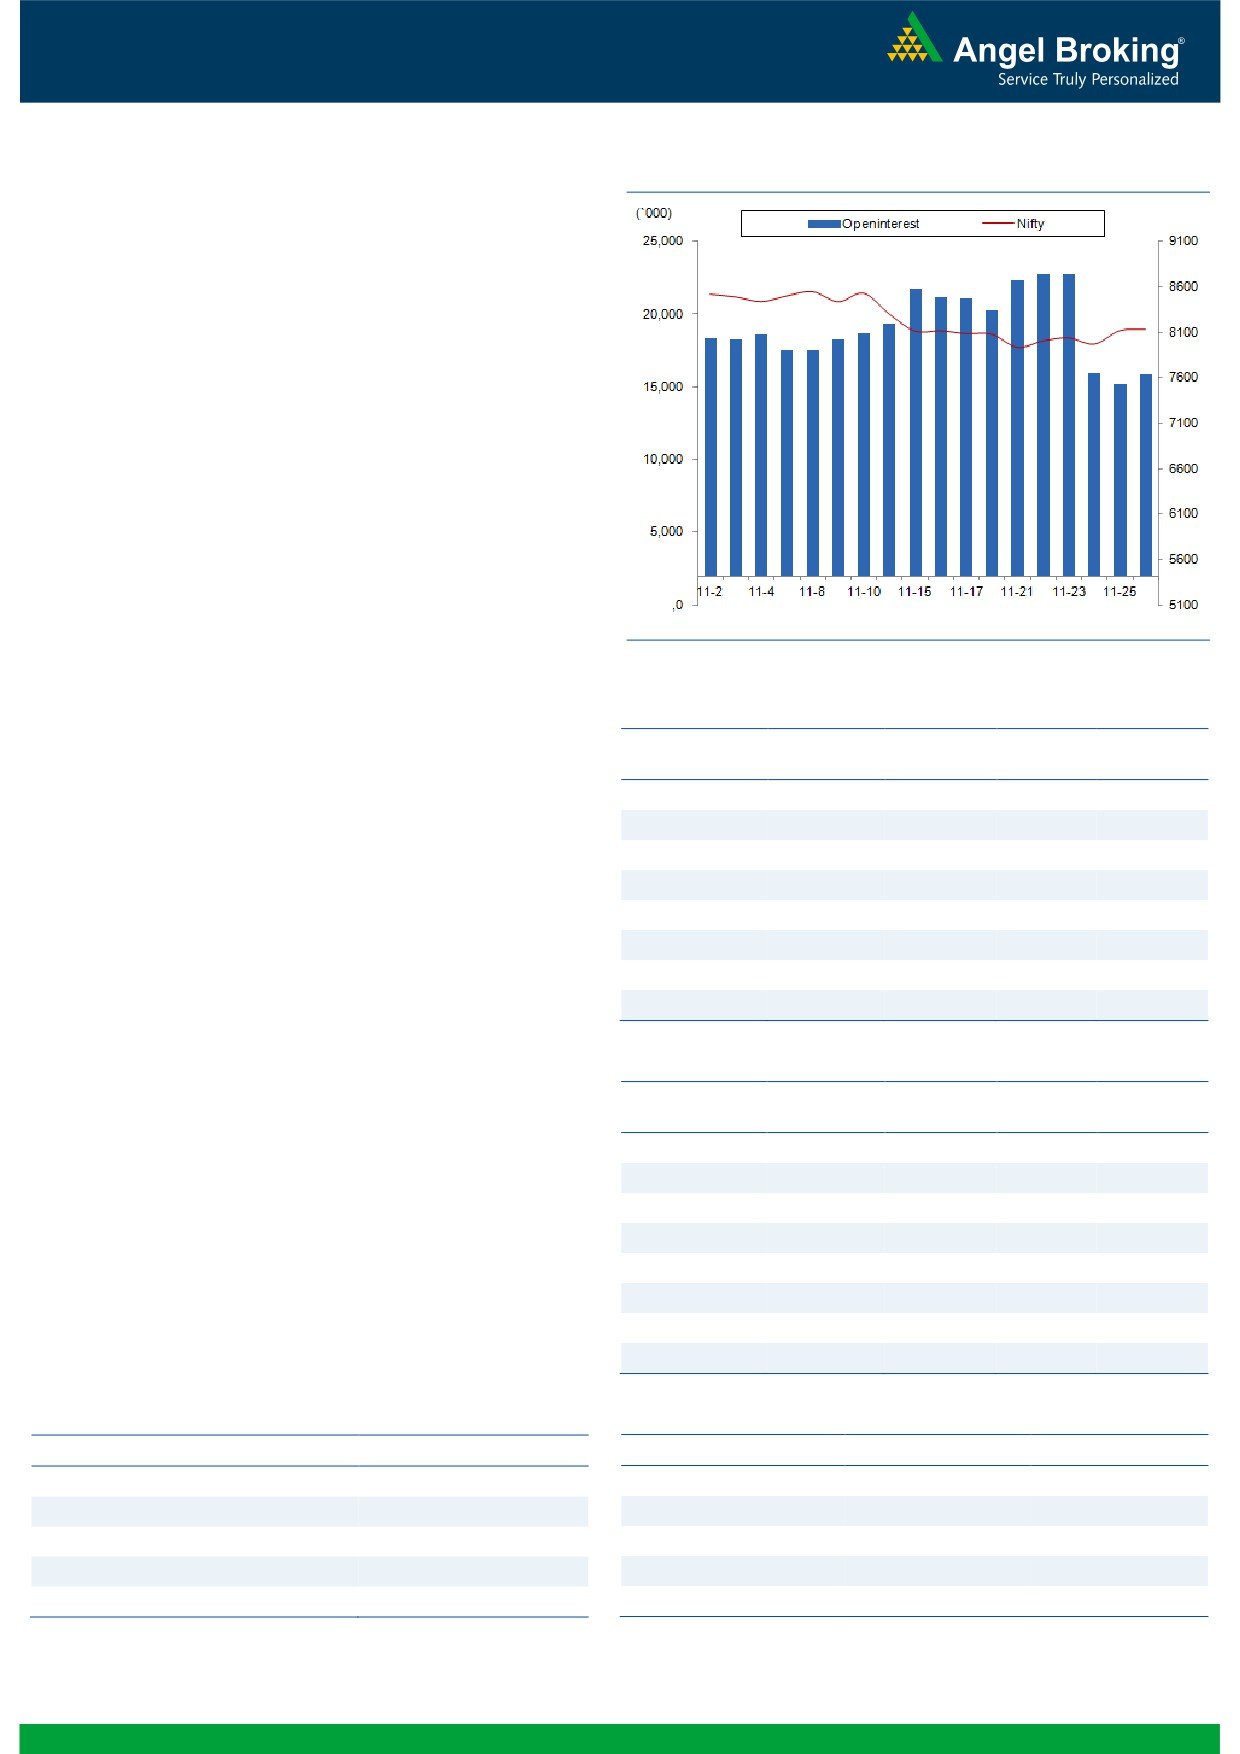
Nifty Bank Outlook - (18301)
Exhibit 2: Nifty Bank Daily Chart
In yesterday's trading session, the Nifty Bank opened on a
negative note. The index then consolidated in a narrow range
throughout the session and ended the day with loss of 1.11
percent over its previous session's close.
The Nifty Bank index has been underperforming the broader
benchmark index since last few sessions. If we observe the daily
chart, the index has been unable to close above the '5 DEMA'
since last 10 trading sessions. Hence, for any pullback move, it is
necessary for the index to sustain above the mentioned average
which is placed around 18465. Although the downside for the
index seems to be limited in near term, traders are advised to
keep a tab on the above-mentioned level for anticipating a
pullback move. Till then, we continue to advise traders to remain
light on positions and trade on stock specific moves. The intraday
support for the Nifty bank index are placed around 18143 and
18050 whereas resistances are seen around 18465 and 18670.
Key Levels
Support 1 - 18143
Resistance 1 - 18465
Support 2 - 18050
Resistance 2 - 18670
1
Technical & Derivatives Report
November 29, 2016
Comments
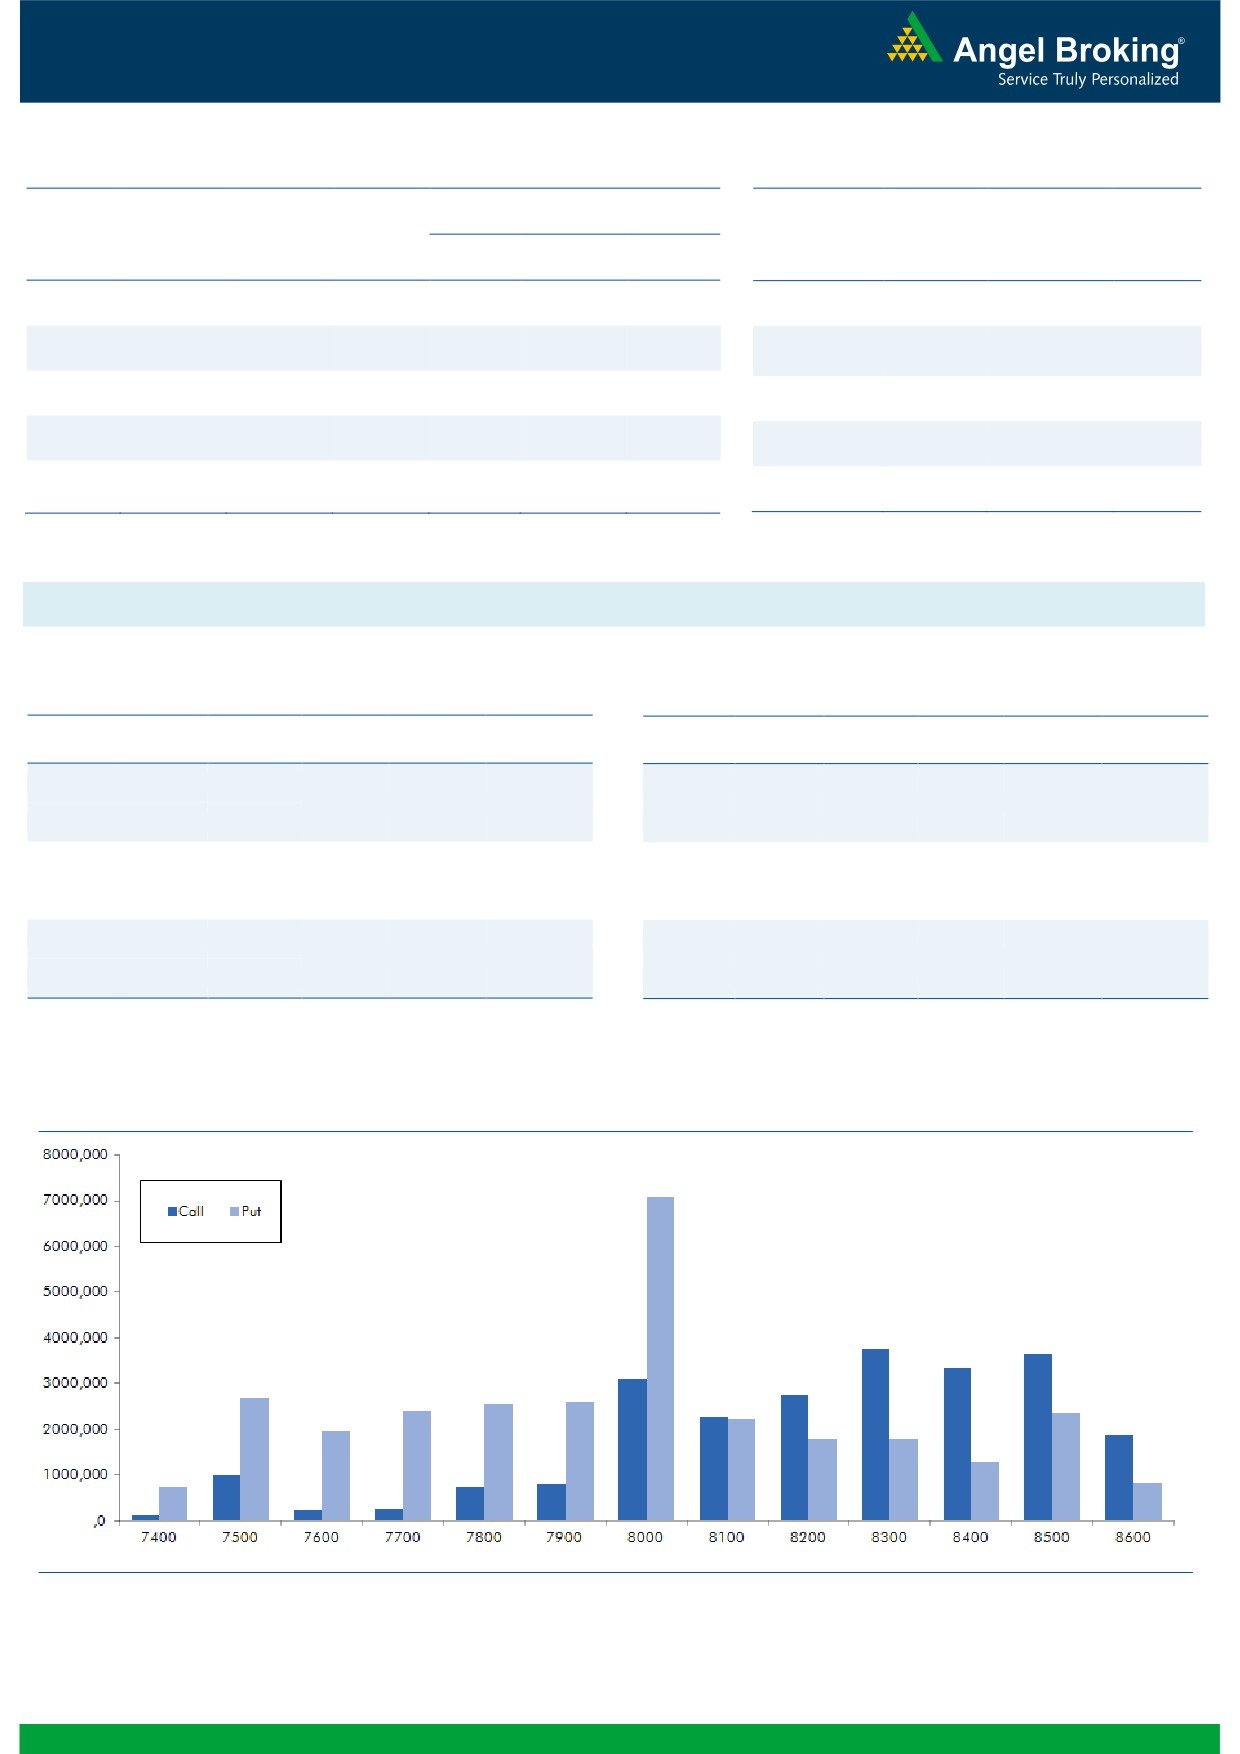
Nifty Vs OI
The Nifty futures open interest has increased by 4.65%
BankNifty futures open interest has decreased by 0.13%
as market closed at 8126.90 levels.
The Nifty December future closed with a premium of
23.70 against the premium of 12.05 points in last
trading session. The January series closed at a premium
of 50.00 points.
The Implied Volatility of at the money options has
increased from 14.74% to 15.36%. At the same time, the
PCR-OI of Nifty has increased from 1.00 to 1.01 levels.
The total OI of the market is Rs. 2,11,035/- cr. and the
stock futures OI is Rs. 64,199/- cr.
Few of the liquid counters where we have seen high cost
of carry are GMRINFRA, ADANIENT, ANDHRABANK,
JPASSOCIAT and HEXAWARE.
Views
OI Gainers
FIIs continue to sell in cash market segment to the tune of
OI
PRICE
SCRIP
OI
PRICE
CHG. (%)
CHG. (%)
Rs.
1436 crores. While, in index futures, they sold
BEL
1511100
23.82
1393.45
6.25
marginally with good amount of rise in open interest,
ICIL
3771500
20.42
156.55
9.78
indicating blend of both long and short formation in
NHPC
22221000
13.99
28.00
2.56
previous trading session.
www.angelbroking.com
MARUTI
2955450
11.17
4919.40
0.79
In Index options segment, FIIs were net buyers of Rs.
CEATLTD
936600
11.13
1197.70
2.72
1622 crores with rise in open interest. We hardly saw any
ENGINERSIN
5113500
10.02
294.05
4.72
meaningful build-up in Nifty options. However, 8300 call
HINDPETRO
18755100
9.45
479.85
4.15
and 8100 put options were comparatively active and
VEDL
46952000
9.01
228.65
2.90
they also added some positions. Highest OI in December
series has been shifted from 8500 to 8300 call option
and of put option remains intact at 8000 strike.
OI Losers
We continue witnessing mixed positions in Index Futures
OI
PRICE
SCRIP
OI
PRICE
CHG. (%)
CHG. (%)
by FIIs. While, in Stock Futures they continue their buying
CANBK
6732000
-7.31
310.35
-0.53
streak. In BankNifty options, we are seeing huge amount
PIDILITIND
1232000
-5.59
626.70
-0.37
of build-up in 17000 and 17500 put option. Large cap
TATAELXSI
1653600
-4.19
1266.20
1.90
banking counters like YESBANK, SBIN, BANKBARODA
DHFL
16251000
-3.85
241.65
1.21
and ICICIBANK added fresh short positions in yesterday’s
KPIT
3852000
-3.02
130.00
-1.07
trading session. Thus, traders should remain cautious as
TATACHEM
4924500
-2.55
477.40
2.24
BankNifty may underperform market due to which Nifty
may find difficult to bounce back to higher levels.
LICHSGFIN
6048900
-2.52
540.80
0.72
CESC
1904100
-2.42
587.15
1.75
Historical Volatility
Put-Call Ratio
SCRIP
HV
SCRIP
PCR-OI
PCR-VOL
ADANIPOWER
68.18
NIFTY
1.01
0.87
BHARTIARTL
40.67
BANKNIFTY
0.78
0.75
BEL
43.37
SBIN
0.59
0.49
TATAPOWER
39.29
RELIANCE
0.59
0.40
HINDPETRO
41.62
ICICIBANK
0.46
0.42
2
Technical & Derivatives Report
November 29, 2016
FII Statistics for November 28, 2016
Turnover on November 28, 2016
Open Interest
No. of
Turnover
Change
Detail
Buy
Sell
Net
Instrument
Value
Change
Contracts
( in Cr. )
(%)
Contracts
(in Cr.)
(%)
INDEX
INDEX
2355.80
2478.69
(122.89)
155120
9758.08
8.87
214863
14230.93
-10.61
FUTURES
FUTURES
INDEX
INDEX
25943.12
24320.77
1622.35
867427
53758.24
8.00
2313751
157974.71
1.94
OPTIONS
OPTIONS
STOCK
6463.94
5711.13
752.80
812684
49119.18
0.91
STOCK
FUTURES
441315
29433.09
-8.74
FUTURES
STOCK
STOCK
2461.67
2439.63
22.04
36670
2320.78
34.13
OPTIONS
211613
14702.27
-3.43
OPTIONS
TOTAL
37224.52
34950.23
2274.30
1871901
114956.28
5.26
TOTAL
3181542
216340.99
-0.93
Nifty Spot = 8126.90
Lot Size = 75
Bull-Call Spreads
Bear-Put Spreads
Action
Strike
Price
Risk
Reward
BEP
Action
Strike
Price
Risk
Reward
BEP
Buy
8200
117.65
Buy
8100
127.95
44.65
55.35
8244.65
32.40
67.60
8067.60
Sell
8300
73.00
Sell
8000
95.55
Buy
8200
117.65
Buy
8100
127.95
75.00
125.00
8275.00
57.65
142.35
8042.35
Sell
8400
42.65
Sell
7900
70.30
Buy
8300
73.00
Buy
8000
95.55
30.35
69.65
8330.35
25.25
74.75
7974.75
Sell
8400
42.65
Sell
7900
70.30
Note: Above mentioned Bullish or Bearish Spreads in Nifty (December Series) are given as an information and not as a recommendation.
Nifty Put-Call Analysis
3
Technical & Derivatives Report
November 29, 2016
Daily Pivot Levels for Nifty Constituents
Scrips
S2
S1
PIVOT
R1
R2
ACC
1,295
1,306
1,317
1,328
1,339
ADANIPORTS
260
266
270
277
281
AMBUJACEM
198
201
203
207
209
ASIANPAINT
911
924
946
959
981
AUROPHARMA
724
730
739
746
755
AXISBANK
454
464
471
480
487
BAJAJ-AUTO
2,585
2,611
2,638
2,664
2,691
BANKBARODA
159
161
163
165
167
BHEL
125
126
128
129
130
BPCL
628
640
652
663
675
BHARTIARTL
293
306
314
326
334
INFRATEL
350
357
362
368
373
BOSCH
18,676
19,042
19,266
19,632
19,856
CIPLA
563
567
572
576
581
COALINDIA
301
303
304
306
308
DRREDDY
3,145
3,159
3,175
3,189
3,204
EICHERMOT
19,638
19,926
20,288
20,576
20,938
GAIL
408
413
418
423
429
GRASIM
807
824
836
853
865
HCLTECH
782
794
803
815
823
HDFCBANK
1,166
1,175
1,187
1,196
1,208
HDFC
1,226
1,236
1,244
1,254
1,262
HEROMOTOCO
3,014
3,060
3,091
3,137
3,168
HINDALCO
175
177
180
181
184
HINDUNILVR
823
831
836
844
849
ICICIBANK
252
254
255
257
258
IDEA
72
74
75
77
78
INDUSINDBK
1,029
1,040
1,057
1,067
1,084
INFY
965
972
978
985
991
ITC
225
229
232
236
239
KOTAKBANK
730
740
746
757
763
LT
1,338
1,347
1,360
1,369
1,382
LUPIN
1,470
1,490
1,504
1,523
1,538
M&M
1,140
1,151
1,167
1,179
1,195
MARUTI
4,800
4,847
4,880
4,927
4,960
NTPC
158
161
163
166
168
ONGC
270
277
281
288
292
POWERGRID
183
187
191
195
199
RELIANCE
974
980
990
997
1,007
SBIN
243
248
253
258
263
SUNPHARMA
705
710
715
720
725
TCS
2,217
2,250
2,285
2,317
2,352
TATAMTRDVR
285
289
292
296
299
TATAMOTORS
446
450
455
460
465
TATAPOWER
69
71
72
74
75
TATASTEEL
398
402
407
411
416
TECHM
476
483
489
496
503
ULTRACEMCO
3,426
3,466
3,515
3,554
3,603
WIPRO
449
455
461
467
474
YESBANK
1,111
1,130
1,153
1,172
1,195
ZEEL
431
444
453
467
476
4
Technical & Derivatives Report
November 29, 2016
Research Team Tel: 022 - 39357800
For Technical Queries
For Derivatives Queries
DISCLAIMER
Angel Broking Private Limited (hereinafter referred to as “Angel”) is a registered Member of National Stock Exchange of India Limited,
Bombay Stock Exchange Limited and Metropolitan Stock Exchange Limited. It is also registered as a Depository Participant with CDSL
and Portfolio Manager with SEBI. It also has registration with AMFI as a Mutual Fund Distributor. Angel Broking Private Limited is a
registered entity with SEBI for Research Analyst in terms of SEBI (Research Analyst) Regulations, 2014 vide registration number
INH000000164. Angel or its associates has not been debarred/ suspended by SEBI or any other regulatory authority for accessing
/dealing in securities Market. Angel or its associates/analyst has not received any compensation / managed or co-managed public
offering of securities of the company covered by Analyst during the past twelve months.
This document is solely for the personal information of the recipient, and must not be singularly used as the basis of any investment
decision. Nothing in this document should be construed as investment or financial advice. Each recipient of this document should
make such investigations as they deem necessary to arrive at an independent evaluation of an investment in the securities of the
companies referred to in this document (including the merits and risks involved), and should consult their own advisors to determine
the merits and risks of such an investment.
Reports based on technical and derivative analysis center on studying charts of a stock's price movement, outstanding positions and
trading volume, as opposed to focusing on a company's fundamentals and, as such, may not match with a report on a company's
fundamentals. Investors are advised to refer the Fundamental and Technical Research Reports available on our website to evaluate the
contrary view, if any.
The information in this document has been printed on the basis of publicly available information, internal data and other reliable
sources believed to be true, but we do not represent that it is accurate or complete and it should not be relied on as such, as this
document is for general guidance only. Angel Broking Pvt. Limited or any of its affiliates/ group companies shall not be in any way
responsible for any loss or damage that may arise to any person from any inadvertent error in the information contained in this report.
Angel Broking Pvt. Limited has not independently verified all the information contained within this document. Accordingly, we cannot
testify, nor make any representation or warranty, express or implied, to the accuracy, contents or data contained within this document.
While Angel Broking Pvt. Limited endeavors to update on a reasonable basis the information discussed in this material, there may be
regulatory, compliance, or other reasons that prevent us from doing so.
This document is being supplied to you solely for your information, and its contents, information or data may not be reproduced,
redistributed or passed on, directly or indirectly.
Neither Angel Broking Pvt. Limited, nor its directors, employees or affiliates shall be liable for any loss or damage that may arise from
or in connection with the use of this information.
5