Technical & Derivatives Report
September 29, 2016
Sensex (28293) / Nifty (8745)
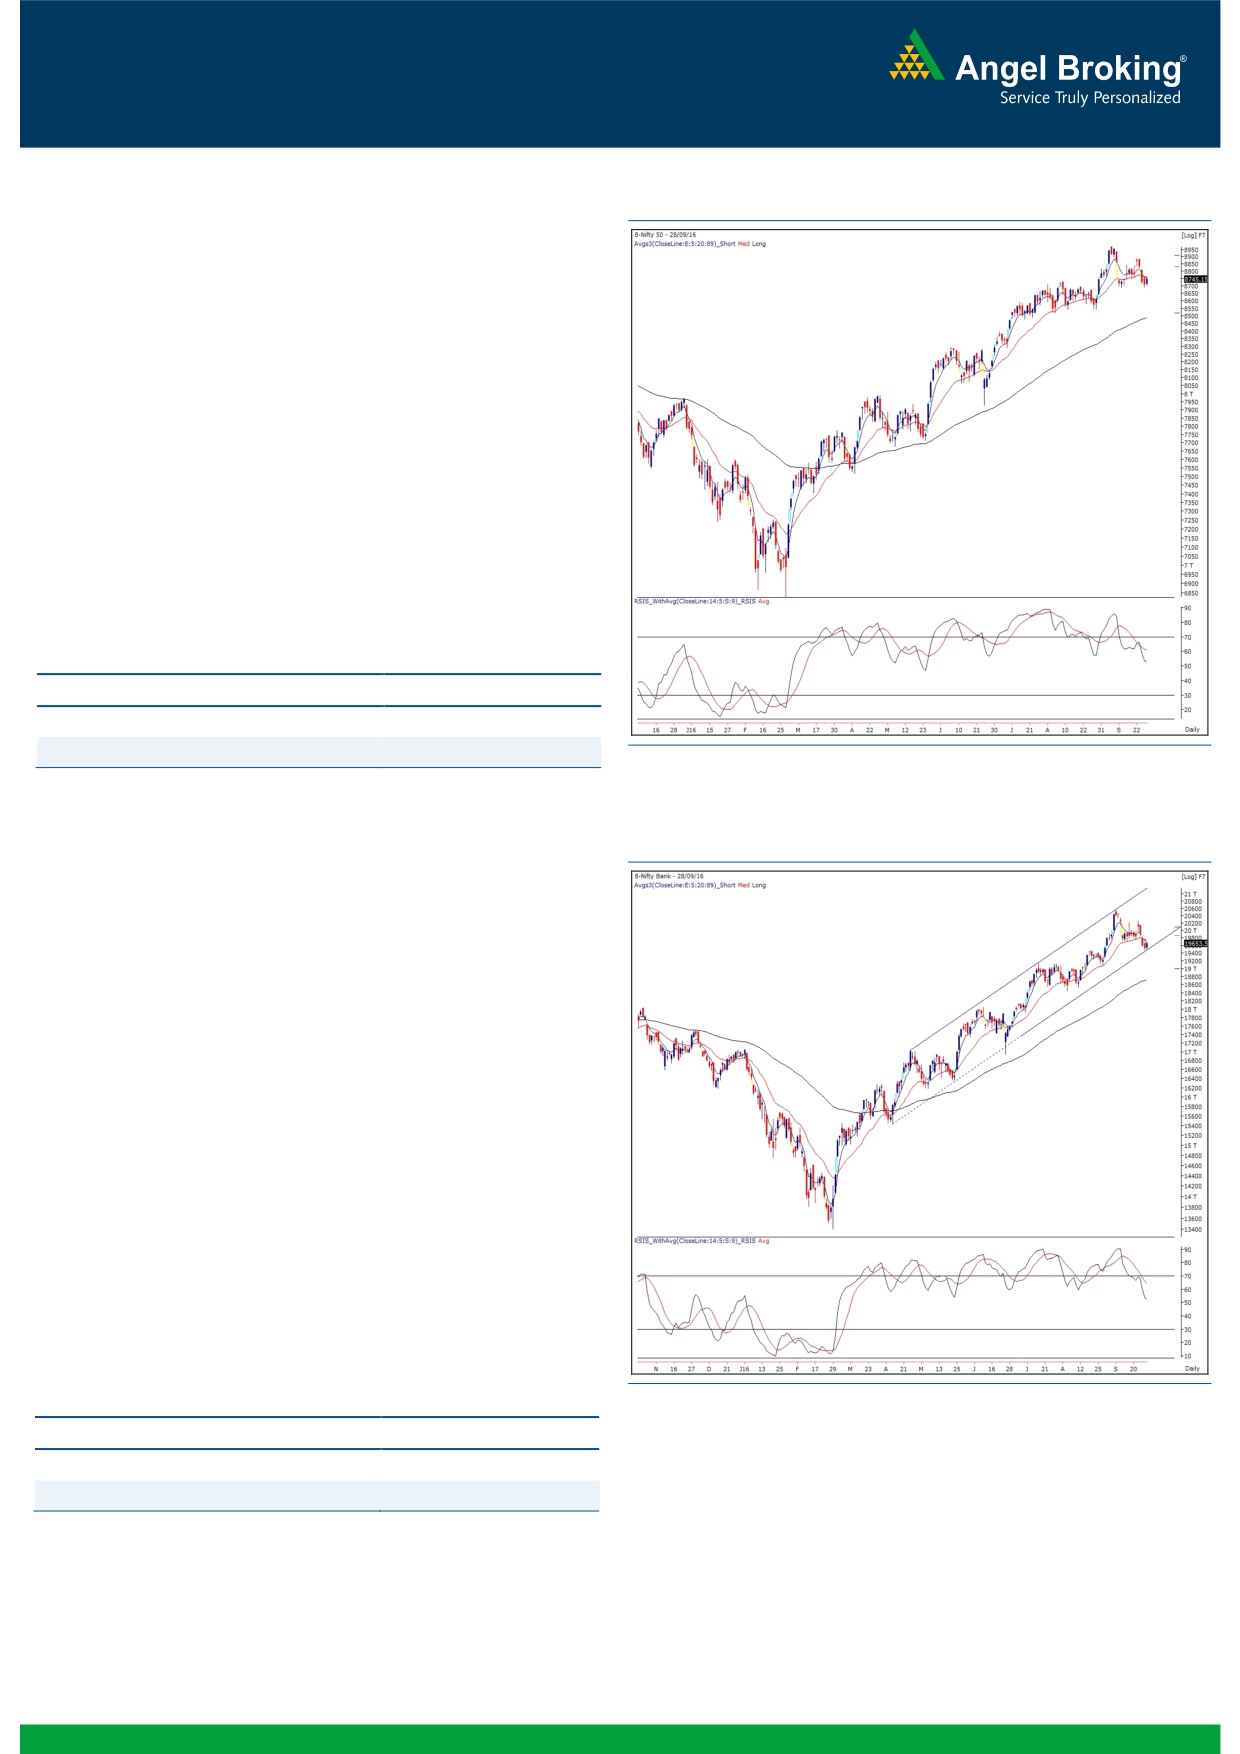
Exhibit 1: Nifty Daily Chart
Yesterday's session opened on a flat note owing to mixed global
cues. Subsequently, we witnessed some consolidation in the
market followed by a decent up move in the second half. As a
result, the Nifty managed to close with nearly half a percent
gains.
It seems that 8700 is acting as sheet anchor for the Nifty at least
for the current expiry. But, we do not want get carried by this
move, in fact would interpret this bounce as a selling opportunity.
For the coming session, 8790 - 8820 would act as a resistance
zone and we maintain our view that it’s a matter of time that the
Nifty would slide below the recent support level of 8688 to test
8640 - 8600 levels. Until we do not see any clear reversal sign,
our strategy would remain sell on rise in the market.
Key Levels
Support 1 - 8688
Resistance 1 - 8790
Support 2 - 8640
Resistance 2 - 8820
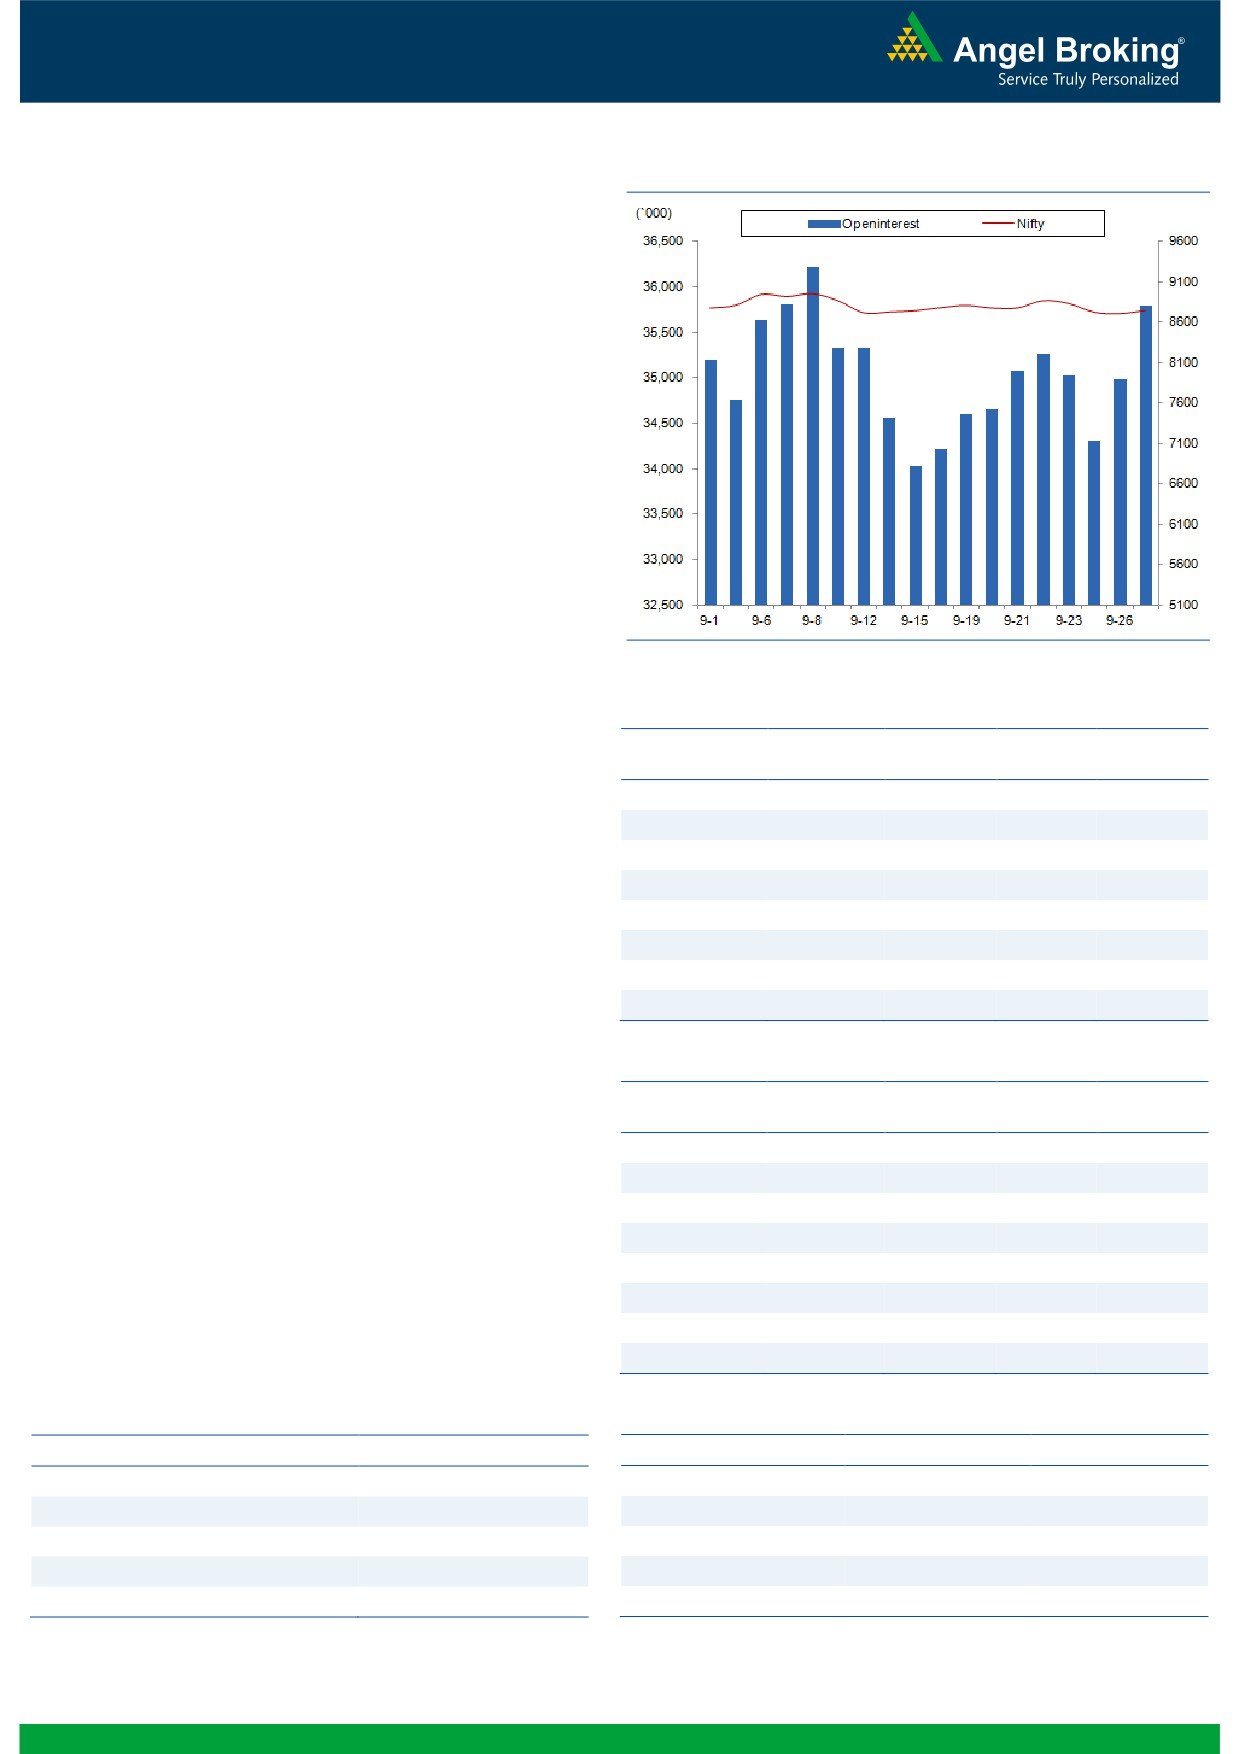
Exhibit 2: Nifty Bank Daily Chart
Nifty Bank Outlook - (19654)
Yesterday, the Nifty Bank index opened on a flat note and started
moving higher from initial trades. The banking index continued to
make higher highs and eventually ended the session with gains of
0.69 percent over its previous close. The PSU Banking space has
shown tremendous outperformance as the Nifty PSU Bank index
posted the gains of 2.45 percent.
As indicated in our yesterday’s report that the Nifty Bank index is
trading near its support of 100% extension levels (19410) of the
recent corrective move from
20576 to
19732 and
78.6%
retracement of the previous up move. A mentioned level coincides
with the lower end of the rising channel on daily chart. Though
we had seen some pull back in Nifty Bank index, we advise
traders not to form aggressive long positions as we expect the
support to be breached, sooner or later. The intraday support for
the Nifty Bank index are placed around 19500 and 19410;
whereas, resistance are seen around 19700 and 19830.
Key Levels
Support 1 - 19500
Resistance 1 - 19700
Support 2 - 19410
Resistance 2 - 19830
1
Technical & Derivatives Report
September 29, 2016
Comments
Nifty Vs OI
The Nifty futures open interest has increased by 2.31%
BankNifty futures open interest has decreased by 10.27%
as market closed at 8745.15 levels.
The Nifty September future closed with a premium of
13.30, against the premium of 10.15 points in last
trading session. The October series closed at a premium
of 57.80 points.
The Implied Volatility of at the money options has
decreased from 14.15% to 13.62%. At the same time,
the PCR-OI of Nifty has increased from 1.06 to 1.11.
The total OI of the market is Rs. 3,31,431/- cr. and the
stock futures OI is Rs. 92,581/- cr.
Few of the liquid counters where we have seen high cost
of carry are JINDALSTEL, JPASSOCIAT, ANDHRABANK,
DISHTV and NHPC.
Views
OI Gainers
FIIs were net buyer in both equity cash and Index Futures
OI
PRICE
SCRIP
OI
PRICE
CHG. (%)
CHG. (%)
segment. They bought equities worth Rs. 79 crores.
APOLLOHOSP
703200
19.67
1357.60
0.05
While, they were net buyers in index future worth Rs. 135
CESC
1852400
18.26
623.40
0.67
crores with rise in OI, indicating blend of both long and
ANDHRABANK
22560000
17.81
59.95
1.52
short build-up in last trading session. www.angelbroking.com
HDIL
30472000
15.01
84.70
1.93
On Index Options front, FIIs bought to the tune of
HINDZINC
5238400
13.84
230.65
0.79
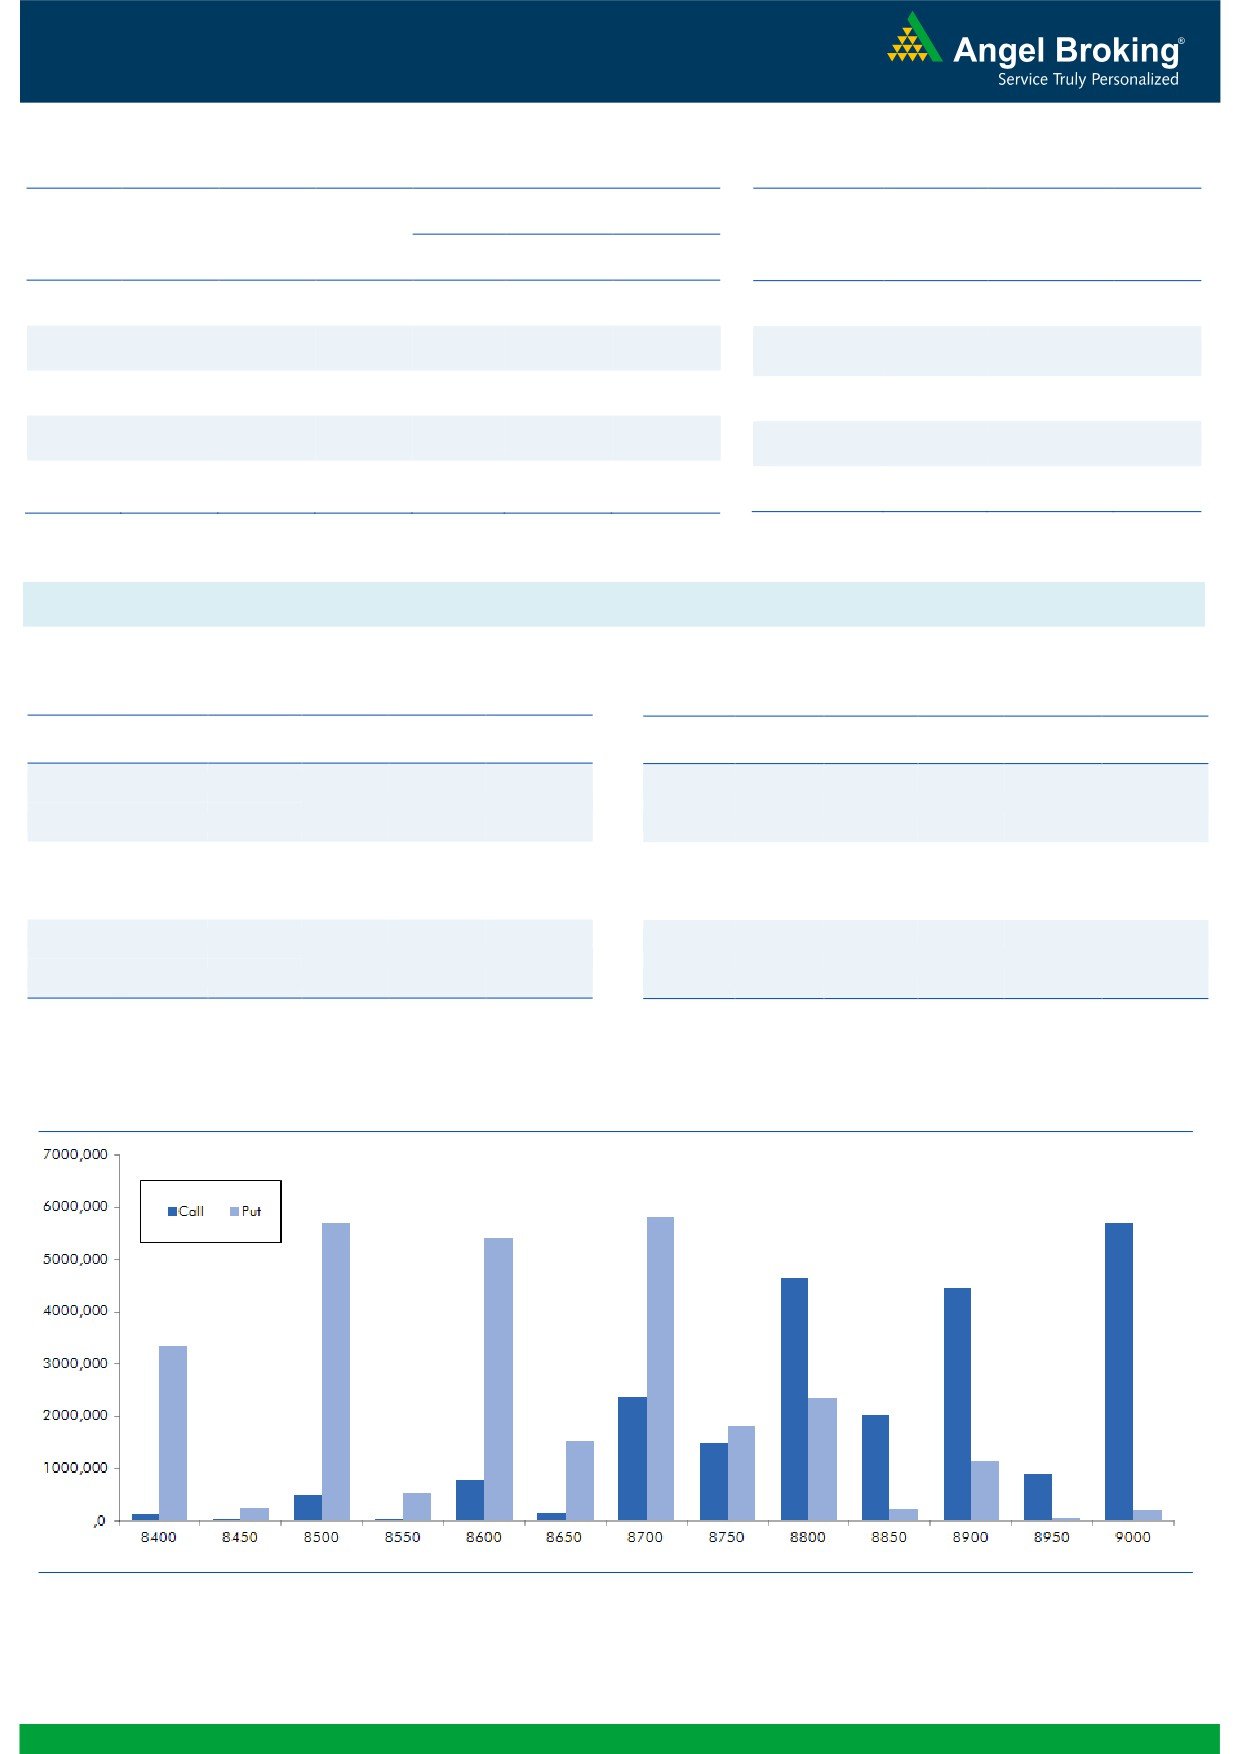
Rs. 1430 crores with rise in OI. In call options, 8850
MRF
61110
13.42
49736.70
6.57
strike added some build-up, followed by unwinding in
DABUR
6902500
11.33
278.10
-1.56
8700 and 8800 strikes. While in put options, 8700 and
8750 strike added huge open interest and we believe
NMDC
21120000
9.97
110.00
3.48
these are FIIs long positions. However, some unwinding
was seen in 8800 strike. Highest OI in September series
OI Losers
is placed at 9000 call and 8500 put option.
OI
PRICE
SCRIP
OI
PRICE
From last few trading sessions, we are witnessing good
CHG. (%)
CHG. (%)
SINTEX
37933500
-12.09
81.65
1.74
amount of profit booking and some fresh short formation
STAR
2561000
-11.34
1056.55
1.11
in Index Futures. Most of the long formed since August
ZEEL
8089900
-10.38
549.40
3.15
series are still intact. Hence, we believe Nifty may attract
UNIONBANK
15596000
-10.33
146.25
3.36
further profit booking, which may lead September Series
to expire near 8650-8700 levels. Traders are suggested
JPASSOCIAT
200532000
-9.90
11.20
0.90
to buy 8800 put to trade for today’s expiry.
RCOM
112980000
-9.56
47.90
-0.21
L&TFH
47943000
-9.42
92.55
1.87
CEATLTD
1414700
-9.21
1247.00
4.96
Historical Volatility
Put-Call Ratio
SCRIP
HV
SCRIP
PCR-OI
PCR-VOL
MRF
50.94
NIFTY
1.11
0.90
IDFC
55.98
BANKNIFTY
1.04
0.92
EICHERMOT
36.28
RELIANCE
0.70
0.67
CAIRN
39.76
AXISBANK
0.40
0.47
FEDERALBNK
39.21
YESBANK
0.70
0.57
2
Technical & Derivatives Report
September 29, 2016
FII Statistics for 28, September 2016
Turnover on 28, September 2016
Open Interest
No. of
Turnover
Change
Detail
Buy
Sell
Net
Instrument
Value
Contracts
( in Cr. )
(%)
Contracts
Change (%)
(in Cr.)
INDEX
INDEX
5368.18
5233.40
134.78
490848
32840.14
2.78
346340
24153.62
-12.87
FUTURES
FUTURES
INDEX
INDEX
51627.78
50197.36
1430.43
1457926
98101.39
2.68
6346728
444447.95
13.39
OPTIONS
OPTIONS
STOCK
25440.56
25797.15
(356.59)
1024230
68217.83
1.30
STOCK
FUTURES
1316873
91869.11
22.45
FUTURES
STOCK
STOCK
6472.80
6342.81
129.99
125136
8755.98
(2.25)
OPTIONS
470534
34877.99
13.87
OPTIONS
TOTAL
88909.32
87570.72
1338.61
3098140
207915.33
2.03
TOTAL
8480475
595348.67
13.32
Nifty Spot = 8745.15
Lot Size = 75
Bull-Call Spreads
Bear-Put Spreads
Action
Strike
Price
Risk
Reward
BEP
Action
Strike
Price
Risk
Reward
BEP
Buy
8700
62.50
Buy
8800
50.55
53.40
46.60
8753.40
41.40
58.60
8758.60
Sell
8800
9.10
Sell
8700
9.15
Buy
8700
62.50
Buy
8800
50.55
61.65
138.35
8761.65
48.95
151.05
8751.05
Sell
8900
0.85
Sell
8600
1.60
Buy
8800
9.10
Buy
8700
9.15
8.25
91.75
8808.25
7.55
92.45
8692.45
Sell
8900
0.85
Sell
8600
1.60
Note: Above mentioned Bullish or Bearish Spreads in Nifty (September Series) are given as an information and not as a recommendation.
Nifty Put-Call Analysis
3
Technical & Derivatives Report
September 29, 2016
Daily Pivot Levels for Nifty Constituents
Scrips
S2
S1
PIVOT
R1
R2
ACC
1,594
1,605
1,614
1,625
1,634
ADANIPORTS
258
265
268
275
278
AMBUJACEM
255
258
260
263
265
ASIANPAINT
1,181
1,187
1,194
1,200
1,207
AUROPHARMA
856
863
873
879
889
AXISBANK
537
543
547
553
557
BAJAJ-AUTO
2,850
2,882
2,903
2,935
2,957
BANKBARODA
161
165
167
171
173
BHEL
139
142
143
145
147
BPCL
605
611
615
621
625
BHARTIARTL
306
314
319
326
331
INFRATEL
350
357
362
368
373
BOSCH
22,345
22,767
23,044
23,466
23,742
CIPLA
597
601
607
611
617
COALINDIA
322
325
331
334
339
DRREDDY
3,165
3,183
3,205
3,223
3,245
EICHERMOT
24,059
24,923
25,484
26,348
26,909
GAIL
370
373
376
378
382
GRASIM
4,778
4,829
4,864
4,916
4,950
HCLTECH
784
790
796
802
808
HDFCBANK
1,284
1,290
1,295
1,301
1,306
HDFC
1,409
1,416
1,424
1,431
1,439
HEROMOTOCO
3,421
3,436
3,460
3,475
3,499
HINDALCO
145
151
155
161
164
HINDUNILVR
870
879
890
898
909
ICICIBANK
257
259
261
262
264
IDEA
78
80
82
84
85
INDUSINDBK
1,191
1,206
1,216
1,232
1,241
INFY
1,029
1,034
1,038
1,043
1,047
ITC
243
245
247
249
251
KOTAKBANK
771
777
784
790
798
LT
1,425
1,441
1,454
1,469
1,482
LUPIN
1,499
1,508
1,518
1,528
1,538
M&M
1,359
1,368
1,379
1,388
1,399
MARUTI
5,479
5,500
5,528
5,549
5,577
NTPC
151
152
153
153
154
ONGC
243
247
250
254
257
POWERGRID
175
177
178
180
181
RELIANCE
1,073
1,082
1,095
1,104
1,117
SBIN
245
249
253
257
260
SUNPHARMA
757
761
767
771
778
TCS
2,403
2,413
2,425
2,435
2,448
TATAMTRDVR
332
336
341
346
350
TATAMOTORS
525
533
539
546
553
TATAPOWER
74
75
76
77
77
TATASTEEL
363
372
377
386
391
TECHM
433
437
443
447
453
ULTRACEMCO
3,874
3,923
3,955
4,004
4,036
WIPRO
479
481
483
485
487
YESBANK
1,234
1,253
1,264
1,282
1,293
ZEEL
517
533
542
558
567
4
Technical & Derivatives Report
September 29, 2016
Research Team Tel: 022 - 39357800
For Technical Queries
For Derivatives Queries
DISCLAIMER
Angel Broking Private Limited (hereinafter referred to as “Angel”) is a registered Member of National Stock Exchange of India Limited,
Bombay Stock Exchange Limited and Metropolitan Stock Exchange Limited. It is also registered as a Depository Participant with CDSL
and Portfolio Manager with SEBI. It also has registration with AMFI as a Mutual Fund Distributor. Angel Broking Private Limited is a
registered entity with SEBI for Research Analyst in terms of SEBI (Research Analyst) Regulations, 2014 vide registration number
INH000000164. Angel or its associates has not been debarred/ suspended by SEBI or any other regulatory authority for accessing
/dealing in securities Market. Angel or its associates/analyst has not received any compensation / managed or co-managed public
offering of securities of the company covered by Analyst during the past twelve months.
This document is solely for the personal information of the recipient, and must not be singularly used as the basis of any investment
decision. Nothing in this document should be construed as investment or financial advice. Each recipient of this document should
make such investigations as they deem necessary to arrive at an independent evaluation of an investment in the securities of the
companies referred to in this document (including the merits and risks involved), and should consult their own advisors to determine
the merits and risks of such an investment.
Reports based on technical and derivative analysis center on studying charts of a stock's price movement, outstanding positions and
trading volume, as opposed to focusing on a company's fundamentals and, as such, may not match with a report on a company's
fundamentals. Investors are advised to refer the Fundamental and Technical Research Reports available on our website to evaluate the
contrary view, if any.
The information in this document has been printed on the basis of publicly available information, internal data and other reliable
sources believed to be true, but we do not represent that it is accurate or complete and it should not be relied on as such, as this
document is for general guidance only. Angel Broking Pvt. Limited or any of its affiliates/ group companies shall not be in any way
responsible for any loss or damage that may arise to any person from any inadvertent error in the information contained in this report.
Angel Broking Pvt. Limited has not independently verified all the information contained within this document. Accordingly, we cannot
testify, nor make any representation or warranty, express or implied, to the accuracy, contents or data contained within this document.
While Angel Broking Pvt. Limited endeavors to update on a reasonable basis the information discussed in this material, there may be
regulatory, compliance, or other reasons that prevent us from doing so.
This document is being supplied to you solely for your information, and its contents, information or data may not be reproduced,
redistributed or passed on, directly or indirectly.
Neither Angel Broking Pvt. Limited, nor its directors, employees or affiliates shall be liable for any loss or damage that may arise from
or in connection with the use of this information.
5