Technical & Derivatives Report
July 29, 2016
Sensex (28209) / Nifty (8666)
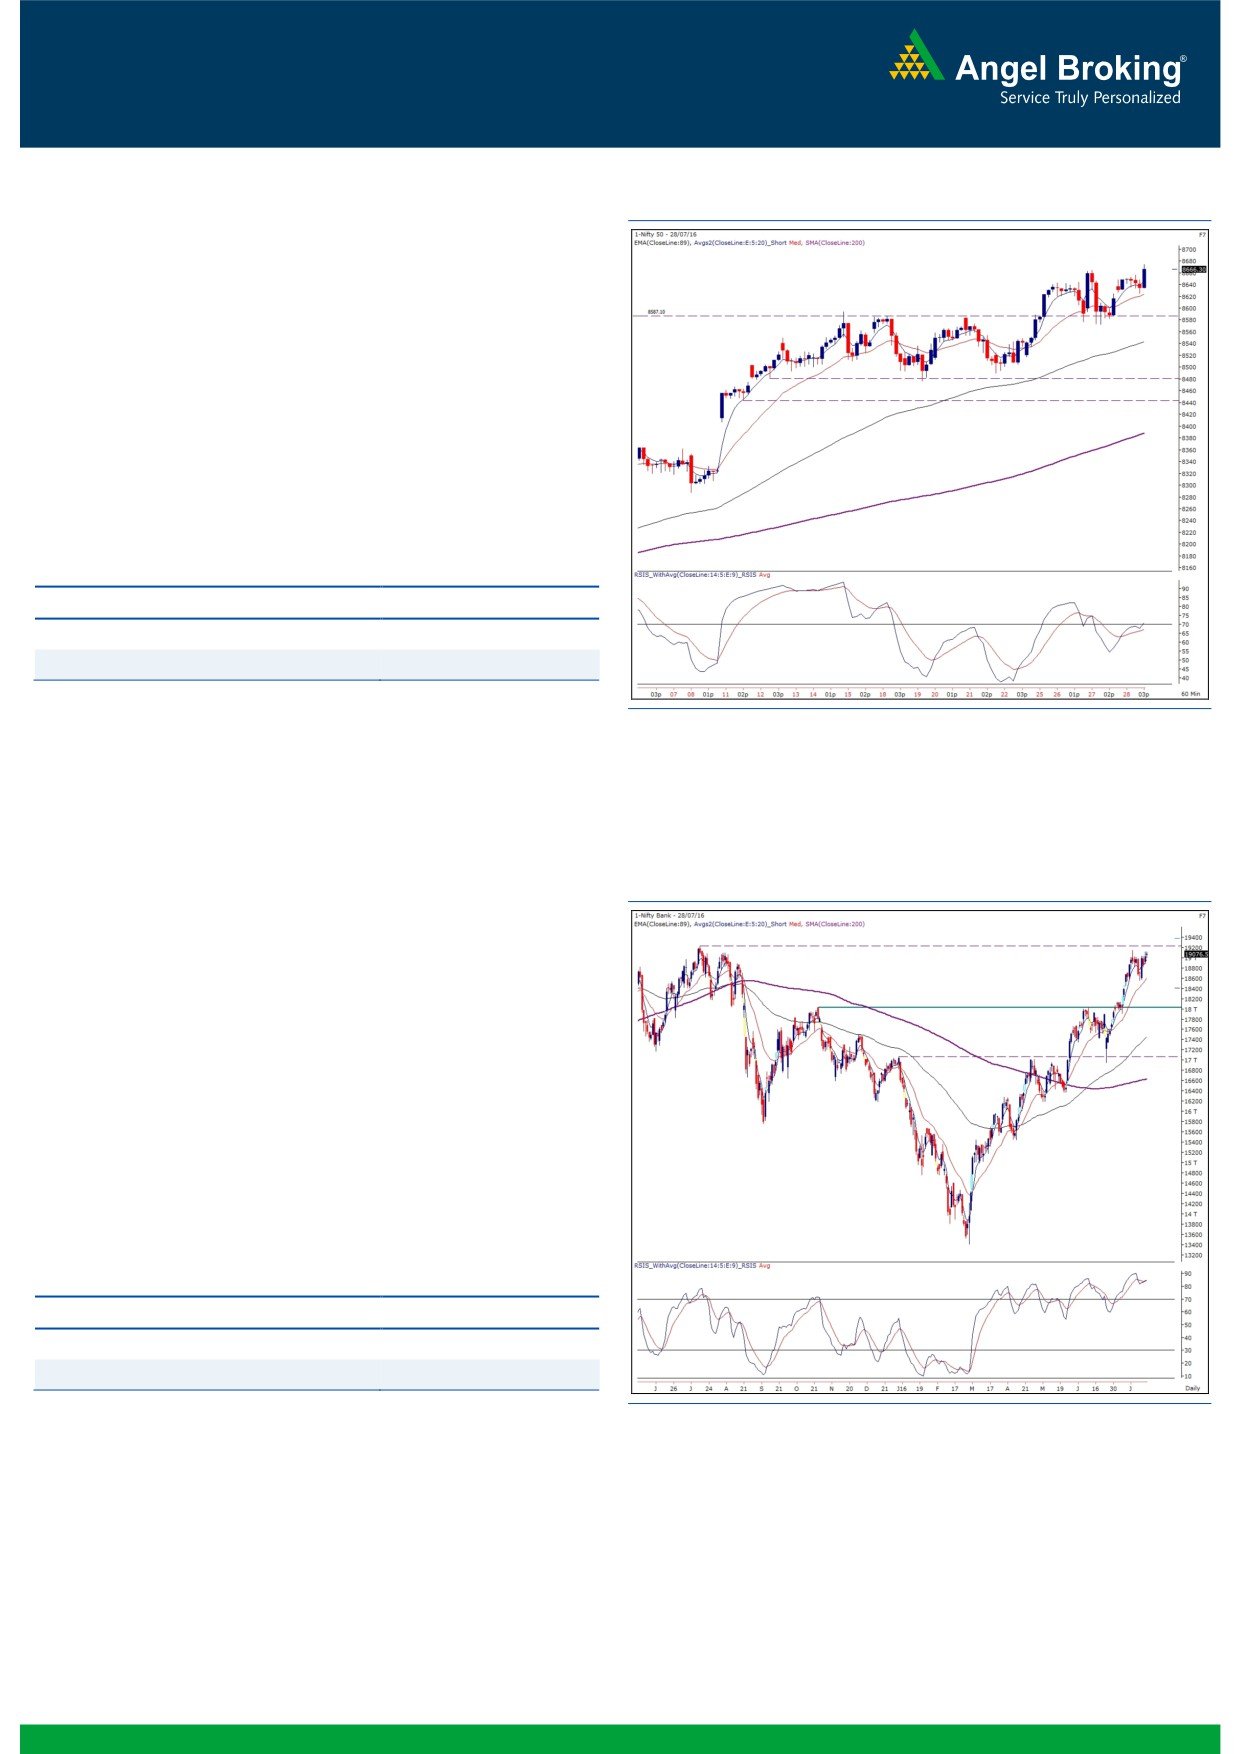
Exhibit 1: Nifty Hourly Chart
Yesterday, we saw Nifty opening on a flat note and then picked
up a strong momentum in the initial hour to test the 8650 mark.
However, unlike previous two sessions, the Nifty managed to hold
on to these early morning gains and eventually after a
consolidation ended the July series expiry at a 52-week high.
We maintain our positive stance on the market and expect the
Nifty to continue this upward momentum towards 8720 - 8780
levels. On the flipside, 8620 - 8572 are seen as strong support
levels. Traders are now advised to adopt a stock centric approach
and shift their stop losses higher for existing longs.
Key Levels
Support 1 - 8620
Resistance 1 - 8720
Support 2 - 8572
Resistance 2 - 8780
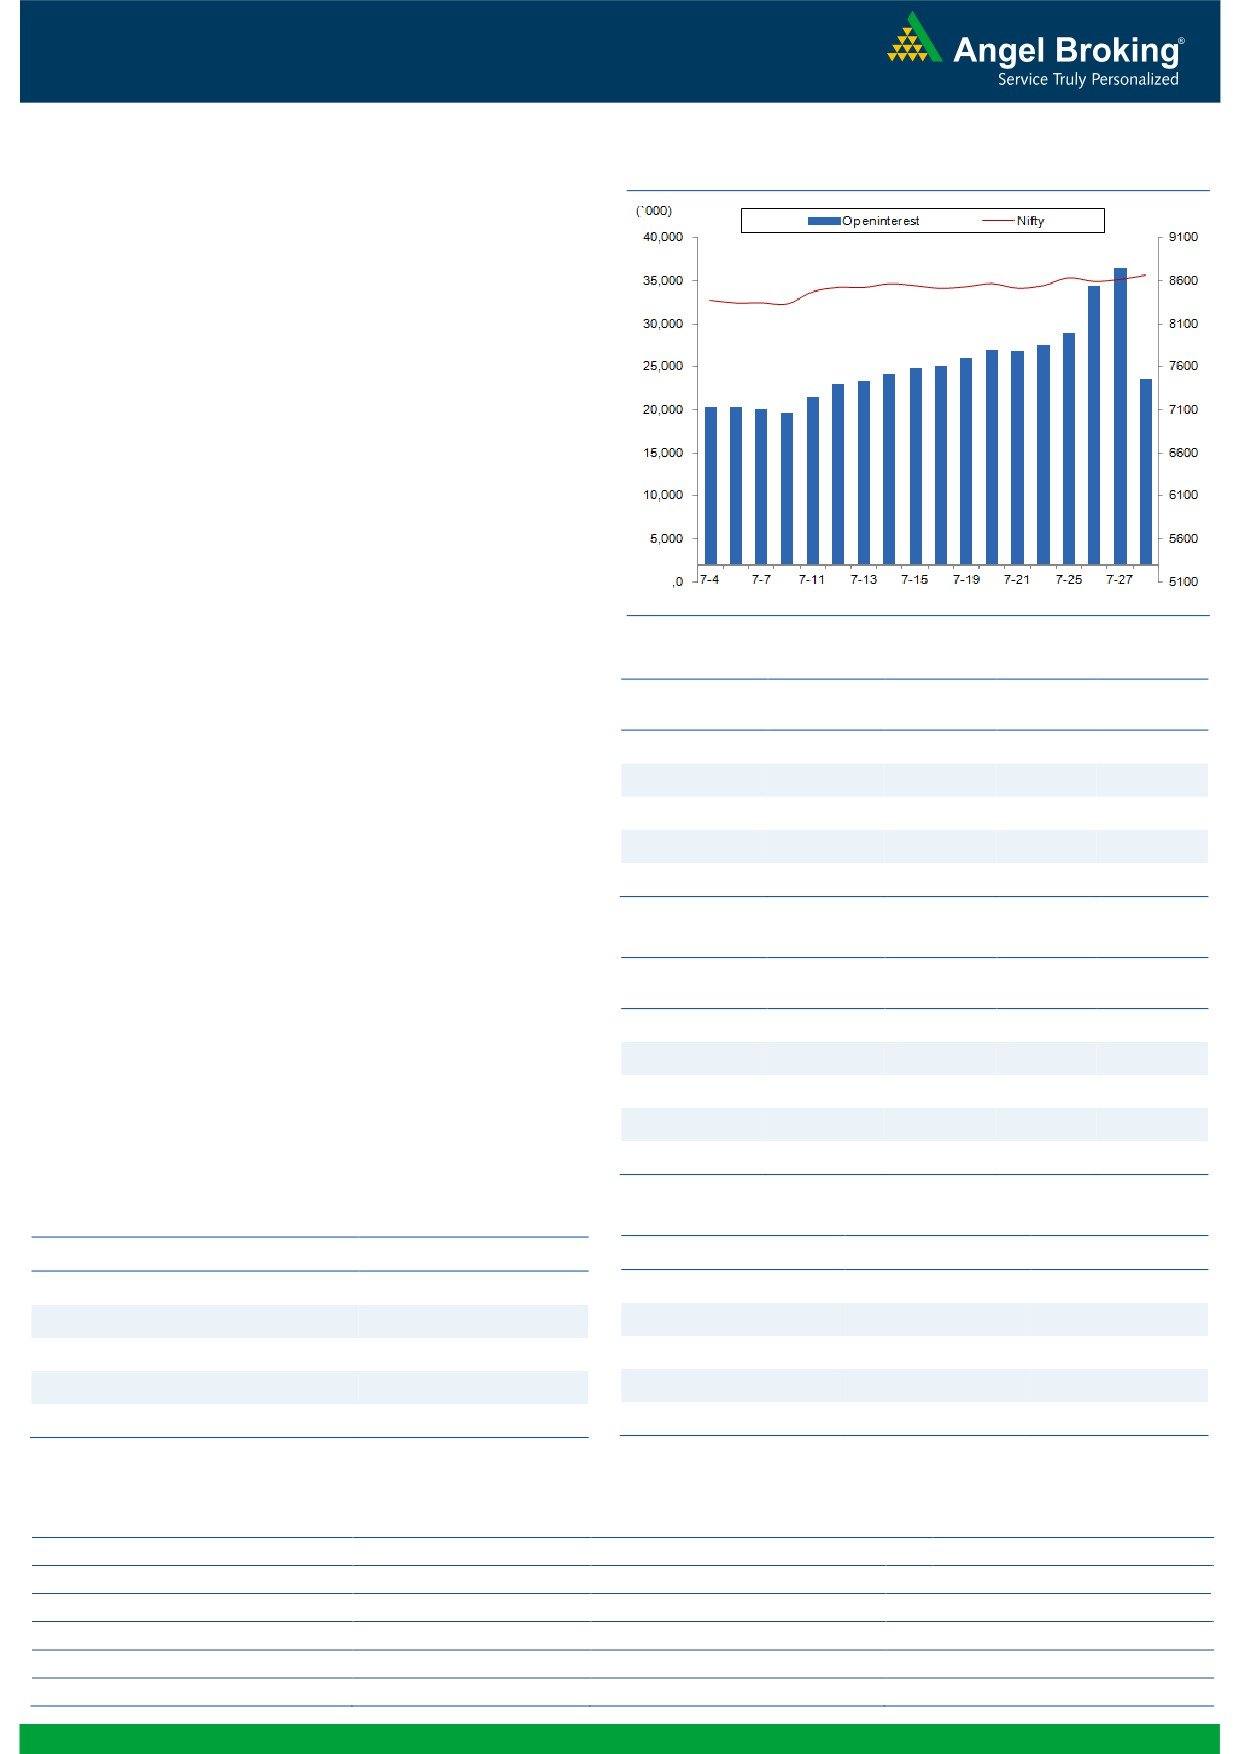
Nifty Bank Outlook - (19077)
Exhibit 2: Nifty Bank Daily Chart
The Nifty Bank index traded in a narrow range yesterday inspite
of F&O expiry, and ended the session with marginal gains of
0.29 percent over its previous day's close.
Yesterday's range bound trading action does not indicate any
change in directional view on the index. The Private sector
heavyweight stocks within the sector too have not shown any
reversal signs and hence, we continue to maintain out positive
stance on the index. Traders are thus, advised to continue trading
with positive bias unless any signs of reversal seen. The near term
support for the index is placed in range of 18880-18800 whereas
resistances are seen around 19125 and 19229.
Key Levels
Support 1 - 18880
Resistance 1 - 19125
Support 2 - 18800
Resistance 2 - 19229
1
Technical & Derivatives Report
July 29, 2016
Comments
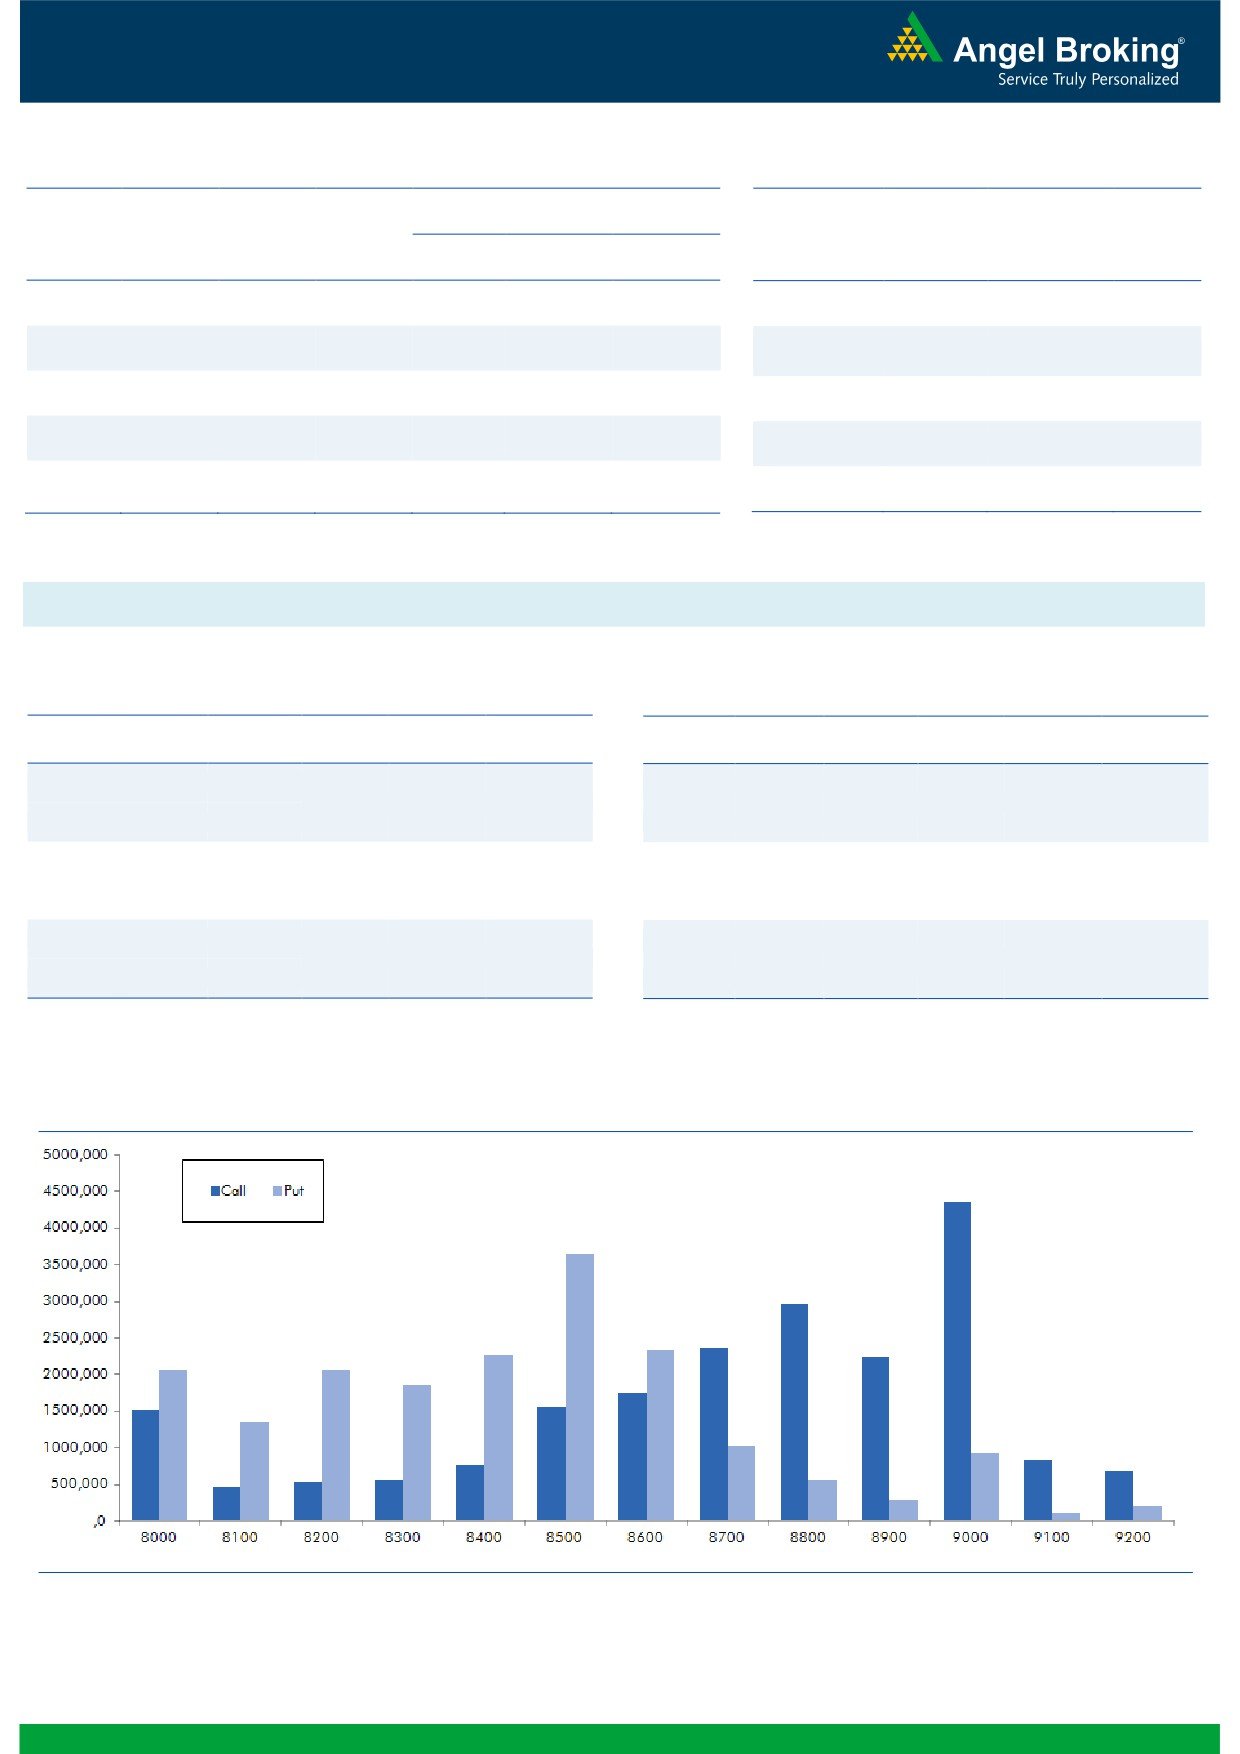
Nifty Vs OI
The Nifty futures open interest has decreased by 35.80%
BankNifty futures open interest has decreased by 30.77%
as market closed at 8666.30 levels.
The Nifty August future closed with a premium of 35.60
points against a premium of 44.80 points in previous
session. The September series closed at a premium of
81.65 points.
The Implied Volatility of at the money options has
decreased from 15.11% to 13.84%.
The total OI of the market is Rs. 2,18,603/- cr. and the
stock futures OI is Rs. 66,371/- cr.
Few of the liquid counters where we have seen high cost
of carry are JINDALSTEL, JPASSOCIAT, UNIONBANK,
GMRINFRA and IDFC.
Views
OI Gainers
Yesterday, FIIs were net buyer in both cash market and
OI
PRICE
SCRIP
OI
PRICE
Index Futures. They bought equities to the tune of Rs.
CHG. (%)
CHG. (%)
INDIACEM
26943000
6.30
123.30
6.29
1767 crores. While, they were marginal buyers of Rs. 81
crores in Index Futures with significant fall in open
PIDILITIND
1628000
1.75
757.70
2.93
interest, due to expiry.
WOCKPHARMA
2322000
0.81
998.35
0.32
In Index Options segment, FIIs were net buyers of worth
-
-
-
-
-
Rs. 2553 crores with rise in OI. In call options, 8900,ng.com
-
-
-
-
-
8700 and 9000 strikes added huge amount of fresh
positions. On the other hand in put options, significant
OI Losers
build-up was seen in 8600 - 8400 strikes. Highest
OI
PRICE
buildup in August series is placed at 9000 call and 8500
SCRIP
OI
PRICE
CHG. (%)
CHG. (%)
put options.
PCJEWELLER
418500
-52.95
422.90
-2.05
Rollover in Nifty is on the lower side in terms of
CESC
1222100
-42.17
628.85
2.28
percentage; but, is high if open interest is considered.
MOTHERSUMI
6557500
-40.44
329.85
2.15
Nearly 18% of longs formed in July series are still intact.
NIITTECH
522000
-40.34
465.55
0.30
Hence, we believe Nifty may continue to show strength
and one can expect 8800 levels in near term.
HEROMOTOCO
773800
-38.30
3197.00
-0.41
Historical Volatility
Put-Call Ratio
SCRIP
HV
SCRIP
PCR-OI
PCR-VOL
ASIANPAINT
34.94
NIFTY
0.92
0.94
OFSS
28.84
BANKNIFTY
1.13
1.15
EICHERMOT
24.49
DRREDDY
0.25
0.29
TITAN
24.33
INFY
0.32
0.35
CASTROLIND
28.35
ICICIBANK
0.51
0.44
Strategy Date
Symbol
Strategy
Status
04-07-2016
RCOM
Ratio Bull Call Spread
Marginal Loss on Expiry
11-07-2016
BANKNIFTY
Bull Call Spread
Didn’t trigger
18-07-2016
TCS
Long Put
Loss on Expiry
25-07-2016
TATAMOTORS
Long Call
Loss on Expiry
2
Technical & Derivatives Report
July 29, 2016
FII Statistics for 28-July 2016
Turnover on 28-July 2016
Open Interest
No. of
Turnover
Change
Detail
Buy
Sell
Net
Instrument
Value
Contracts
( in Cr. )
(%)
Contracts
Change (%)
(in Cr.)
INDEX
INDEX
4363.93
4282.74
81.19
281942
18707.72
(39.77)
408864
27943.24
-8.32
FUTURES
FUTURES
INDEX
INDEX
51488.20
48935.11
2553.09
707424
46112.75
(35.58)
8633471
585690.70
12.72
OPTIONS
OPTIONS
STOCK
21701.29
22419.46
(718.17)
760755
49657.09
(17.32)
STOCK
FUTURES
1533800
103875.36
11.34
FUTURES
STOCK
STOCK
4883.12
4813.31
69.80
1759
115.09
(98.51)
OPTIONS
593230
42419.59
-0.99
OPTIONS
TOTAL
82436.54
80450.61
1985.92
1751880
114592.65
(32.74)
TOTAL
11169365
759928.88
10.74
Nifty Spot = 8666.30
Lot Size = 75
Bull-Call Spreads
Bear-Put Spreads
Action
Strike
Price
Risk
Reward
BEP
Action
Strike
Price
Risk
Reward
BEP
Buy
8700
133.80
Buy
8700
133.45
46.25
53.75
8746.25
39.35
60.65
8660.65
Sell
8800
87.55
Sell
8600
94.10
Buy
8700
133.80
Buy
8700
133.45
80.40
119.60
8780.40
69.05
130.95
8630.95
Sell
8900
53.40
Sell
8500
64.40
Buy
8800
87.55
Buy
8600
94.10
34.15
65.85
8834.15
29.70
70.30
8570.30
Sell
8900
53.40
Sell
8500
64.40
Note: Above mentioned Bullish or Bearish Spreads in Nifty (August Series) are given as an information and not as a recommendation.
Nifty Put-Call Analysis
3
Technical & Derivatives Report
July 29, 2016
Daily Pivot Levels for Nifty Constituents
Scrips
S2
S1
PIVOT
R1
R2
ACC
1,647
1,666
1,678
1,697
1,710
ADANIPORTS
220
223
227
230
234
AMBUJACEM
263
267
271
275
278
ASIANPAINT
1,031
1,079
1,117
1,165
1,202
AUROPHARMA
763
771
784
793
806
AXISBANK
530
537
545
552
560
BAJAJ-AUTO
2,616
2,638
2,675
2,697
2,734
BANKBARODA
152
153
155
156
158
BHEL
146
148
149
151
153
BPCL
566
575
584
593
602
BHARTIARTL
354
363
372
381
391
INFRATEL
365
382
398
416
431
BOSCH
23,405
24,020
24,479
25,094
25,552
CIPLA
514
517
523
526
531
COALINDIA
323
326
330
333
337
DRREDDY
2,911
2,936
2,977
3,001
3,043
EICHERMOT
20,147
20,624
20,936
21,413
21,725
GAIL
379
381
385
387
391
GRASIM
4,761
4,799
4,859
4,897
4,957
HCLTECH
739
745
752
758
765
HDFCBANK
1,229
1,239
1,245
1,255
1,261
HDFC
1,359
1,381
1,395
1,417
1,431
HEROMOTOCO
3,117
3,157
3,194
3,234
3,270
HINDALCO
130
132
134
136
137
HINDUNILVR
888
899
906
917
924
ICICIBANK
269
270
272
274
276
IDEA
102
104
106
107
110
INDUSINDBK
1,147
1,158
1,175
1,185
1,203
INFY
1,067
1,072
1,080
1,085
1,092
ITC
246
250
253
257
260
KOTAKBANK
738
744
752
758
766
LT
1,537
1,557
1,582
1,602
1,627
LUPIN
1,669
1,687
1,715
1,733
1,761
M&M
1,437
1,445
1,454
1,462
1,471
MARUTI
4,493
4,628
4,706
4,841
4,919
NTPC
155
157
158
160
162
ONGC
218
220
222
224
227
POWERGRID
169
173
176
179
182
RELIANCE
1,006
1,016
1,023
1,034
1,041
SBIN
226
228
232
234
238
SUNPHARMA
802
814
821
832
839
TCS
2,556
2,588
2,609
2,640
2,661
TATAMTRDVR
319
323
328
332
336
TATAMOTORS
493
500
506
513
519
TATAPOWER
70
70
71
71
72
TATASTEEL
342
346
353
356
363
TECHM
472
479
489
496
506
ULTRACEMCO
3,609
3,644
3,679
3,714
3,750
WIPRO
539
546
552
559
564
YESBANK
1,193
1,208
1,218
1,233
1,243
ZEEL
478
482
486
490
495
4
Technical & Derivatives Report
July 29, 2016
Research Team Tel: 022 - 39357800
For Technical Queries
For Derivatives Queries
DISCLAIMER
Angel Broking Private Limited (hereinafter referred to as “Angel”) is a registered Member of National Stock Exchange of India Limited,
Bombay Stock Exchange Limited and Metropolitan Stock Exchange Limited. It is also registered as a Depository Participant with CDSL
and Portfolio Manager with SEBI. It also has registration with AMFI as a Mutual Fund Distributor. Angel Broking Private Limited is a
registered entity with SEBI for Research Analyst in terms of SEBI (Research Analyst) Regulations, 2014 vide registration number
INH000000164. Angel or its associates has not been debarred/ suspended by SEBI or any other regulatory authority for accessing
/dealing in securities Market. Angel or its associates/analyst has not received any compensation / managed or co-managed public
offering of securities of the company covered by Analyst during the past twelve months.
This document is solely for the personal information of the recipient, and must not be singularly used as the basis of any investment
decision. Nothing in this document should be construed as investment or financial advice. Each recipient of this document should
make such investigations as they deem necessary to arrive at an independent evaluation of an investment in the securities of the
companies referred to in this document (including the merits and risks involved), and should consult their own advisors to determine
the merits and risks of such an investment.
Reports based on technical and derivative analysis center on studying charts of a stock's price movement, outstanding positions and
trading volume, as opposed to focusing on a company's fundamentals and, as such, may not match with a report on a company's
fundamentals. Investors are advised to refer the Fundamental and Technical Research Reports available on our website to evaluate the
contrary view, if any.
The information in this document has been printed on the basis of publicly available information, internal data and other reliable
sources believed to be true, but we do not represent that it is accurate or complete and it should not be relied on as such, as this
document is for general guidance only. Angel Broking Pvt. Limited or any of its affiliates/ group companies shall not be in any way
responsible for any loss or damage that may arise to any person from any inadvertent error in the information contained in this report.
Angel Broking Pvt. Limited has not independently verified all the information contained within this document. Accordingly, we cannot
testify, nor make any representation or warranty, express or implied, to the accuracy, contents or data contained within this document.
While Angel Broking Pvt. Limited endeavors to update on a reasonable basis the information discussed in this material, there may be
regulatory, compliance, or other reasons that prevent us from doing so.
This document is being supplied to you solely for your information, and its contents, information or data may not be reproduced,
redistributed or passed on, directly or indirectly.
Neither Angel Broking Pvt. Limited, nor its directors, employees or affiliates shall be liable for any loss or damage that may arise from
or in connection with the use of this information.
5