Technical & Derivatives Report
March 29, 2016
Sensex (24966) / Nifty (7615)
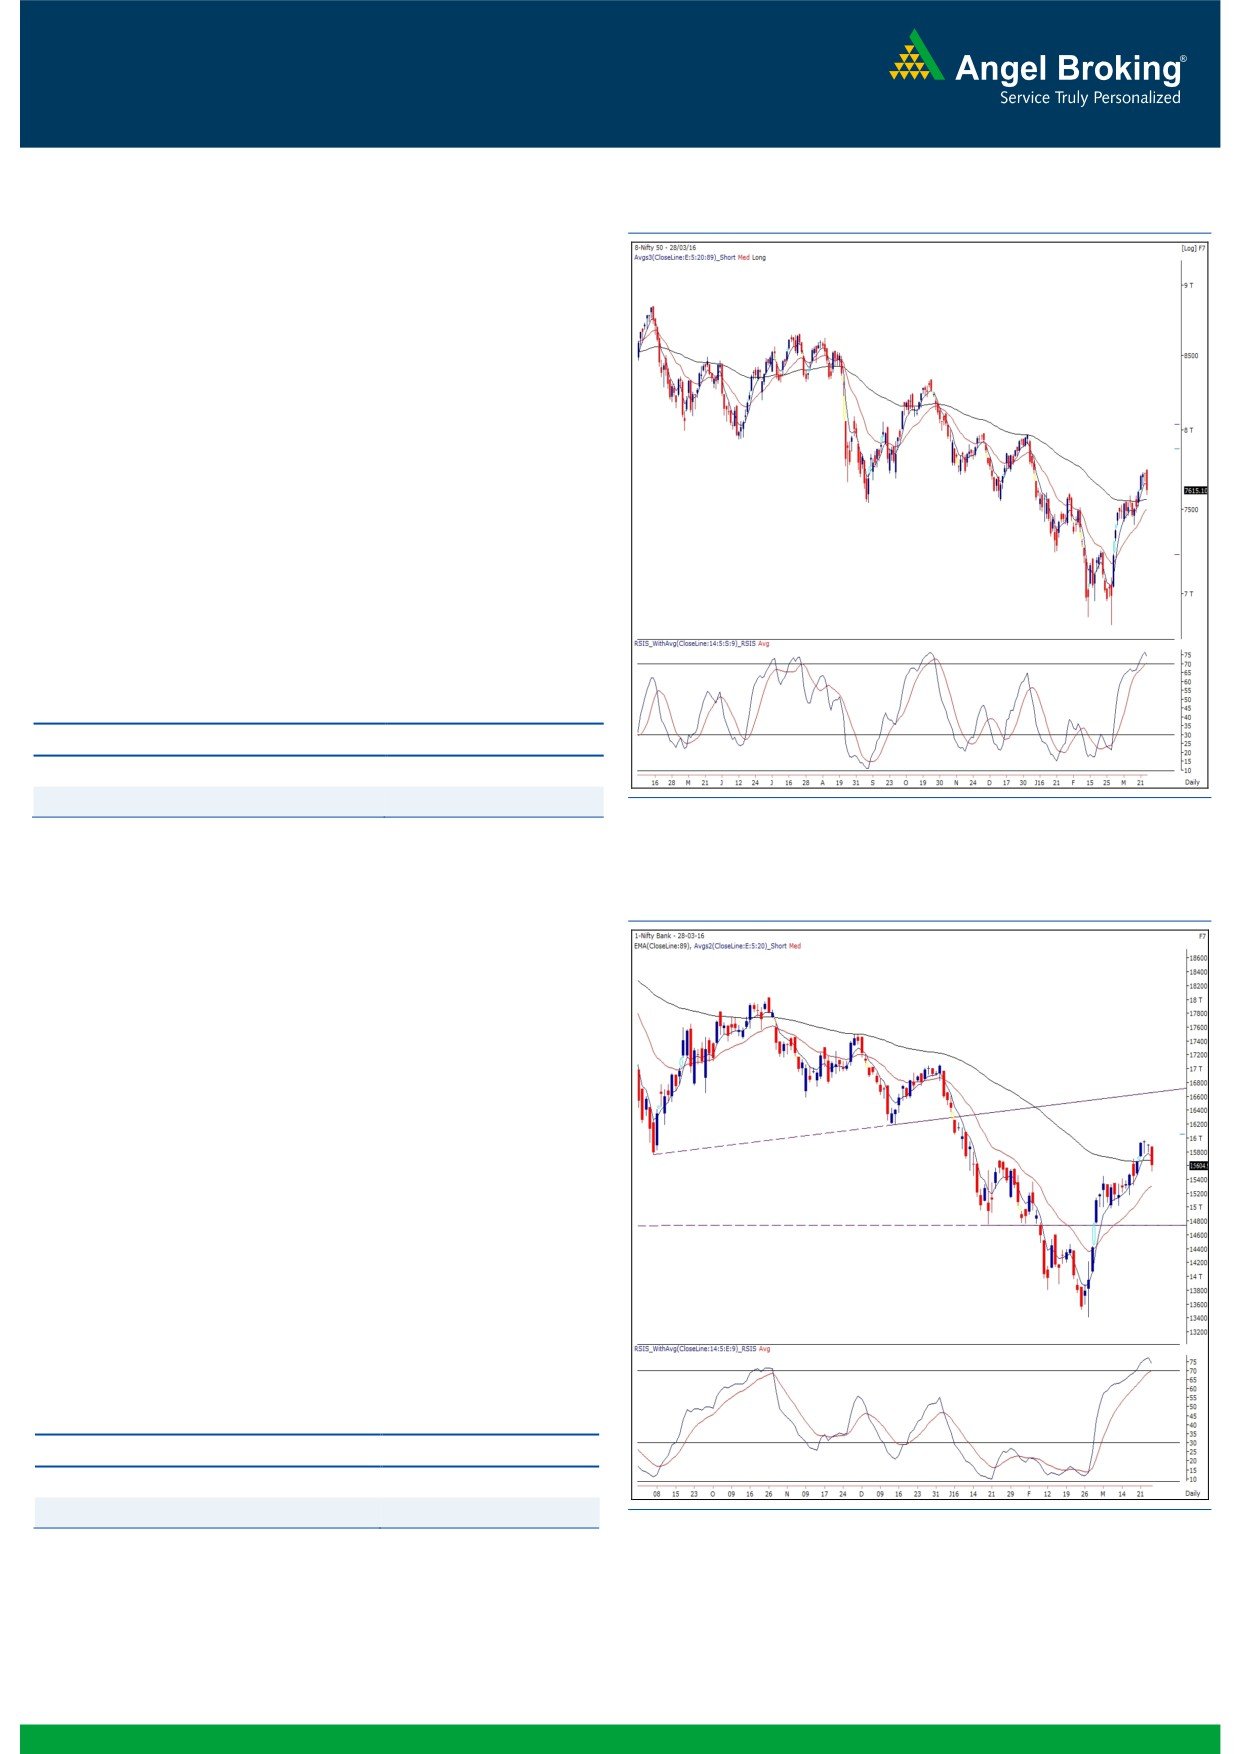
Exhibit 1: Nifty Daily Chart
After an extended weekend, yesterday's session opened with a
mildly positive bias. However, the early morning optimism was
very short lived as we witnessed a steady correction throughout
the day to end the session with more than a percent loss.
Yesterday, we clearly saw an underperformance from our
markets as compared to its peers across the globe. The index
shrugged off positive cues from the major Asian bourses and
kept on descending throughout the session. In fact, some of
the index constituents sinked brutally on back of heavy profit
booking. It seems the mentioned resistance level of 7750
proved its significance as the Nifty started this correction after
posting a high of 7744 in the initial trades. Going forward,
traders are advised not to remain short on the index as we are
observing a strong support zone of 7600 - 7580 levels. On
the flipside, 7680 - 7750 is likely to act as a strong resistance.
Key Levels
Support 1 - 7600
Resistance 1 - 7680
Support 2 - 7580
Resistance 2 -
7750
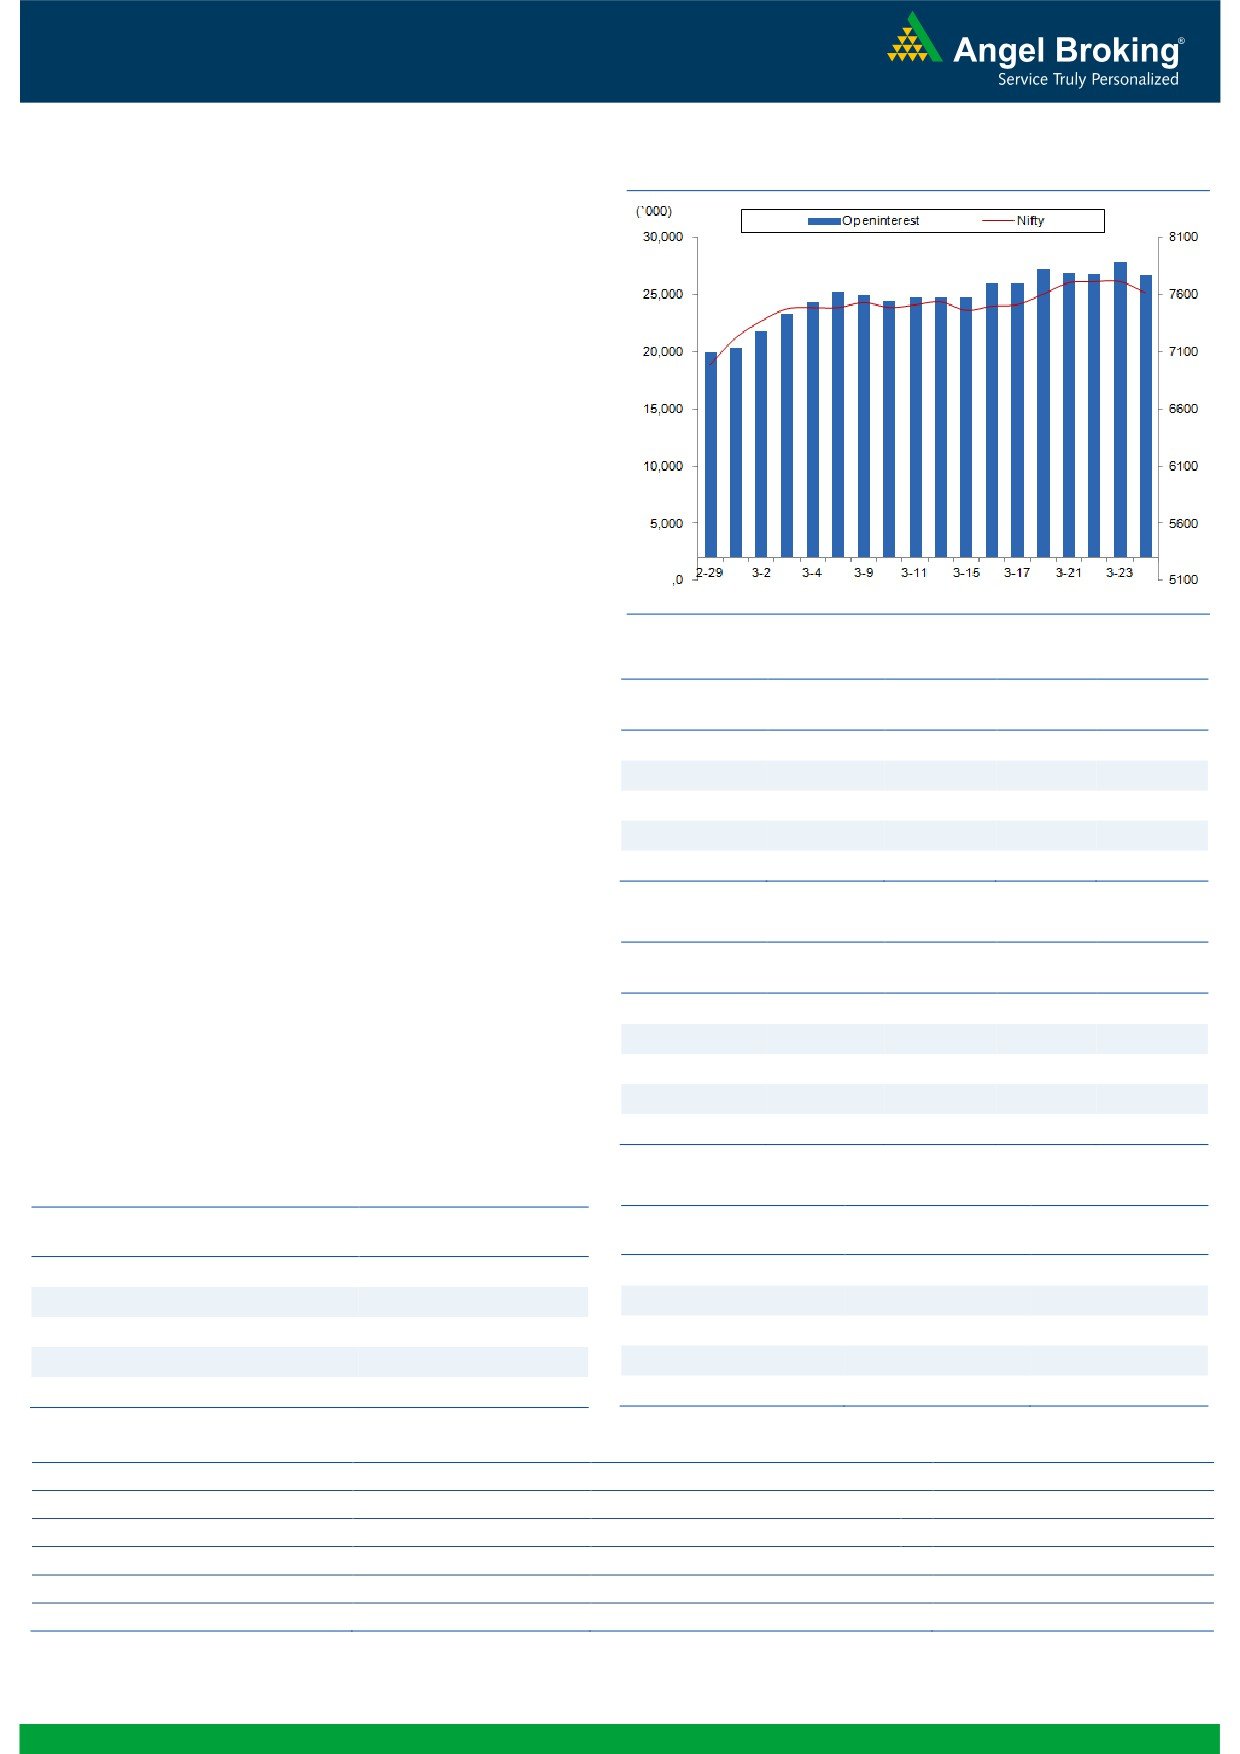
Exhibit 2: Nifty Bank Daily Chart
Nifty Bank Outlook - (15605)
Along with the broader market sell off, the Nifty Bank index
too corrected in yesterday's trading session and ended with
losses of 1.78% over its previous close.
In our previous report, we had mentioned that the near term
support for the index is in the range of 15670 - 15735, which
was breached during yesterday's session. This could lead to
some profit booking in the index in the near term. However,
there is no clear evidence of a trend reversal on the daily
chart. This indicates that this down move probably could just
be a correction within a short term upmove. Traders are hence
advised to trade with a stock specific approach and wait for
further developments to happen on the index front. The
intraday support for the banking index is placed around
15470 - 15450; whereas, resistance is seen around 15775 -
15857.
Key Levels
Support 1 - 15450
Resistance 1 - 15775
Support 2 - 15320
Resistance 2 - 15857
1
Technical & Derivatives Report
March 29, 2016
Comments
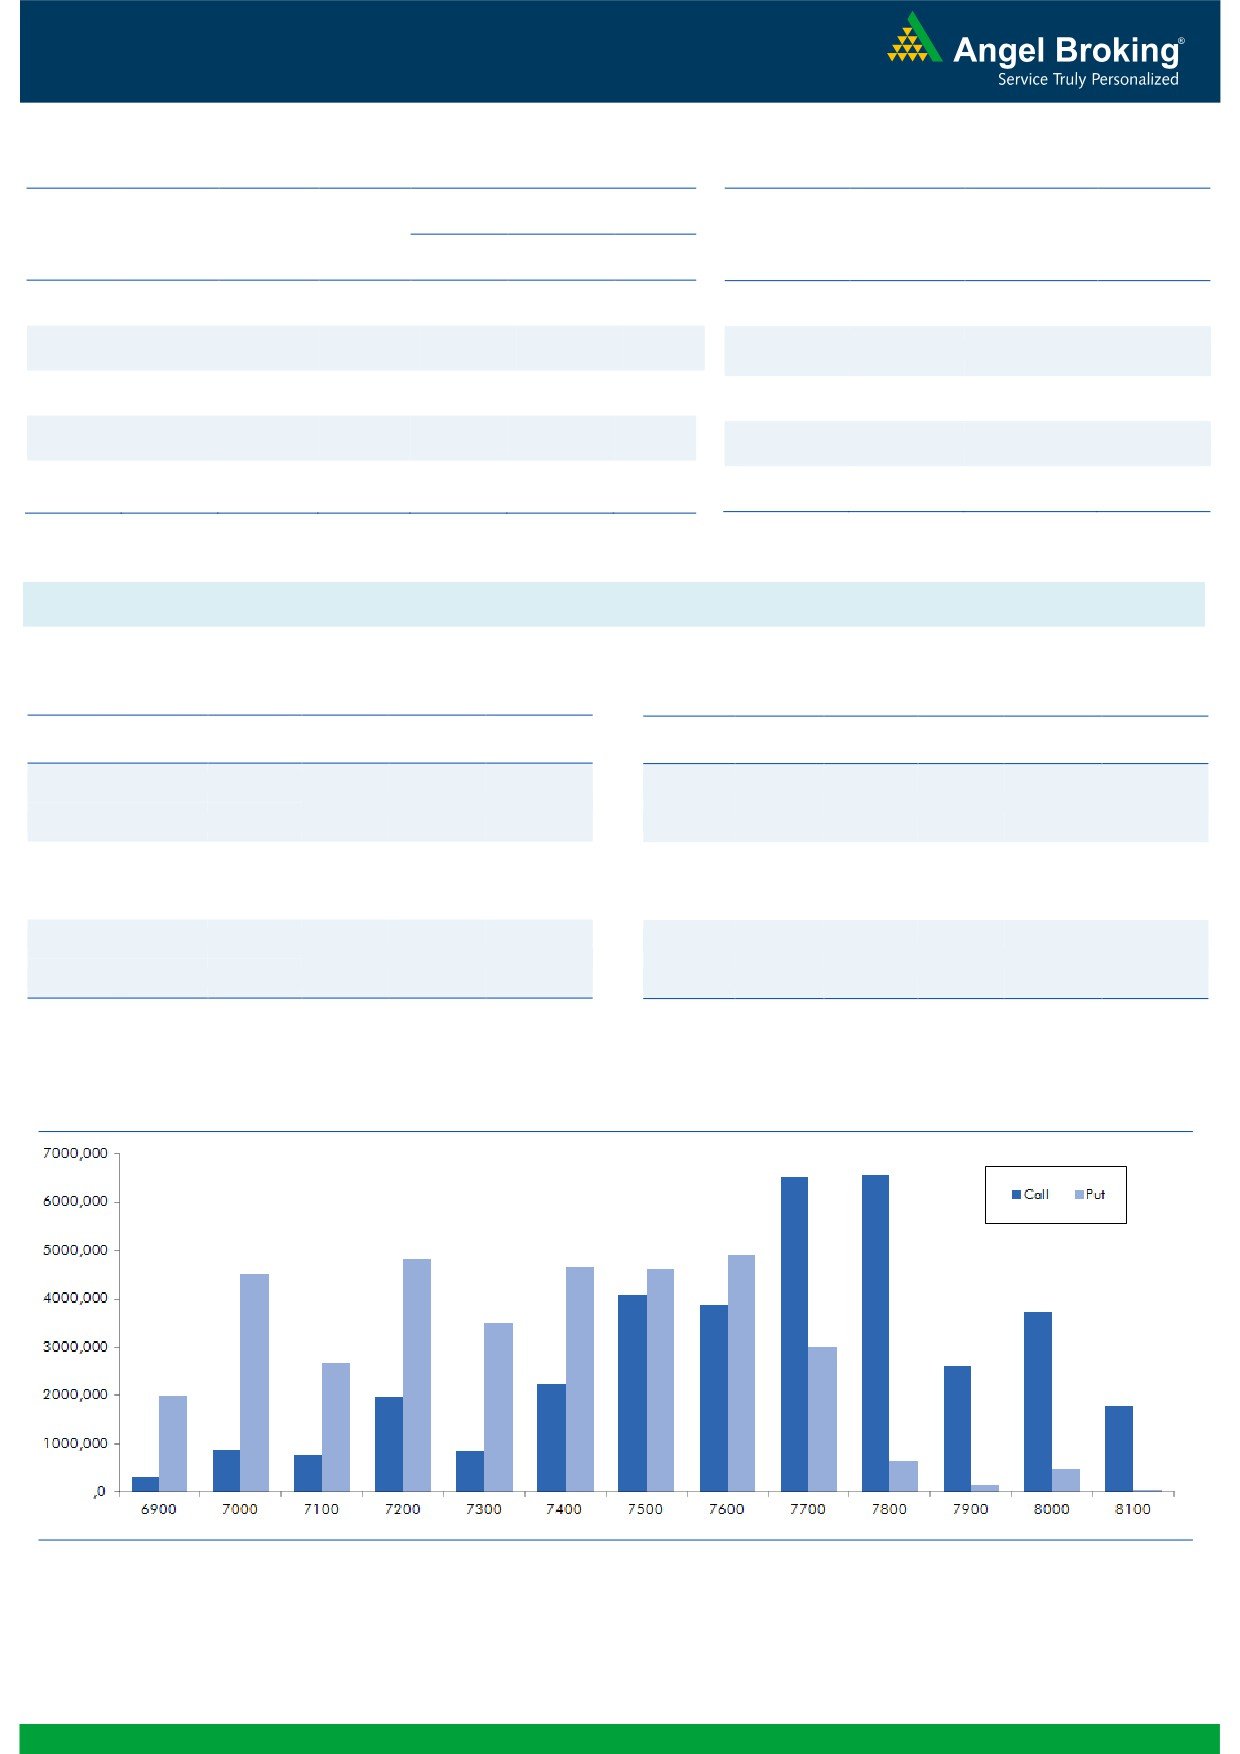
Nifty Vs OI
The Nifty futures open interest has decreased by 4.22%
BankNifty futures open interest has decreased by 8.96%
as market closed at 7615.10 levels.
The Nifty March future closed at a premium of 23.50
points against a premium of 19.80 points. The April
series closed at a premium of 72.00 points.
The Implied Volatility of at the money options has
increased from 10.93% to 17.39%.
The total OI of the market is Rs. 2,51,660/- cr. and the
stock futures OI is Rs. 59,037 /- cr.
Few of the liquid counters where we have seen high cost
of carry are JPASSOCIAT, JISLJALEQS, INDUSINDBK,
SRF and BANKBARODA.
Views
OI Gainers
Despite Nifty correcting more than 100 points yesterday,
OI
PRICE
SCRIP
OI
PRICE
FIIs bought significantly in cash segment. They bought
CHG. (%)
CHG. (%)
KPIT
1528000
24.03
144.15
0.14
equities to the tune of Rs. 2043 crores. While in Index
BAJAJ-AUTO
1699000
21.22
2360.55
-0.05
Futures, they sold of worth Rs.
161 crores with
considerable fall in OI, suggesting mix of both long
M&MFIN
15294000
19.43
237.35
-1.15
unwinding and short covering in last trading session.
AMBUJACEM
7394100
16.05
230.50
0.66
In Index Options front, FIIs sold of worth Rs. 295 croresng.com
L&TFH
34376000
15.29
63.20
-0.24
with some fall in OI. In call options, 7650-7750 strikes
added decent build-up with rise in implied volatility. This
OI Losers
indicated some buying took place in these call options,
OI
PRICE
SCRIP
OI
PRICE
expecting Nifty to show strength from its immediate
CHG. (%)
CHG. (%)
support of 7600 levels. While in put options, we witness
RELINFRA
7120100
-9.47
522.70
-2.58
good amount of unwinding in 7700 strike. Maximum OI
SIEMENS
1330400
-7.92
1071.55
-2.11
in current series is visible in 7800 call and 7600 put
CEATLTD
1296400
-6.51
1052.50
-2.16
options. Rollover in Nifty is at 29.67% and of BankNifty is
GODREJCP
243200
-6.32
1326.45
1.61
at 22.58%.
BANKINDIA
16527000
-6.25
93.25
-3.47
Historical Volatility
Put-Call Ratio
SCRIP
HV
SCRIP
PCR-OI
PCR-VOL
TITAN
55.85
NIFTY
0.96
0.95
HINDALCO
73.89
BANKNIFTY
0.96
0.79
SUNPHARMA
36.72
SBIN
0.80
0.52
PIDILITIND
31.66
LUPIN
0.33
0.45
ADANIPOWER
49.49
ICICIBANK
1.22
0.82
Strategy Date
Symbol
Strategy
Status
February 29, 2016
RELIANCE
Ratio Bull Call Spread
Active
March 07, 2016
BHEL
Long Call Ladder
Active
March 14, 2016
NIFTY
Ratio Bull Call Spread
Not Activated
March 21, 2016
BANKNIFTY
Long Call
Active
March 28, 2016
NIFTY
Ratio Bull Call Spread
Active
2
Technical & Derivatives Report
March 29, 2016
FII Statistics for 28-March 2016
Turnover on 28-March 2016
Open Interest
No. of
Turnover
Change
Detail
Buy
Sell
Net
Instrument
Value
Change
Contracts
( in Cr. )
(%)
Contracts
(in Cr.)
(%)
INDEX
INDEX
3582.68
3743.60
(160.92)
327277
18181.72
(9.03)
399016
21723.60
37.72
FUTURES
FUTURES
INDEX
INDEX
29675.33
29970.51
(295.18)
1539694
86466.17
(0.85)
5064302
283697.30
18.03
OPTIONS
OPTIONS
STOCK
14507.19
16294.61
(1787.42)
1064647
48796.95
1.36
STOCK
FUTURES
1003282
47217.92
64.04
FUTURES
STOCK
STOCK
2852.15
3048.70
(196.55)
100813
4636.71
1.96
OPTIONS
368121
18002.48
9.36
OPTIONS
TOTAL
50617.35
53057.42
(2440.07)
3032431
158081.55
(0.96)
TOTAL
6834721
370641.30
22.98
Nifty Spot = 7615.10
Lot Size = 75
Bull-Call Spreads
Bear-Put Spreads
Action
Strike
Price
Risk
Reward
BEP
Action
Strike
Price
Risk
Reward
BEP
Buy
7600
63.20
Buy
7600
28.85
44.35
55.65
7644.35
19.20
80.80
7580.80
Sell
7700
18.85
Sell
7500
9.65
Buy
7600
63.20
Buy
7600
28.85
58.80
141.20
7658.80
25.15
174.85
7574.85
Sell
7800
4.40
Sell
7400
3.70
Buy
7700
18.85
Buy
7500
9.65
14.45
85.55
7714.45
5.95
94.05
7494.05
Sell
7800
4.40
Sell
7400
3.70
Note: Above mentioned Bullish or Bearish Spreads in Nifty (March Series) are given as an information and not as a recommendation.
Nifty Put-Call Analysis
3
Technical & Derivatives Report
March 29, 2016
Daily Pivot Levels for Nifty 50 Stocks
Scrips
S2
S1
PIVOT
R1
R2
ACC
1,338
1,358
1,375
1,395
1,412
ADANIPORTS
227
231
237
242
247
AMBUJACEM
220
225
230
235
241
ASIANPAINT
834
840
849
854
863
AXISBANK
408
416
427
434
446
BAJAJ-AUTO
2,312
2,335
2,355
2,378
2,398
BANKBARODA
133
136
140
143
148
BHARTIARTL
338
344
353
358
367
BHEL
109
111
114
116
120
BOSCHLTD
19,722
20,085
20,362
20,725
21,003
BPCL
851
862
875
886
898
CAIRN
152
154
156
158
160
CIPLA
513
518
528
534
543
COALINDIA
288
291
295
297
301
DRREDDY
2,981
3,008
3,041
3,069
3,102
GAIL
353
355
359
361
365
GRASIM
3,702
3,744
3,776
3,818
3,849
HCLTECH
794
803
815
823
835
HDFC
1,117
1,130
1,150
1,163
1,183
HDFCBANK
1,036
1,042
1,047
1,053
1,059
HEROMOTOCO
2,799
2,823
2,857
2,881
2,915
HINDALCO
76
80
86
90
96
HINDUNILVR
851
857
867
873
883
ICICIBANK
218
222
228
232
238
IDEA
102
104
105
107
108
INDUSINDBK
894
905
922
932
949
INFY
1,171
1,188
1,213
1,229
1,254
ITC
315
319
324
328
334
KOTAKBANK
652
661
669
678
687
LT
1,169
1,188
1,217
1,236
1,265
LUPIN
1,453
1,474
1,511
1,532
1,569
M&M
1,220
1,232
1,249
1,261
1,278
MARUTI
3,534
3,587
3,682
3,735
3,830
NTPC
126
128
129
131
132
ONGC
209
211
215
218
221
PNB
79
81
83
84
87
POWERGRID
135
137
139
141
142
RELIANCE
1,007
1,013
1,023
1,030
1,039
SBIN
181
185
191
195
202
VEDL
81
84
91
94
101
SUNPHARMA
776
793
819
836
862
TATAMOTORS
353
358
367
372
381
TATAPOWER
59
60
62
62
64
TATASTEEL
284
292
305
313
326
TCS
2,428
2,451
2,484
2,507
2,540
TECHM
453
464
475
485
496
ULTRACEMCO
3,112
3,144
3,188
3,220
3,264
WIPRO
542
549
556
563
571
YESBANK
821
832
846
856
870
ZEEL
381
384
389
392
396
4
Technical & Derivatives Report
March 29, 2016
Research Team Tel: 022 - 39357800
For Technical Queries
For Derivatives Queries
DISCLAIMER
Angel Broking Private Limited (hereinafter referred to as “Angel”) is a registered Member of National Stock Exchange of India Limited,
Bombay Stock Exchange Limited and MCX Stock Exchange Limited. It is also registered as a Depository Participant with CDSL and
Portfolio Manager with SEBI. It also has registration with AMFI as a Mutual Fund Distributor. Angel Broking Private Limited is a
registered entity with SEBI for Research Analyst in terms of SEBI (Research Analyst) Regulations, 2014 vide registration number
INH000000164. Angel or its associates has not been debarred/ suspended by SEBI or any other regulatory authority for accessing
/dealing in securities Market. Angel or its associates including its relatives/analyst do not hold any financial interest/beneficial
ownership of more than 1% in the company covered by Analyst. Angel or its associates/analyst has not received any compensation /
managed or co-managed public offering of securities of the company covered by Analyst during the past twelve months. Angel/analyst
has not served as an officer, director or employee of company covered by Analyst and has not been engaged in market making activity
of the company covered by Analyst.
This document is solely for the personal information of the recipient, and must not be singularly used as the basis of any investment
decision. Nothing in this document should be construed as investment or financial advice. Each recipient of this document should
make such investigations as they deem necessary to arrive at an independent evaluation of an investment in the securities of the
companies referred to in this document (including the merits and risks involved), and should consult their own advisors to determine
the merits and risks of such an investment.
Reports based on technical and derivative analysis center on studying charts of a stock's price movement, outstanding positions and
trading volume, as opposed to focusing on a company's fundamentals and, as such, may not match with a report on a company's
fundamentals.
The information in this document has been printed on the basis of publicly available information, internal data and other reliable
sources believed to be true, but we do not represent that it is accurate or complete and it should not be relied on as such, as this
document is for general guidance only. Angel Broking Pvt. Limited or any of its affiliates/ group companies shall not be in any way
responsible for any loss or damage that may arise to any person from any inadvertent error in the information contained in this report.
Angel Broking Pvt. Limited has not independently verified all the information contained within this document. Accordingly, we cannot
testify, nor make any representation or warranty, express or implied, to the accuracy, contents or data contained within this document.
While Angel Broking Pvt. Limited endeavors to update on a reasonable basis the information discussed in this material, there may be
regulatory, compliance, or other reasons that prevent us from doing so.
This document is being supplied to you solely for your information, and its contents, information or data may not be reproduced,
redistributed or passed on, directly or indirectly.
Neither Angel Broking Pvt. Limited, nor its directors, employees or affiliates shall be liable for any loss or damage that may arise from
or in connection with the use of this information.
Note: Please refer to the important ‘Stock Holding Disclosure' report on the Angel website (Research Section). Also, please refer to the
latest update on respective stocks for the disclosure status in respect of those stocks. Angel Broking Pvt. Limited and its affiliates may
have investment positions in the stocks recommended in this report.
5