Technical & Derivatives Report
February 29, 2016
Sensex (23154) / Nifty (7030)
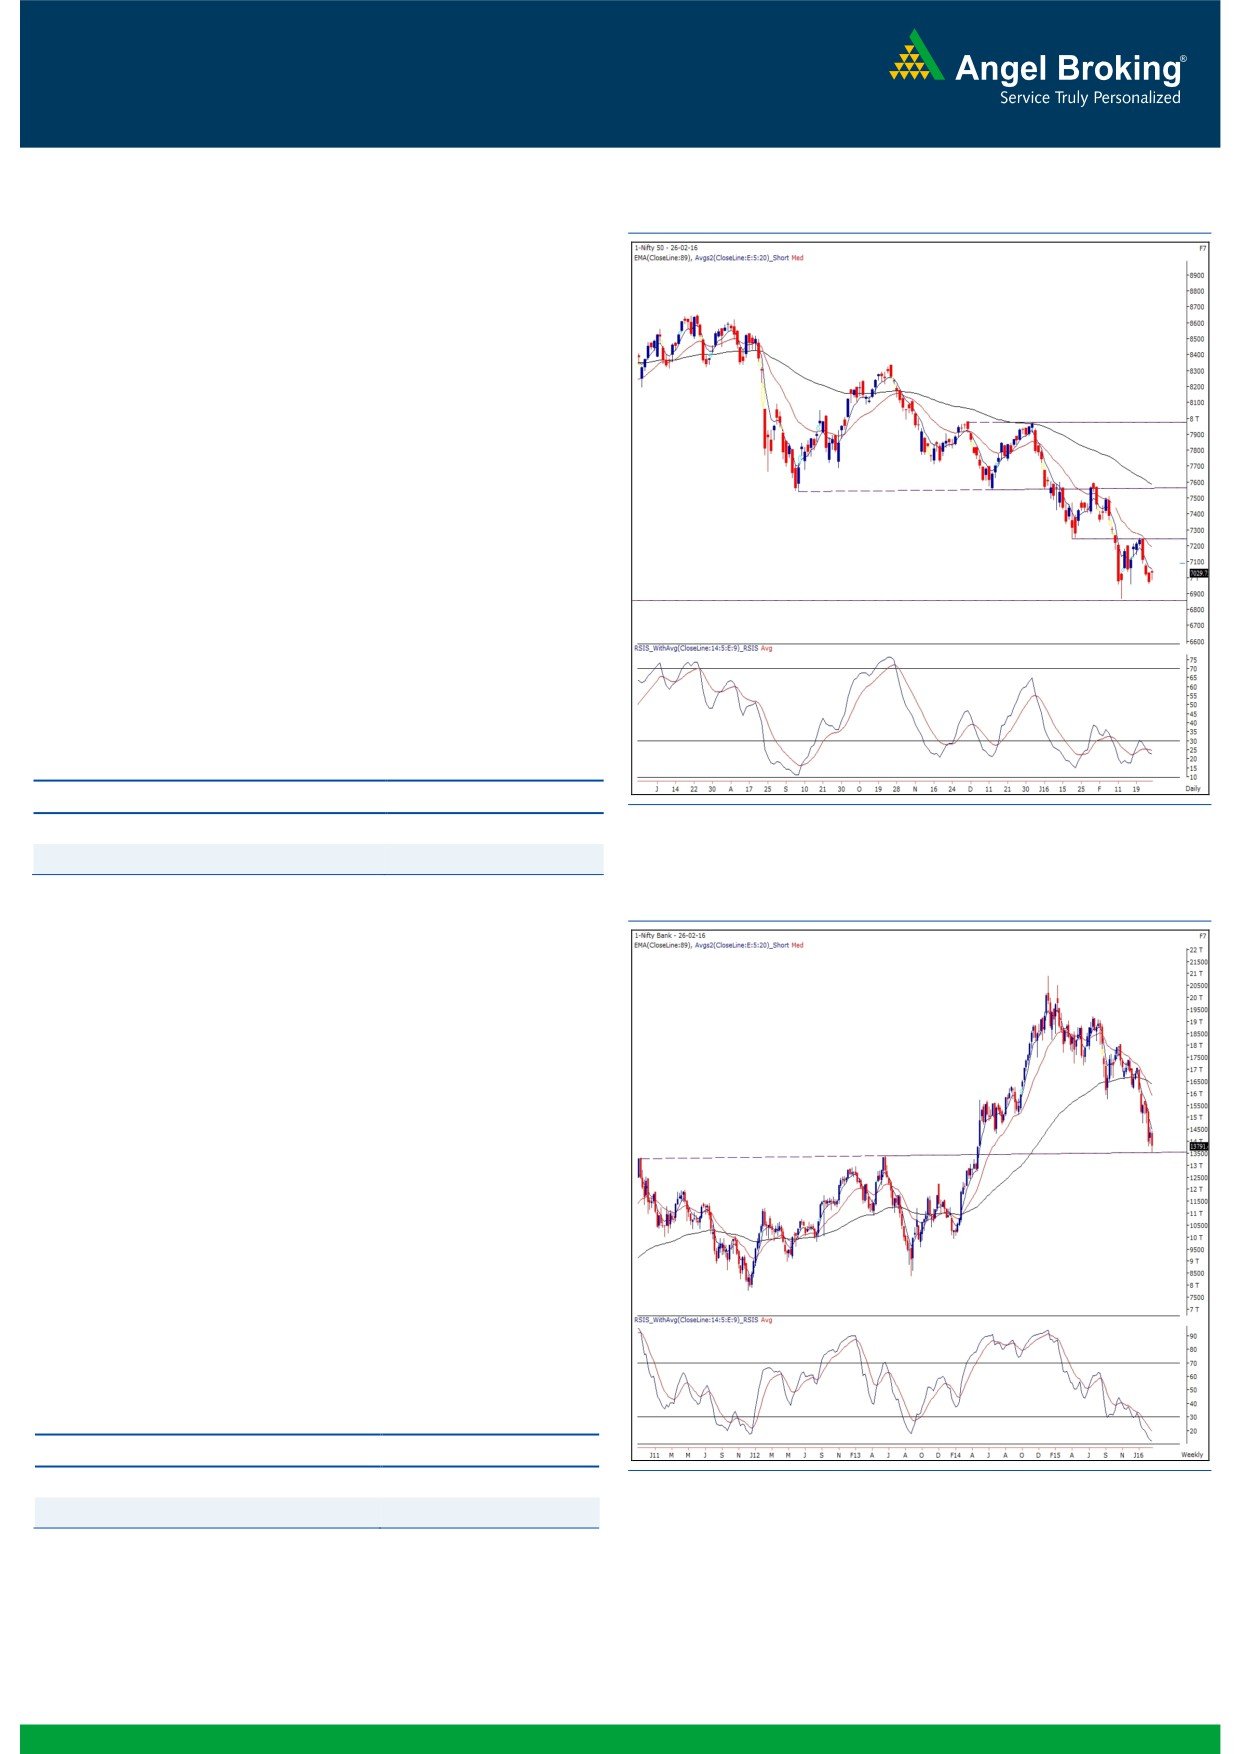
Exhibit 1: Nifty Daily Chart
On Friday, the Nifty opened with the gain of around a percent
on back of positive cues from global bourses. After minor
intraday correction, the index again rebounded from lower
levels and ended the session with gains of 0.85 percent.
As mentioned in our previous report too, the index has strong
support at 6960 levels and it managed to safeguard that on
Friday. This level is important because the hourly ‘Higher Top
Higher Bottom’ remains intact as long as the Nifty remains
above this support. Going forward, if the Nifty manages to
stay beyond 7052.90 then we may expect it to retest 7200 -
7252 levels. In the forthcoming week, a trend deciding level
on the upside would be 7252; whereas, on the downside,
6960 and
6869 are seen as crucial support levels.
Considering the higher volatility due to Union Budget, traders
should stay light on positions pre-announcement and then
look to assess the situation post the event to get a directional
cue for the near term.
Key Levels
Support 1 - 6960
Resistance 1 - 7053
Support 2 - 6920
Resistance 2 -
7100
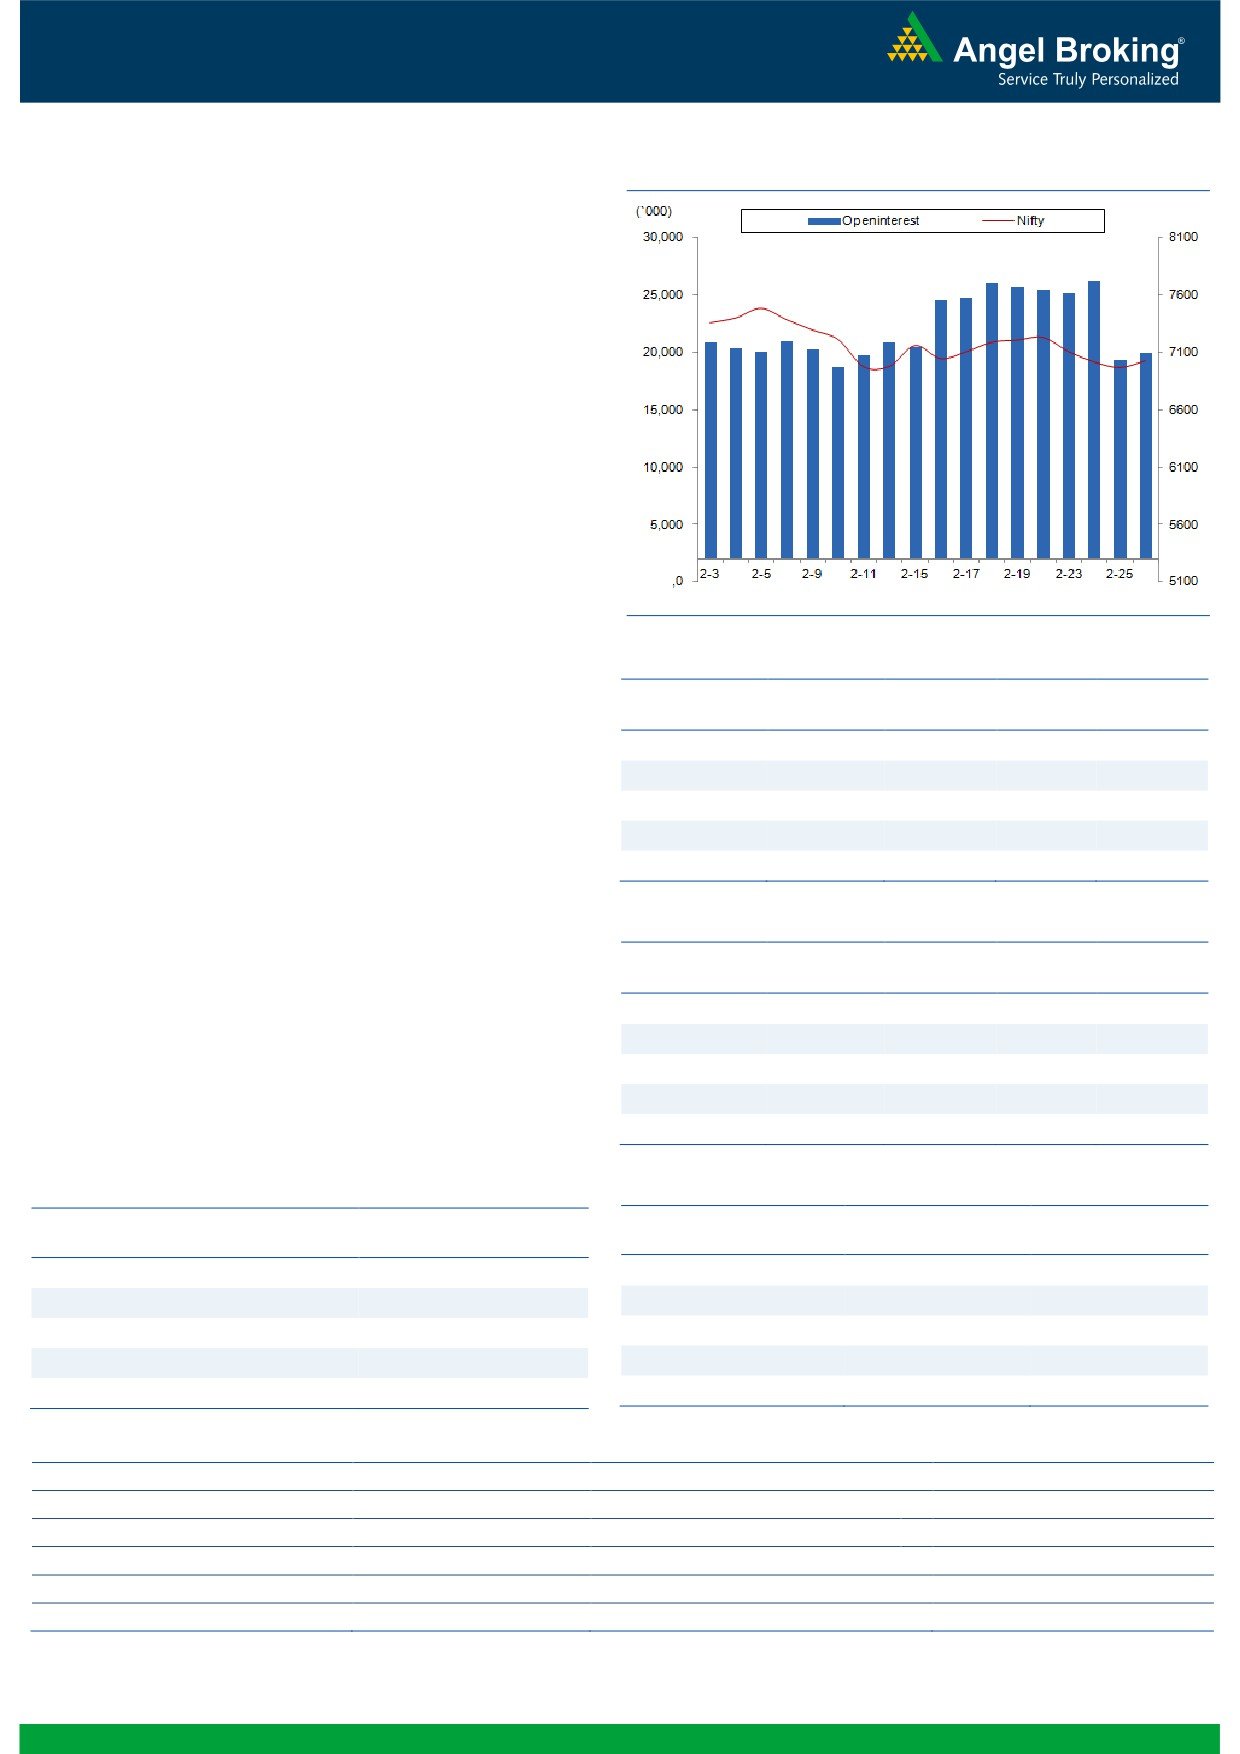
Exhibit 2: Bank Nifty Weekly Chart
Bank Nifty Outlook - (13791)
In-line with the benchmark indices, the Nifty Bank index too
opened with the gains of more than a percent on Friday. Post
some corrective action in initial hour of trading, the banking
index started moving higher and breached Thursday’s high
with an ease. Eventually, Nifty Bank index ended the session
with gains of 1.74 percent over its previous close.
At current juncture, the index is trading around its crucial
support of the important highs of November 2010 and May
2013, which is placed in range of 13300 to 13415. On
Friday, we witnessed a formation of a ‘Harami’ Pattern
formation in daily chart, formation of such pattern around
support zone can be a short term reversal trigger for the index.
However, the pattern needs a close above 13890 to get
activated. Going forward, immediate resistances for short term
trading are seen around 13890 - 14180.
Key Levels
Support 1 - 13520
Resistance 1 - 13890
Support 2 - 13415
Resistance 2 - 14180
1
Technical & Derivatives Report
February 29, 2016
Comments
Nifty Vs OI
The Nifty futures open interest has increased by 3.33%
BankNifty futures open interest has decreased by 3.63%
as market closed at 7029.75 levels.
The Nifty March future closed at a premium of 25.40
points against a premium of 30.50 points. The April
series closed at a premium of 54.35 points.
The Implied Volatility of at the money options has
decreased from 21.08% to 19.64%.
The total OI of the market is Rs. 1,68,030/- cr. and the
stock futures OI is Rs. 50,078/- cr.
Few of the liquid counters where we have seen high cost
of carry are GMRINFRA, UNITECH, ADANIENT,
JISLJALEQS and IBREALEST.
Views
FIIs sold equities to the tune of Rs. 695 crores. While in
OI Gainers
Index Futures, they bought of worth Rs. 734 crores with
OI
PRICE
SCRIP
OI
PRICE
marginal change in open interest, indicating blend to
CHG. (%)
CHG. (%)
both long formation and short covering in last trading
ARVIND
3369400
18.26
256.75
-2.87
session.
JISLJALEQS
47064000
17.54
56.60
2.72
In Index Options front, FIIs were net buyers of Rs. 311
BEML
500500
10.00
952.80
-2.11
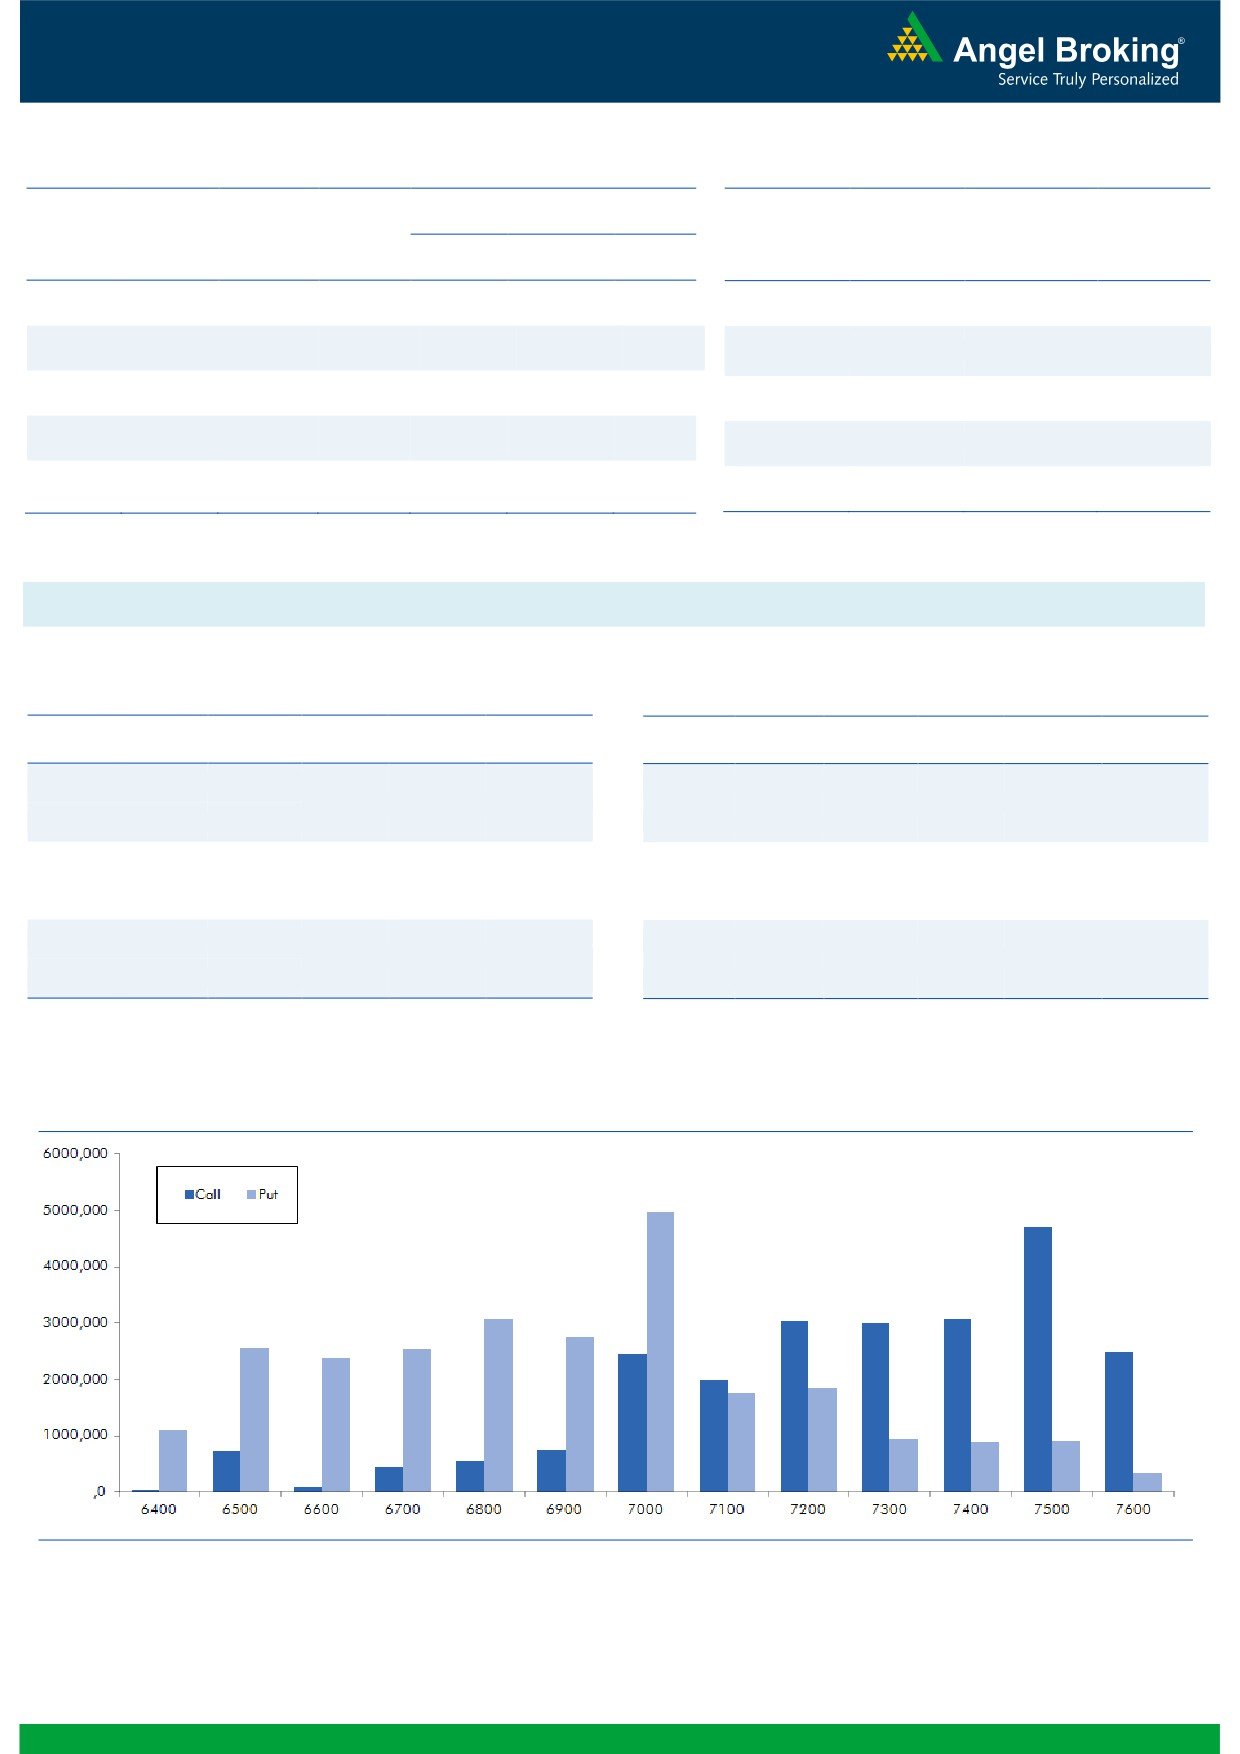
crores with significant rise in OI. In call options, 7100-
INFRATEL
3888300
9.72
367.70
1.14
7500 strikes were quite active and they
also added fresh
RPOWER
58248000
8.23
44.80
1.01
build-up.
7500 call options added significant OI.
Whereas, in put options, 6500, 6900and 7000 strikes
OI Losers
added some fresh build-up. Maximum OI in current
OI
PRICE
SCRIP
OI
PRICE
series is visible in 7500 call and 7000 put options. Last
CHG. (%)
CHG. (%)
series we hardly saw any meaningful activity in Nifty in
SYNDIBANK
8395000
-6.98
51.55
2.28
terms of OI. Correction of 6% in Nifty last series wasn’t
PIDILITIND
732000
-5.91
585.30
-3.10
supported by any relevant shorts. We believe Nifty may
NHPC
28485000
-5.04
19.80
0.51
show strength from current levels, trade with a positive
HINDZINC
1814400
-4.55
163.65
-0.76
bias.
KOTAKBANK
8003800
-2.90
618.70
1.17
Historical Volatility
Put-Call Ratio
SCRIP
HV
SCRIP
PCR-OI
PCR-VOL
DHFL
65.28
NIFTY
0.82
0.71
BAJAJ-AUTO
35.31
BANKNIFTY
0.94
0.65
LICHSGFIN
52.66
SBIN
0.63
0.36
HDFCBANK
26.05
RELIANCE
1.03
0.63
COALINDIA
49.34
ICICIBANK
0.62
0.45
Strategy Date
Symbol
Strategy
Status
2
Technical & Derivatives Report
February 29, 2016
FII Statistics for 26-February 2016
Turnover on 26-February 2016
Open Interest
No. of
Turnover
Change
Detail
Buy
Sell
Net
Instrument
Value
Change
Contracts
( in Cr. )
(%)
Contracts
(in Cr.)
(%)
INDEX
INDEX
2121.73
1387.25
734.48
237002
11918.36
0.56
304351
14732.08
-51.95
FUTURES
FUTURES
INDEX
INDEX
21061.65
20749.97
311.68
862300
45189.50
10.39
2043851
107141.34
-78.21
OPTIONS
OPTIONS
STOCK
3535.99
2868.25
667.74
1061436
44262.92
1.25
STOCK
FUTURES
456505
19071.12
-66.46
FUTURES
STOCK
1514.3
STOCK
1215.15
1203.68
11.47
19518
798.69
OPTIONS
9
171998
7528.68
-54.30
OPTIONS
TOTAL
27934.53
26209.15
1725.38
2180256
102169.47
5.51
TOTAL
2976705
148473.23
-75.07
Nifty Spot = 7029.75
Lot Size = 75
Bull-Call Spreads
Bear-Put Spreads
Action
Strike
Price
Risk
Reward
BEP
Action
Strike
Price
Risk
Reward
BEP
Buy
7100
146.20
Buy
7000
149.30
44.85
55.15
7144.85
35.45
64.55
6964.55
Sell
7200
101.35
Sell
6900
113.85
Buy
7100
146.20
Buy
7000
149.30
79.50
120.50
7179.50
63.75
136.25
6936.25
Sell
7300
66.70
Sell
6800
85.55
Buy
7200
101.35
Buy
6900
113.85
34.65
65.35
7234.65
28.30
71.70
6871.70
Sell
7300
66.70
Sell
6800
85.55
Note: Above mentioned Bullish or Bearish Spreads in Nifty (March Series) are given as an information and not as a recommendation.
Nifty Put-Call Analysis
3
Technical & Derivatives Report
February 29, 2016
Daily Pivot Levels for Nifty 50 Stocks
Scrips
S2
S1
PIVOT
R1
R2
ACC
1,166
1,179
1,194
1,207
1,223
ADANIPORTS
193
196
200
204
208
AMBUJACEM
183
186
189
192
195
ASIANPAINT
844
853
864
873
883
AXISBANK
378
382
386
390
394
BAJAJ-AUTO
2,141
2,189
2,271
2,319
2,401
BANKBARODA
124
128
131
136
139
BHARTIARTL
312
315
320
323
328
BHEL
92
94
95
97
98
BOSCHLTD
16,318
16,514
16,647
16,843
16,976
BPCL
737
751
764
778
791
CAIRN
119
122
123
125
127
CIPLA
515
519
524
528
532
COALINDIA
297
304
309
316
320
DRREDDY
2,920
2,957
2,993
3,031
3,067
GAIL
292
298
304
310
316
GRASIM
3,196
3,248
3,285
3,337
3,374
HCLTECH
806
815
824
833
842
HDFC
1,043
1,048
1,054
1,059
1,064
HDFCBANK
933
947
959
973
985
HEROMOTOCO
2,461
2,508
2,579
2,626
2,697
HINDALCO
65
67
69
71
72
HINDUNILVR
836
843
848
855
859
ICICIBANK
179
182
184
187
189
IDEA
102
104
105
107
108
INDUSINDBK
808
812
817
822
827
INFY
1,107
1,114
1,123
1,130
1,139
ITC
283
287
289
294
296
KOTAKBANK
600
608
615
623
629
LT
1,082
1,096
1,107
1,121
1,132
LUPIN
1,676
1,701
1,744
1,769
1,812
M&M
1,215
1,223
1,235
1,243
1,255
MARUTI
3,330
3,370
3,414
3,454
3,498
NTPC
117
119
121
123
124
ONGC
212
214
216
218
221
PNB
71
72
72
73
74
POWERGRID
130
132
134
136
138
RELIANCE
937
944
951
958
966
SBIN
150
153
156
159
162
VEDL
68
70
71
73
74
SUNPHARMA
856
864
877
885
898
TATAMOTORS
294
298
302
305
309
TATAPOWER
57
57
58
58
59
TATASTEEL
239
244
248
252
256
TCS
2,165
2,188
2,222
2,245
2,280
TECHM
404
411
418
425
432
ULTRACEMCO
2,700
2,736
2,785
2,821
2,870
WIPRO
518
524
533
539
548
YESBANK
659
673
682
696
706
ZEEL
371
376
381
386
391
4
Technical & Derivatives Report
February 29, 2016
Research Team Tel: 022 - 39357800
For Technical Queries
For Derivatives Queries
DISCLAIMER
Angel Broking Private Limited (hereinafter referred to as “Angel”) is a registered Member of National Stock Exchange of India Limited,
Bombay Stock Exchange Limited and MCX Stock Exchange Limited. It is also registered as a Depository Participant with CDSL and
Portfolio Manager with SEBI. It also has registration with AMFI as a Mutual Fund Distributor. Angel Broking Private Limited is a
registered entity with SEBI for Research Analyst in terms of SEBI (Research Analyst) Regulations, 2014 vide registration number
INH000000164. Angel or its associates has not been debarred/ suspended by SEBI or any other regulatory authority for accessing
/dealing in securities Market. Angel or its associates including its relatives/analyst do not hold any financial interest/beneficial
ownership of more than 1% in the company covered by Analyst. Angel or its associates/analyst has not received any compensation /
managed or co-managed public offering of securities of the company covered by Analyst during the past twelve months. Angel/analyst
has not served as an officer, director or employee of company covered by Analyst and has not been engaged in market making activity
of the company covered by Analyst.
This document is solely for the personal information of the recipient, and must not be singularly used as the basis of any investment
decision. Nothing in this document should be construed as investment or financial advice. Each recipient of this document should
make such investigations as they deem necessary to arrive at an independent evaluation of an investment in the securities of the
companies referred to in this document (including the merits and risks involved), and should consult their own advisors to determine
the merits and risks of such an investment.
Reports based on technical and derivative analysis center on studying charts of a stock's price movement, outstanding positions and
trading volume, as opposed to focusing on a company's fundamentals and, as such, may not match with a report on a company's
fundamentals.
The information in this document has been printed on the basis of publicly available information, internal data and other reliable
sources believed to be true, but we do not represent that it is accurate or complete and it should not be relied on as such, as this
document is for general guidance only. Angel Broking Pvt. Limited or any of its affiliates/ group companies shall not be in any way
responsible for any loss or damage that may arise to any person from any inadvertent error in the information contained in this report.
Angel Broking Pvt. Limited has not independently verified all the information contained within this document. Accordingly, we cannot
testify, nor make any representation or warranty, express or implied, to the accuracy, contents or data contained within this document.
While Angel Broking Pvt. Limited endeavors to update on a reasonable basis the information discussed in this material, there may be
regulatory, compliance, or other reasons that prevent us from doing so.
This document is being supplied to you solely for your information, and its contents, information or data may not be reproduced,
redistributed or passed on, directly or indirectly.
Neither Angel Broking Pvt. Limited, nor its directors, employees or affiliates shall be liable for any loss or damage that may arise from
or in connection with the use of this information.
Note: Please refer to the important ‘Stock Holding Disclosure' report on the Angel website (Research Section). Also, please refer to the
latest update on respective stocks for the disclosure status in respect of those stocks. Angel Broking Pvt. Limited and its affiliates may
have investment positions in the stocks recommended in this report.
5