Technical & Derivatives Report
December 28, 2016
Sensex (26213) / Nifty (8033)
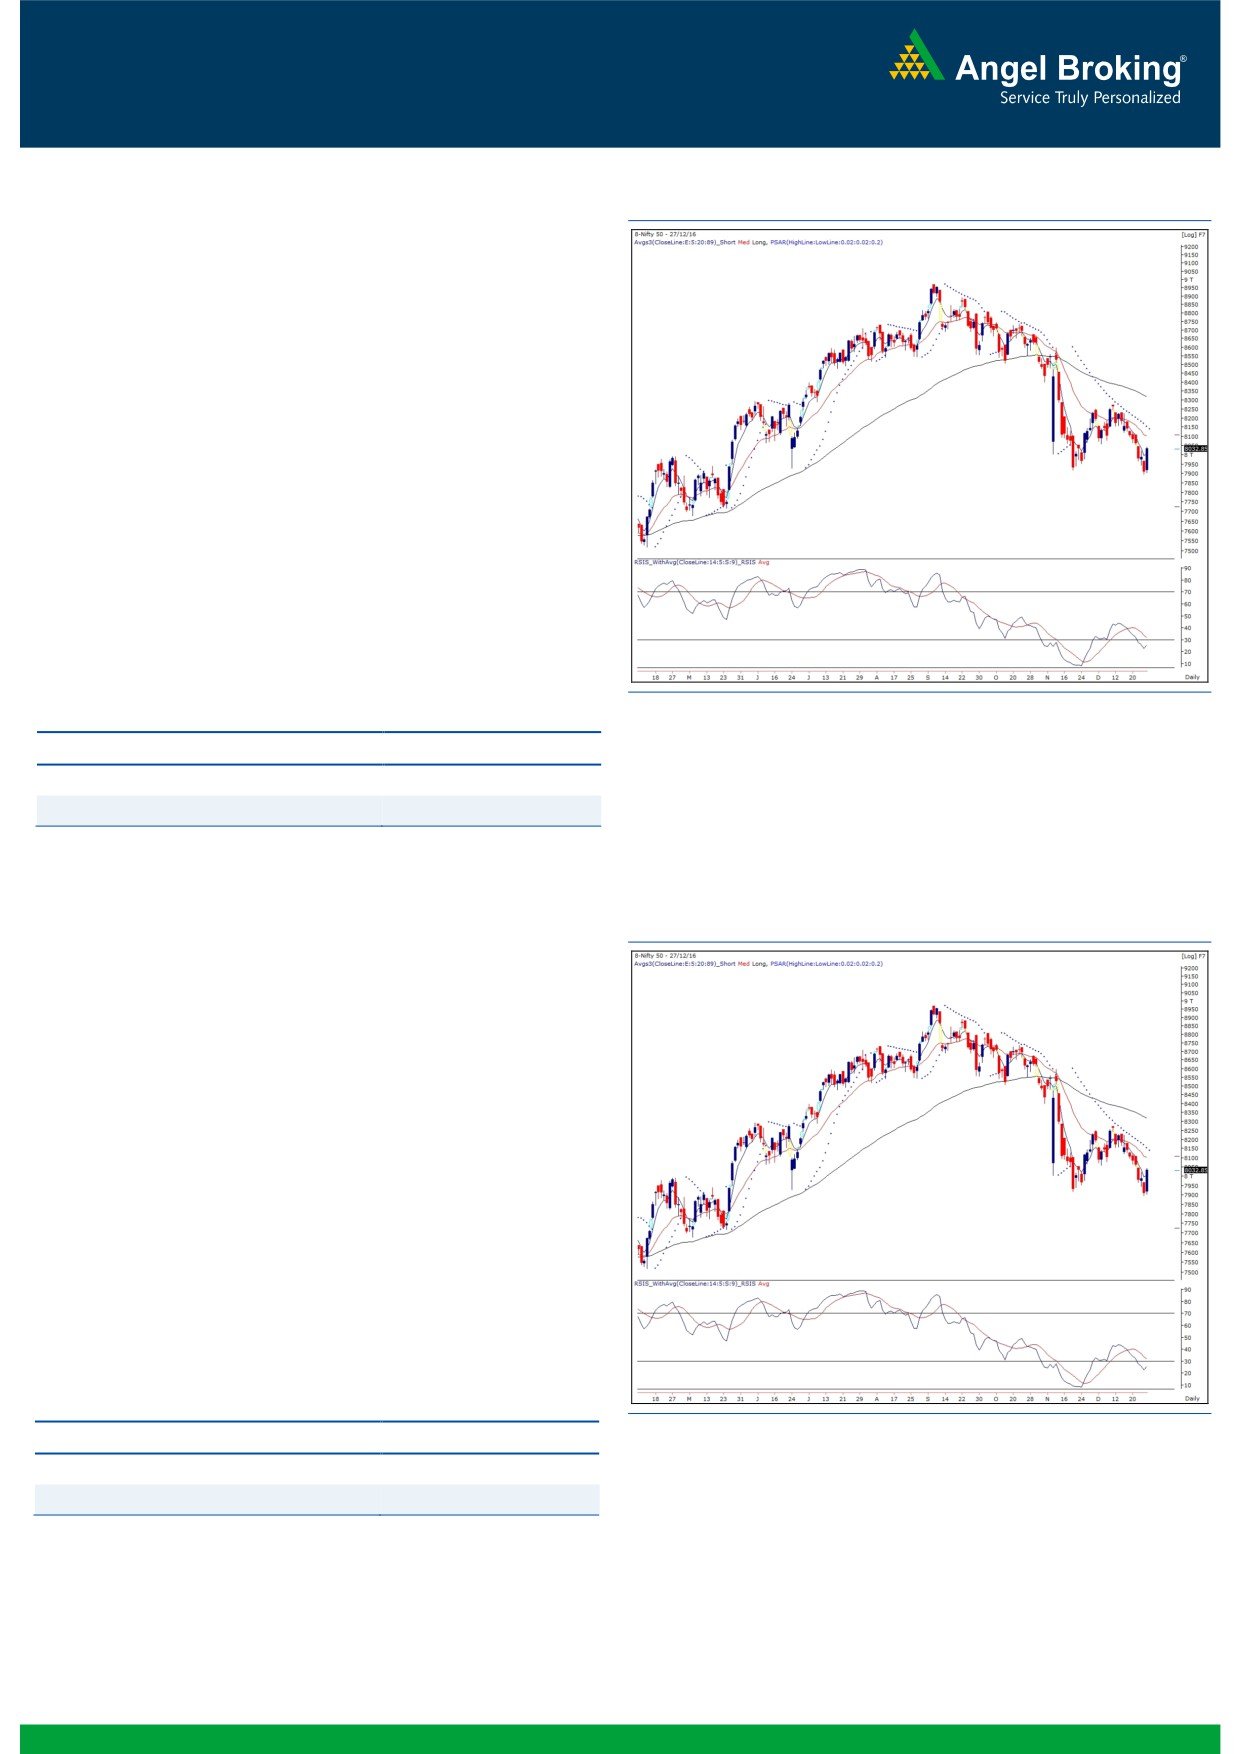
Exhibit 1: Nifty Daily Chart
It was a remarkable day for traders (especially bulls) as we not
only saw respite after a recent corrective move but also a
stupendous intraday recovery to reclaim the 8000 mark by a fair
margin. As a result, the Nifty posted a strong close by adding
nearly one and half a percent to its previous day’s close.
Looking at yesterday’s spectacular bounce, our recent stance of
avoiding initiating fresh shorts in the market has certainly played
out well for us. Now, 7900 has become a sacrosanct level in the
near term for the Nifty. For the forthcoming session, the hourly
’89 EMA’ level of 8060 would be seen as important resistance
level as a sustainable move beyond this may extend this bounce
back rally towards 8109 - 8127 levels. On the flipside, 8010 -
7970 are likely to act as intraday supports. Further, traders
should continue to look for potential long trades in individual
stocks similar to what we witnessed during yesterday’s session.
Key Levels
Support 1 - 8010
Resistance 1 - 8109
Support 2 - 7970
Resistance 2 - 8127
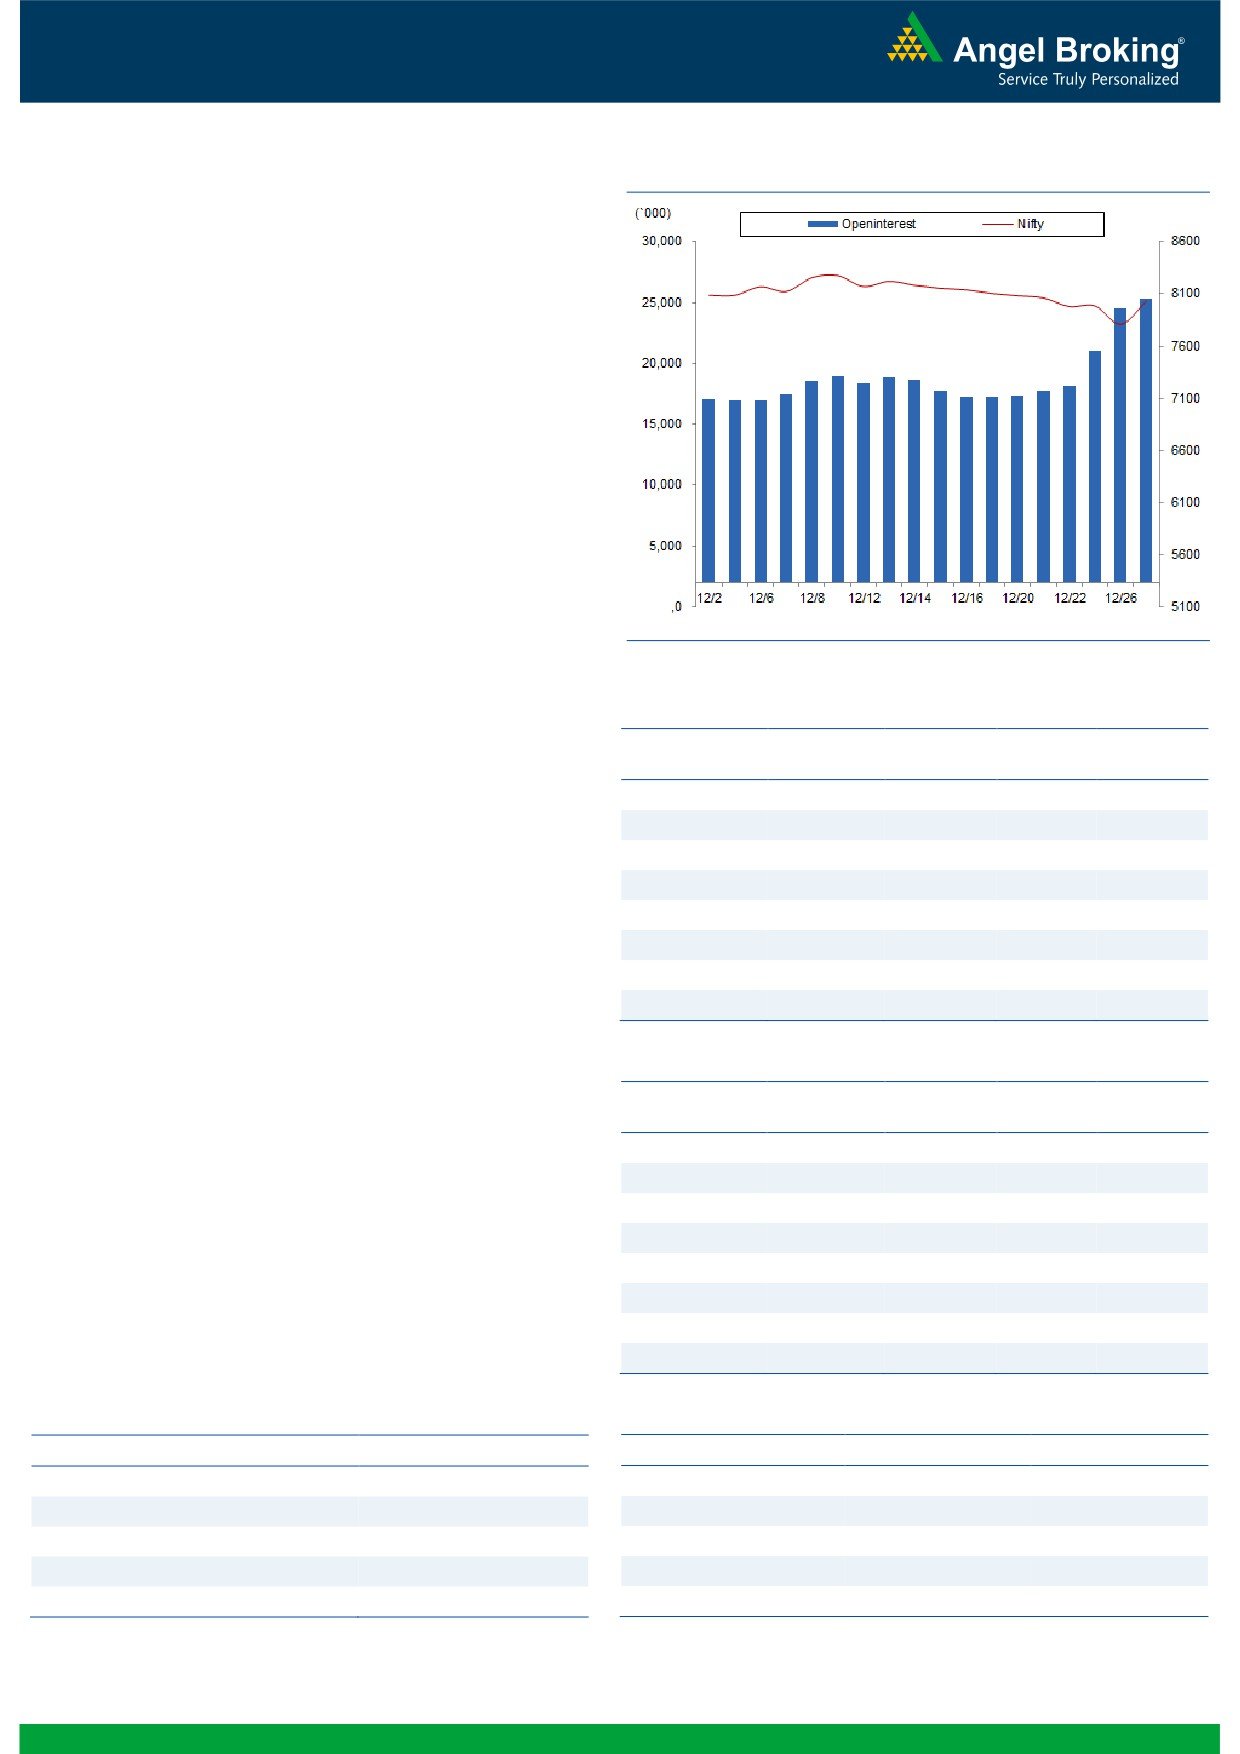
Nifty Bank Outlook - (17880)
Exhibit 2: Nifty Bank Daily Chart
Although the Nifty Bank index traded in a narrow range till noon,
it rallied higher along with the broader market in last couple of
hours and ended the session with gains of 1.27 percent over its
previous session's close.
As we had mentioned in our last couple of reports, the Nifty Bank
index was trading near the weekly '89EMA' support around
17600. The mentioned support played its role and the index
bounced back higher from the mentioned support. Considering
the positive momentum in yesterday's session, the intraday charts
are hinting at continuation of the up move up to 18075 in next
few sessions. Thus, short-term traders can trade with positive bias
for a target up to 18075. The intraday supports for the Nifty Bank
index are placed around 17780 and 17600 whereas resistances
are seen around 18010 and 18075.
Key Levels
Support 1 - 17780
Resistance 1 - 18010
Support 2 - 17600
Resistance 2 - 18075
1
Technical & Derivatives Report
December 28, 2016
Comments
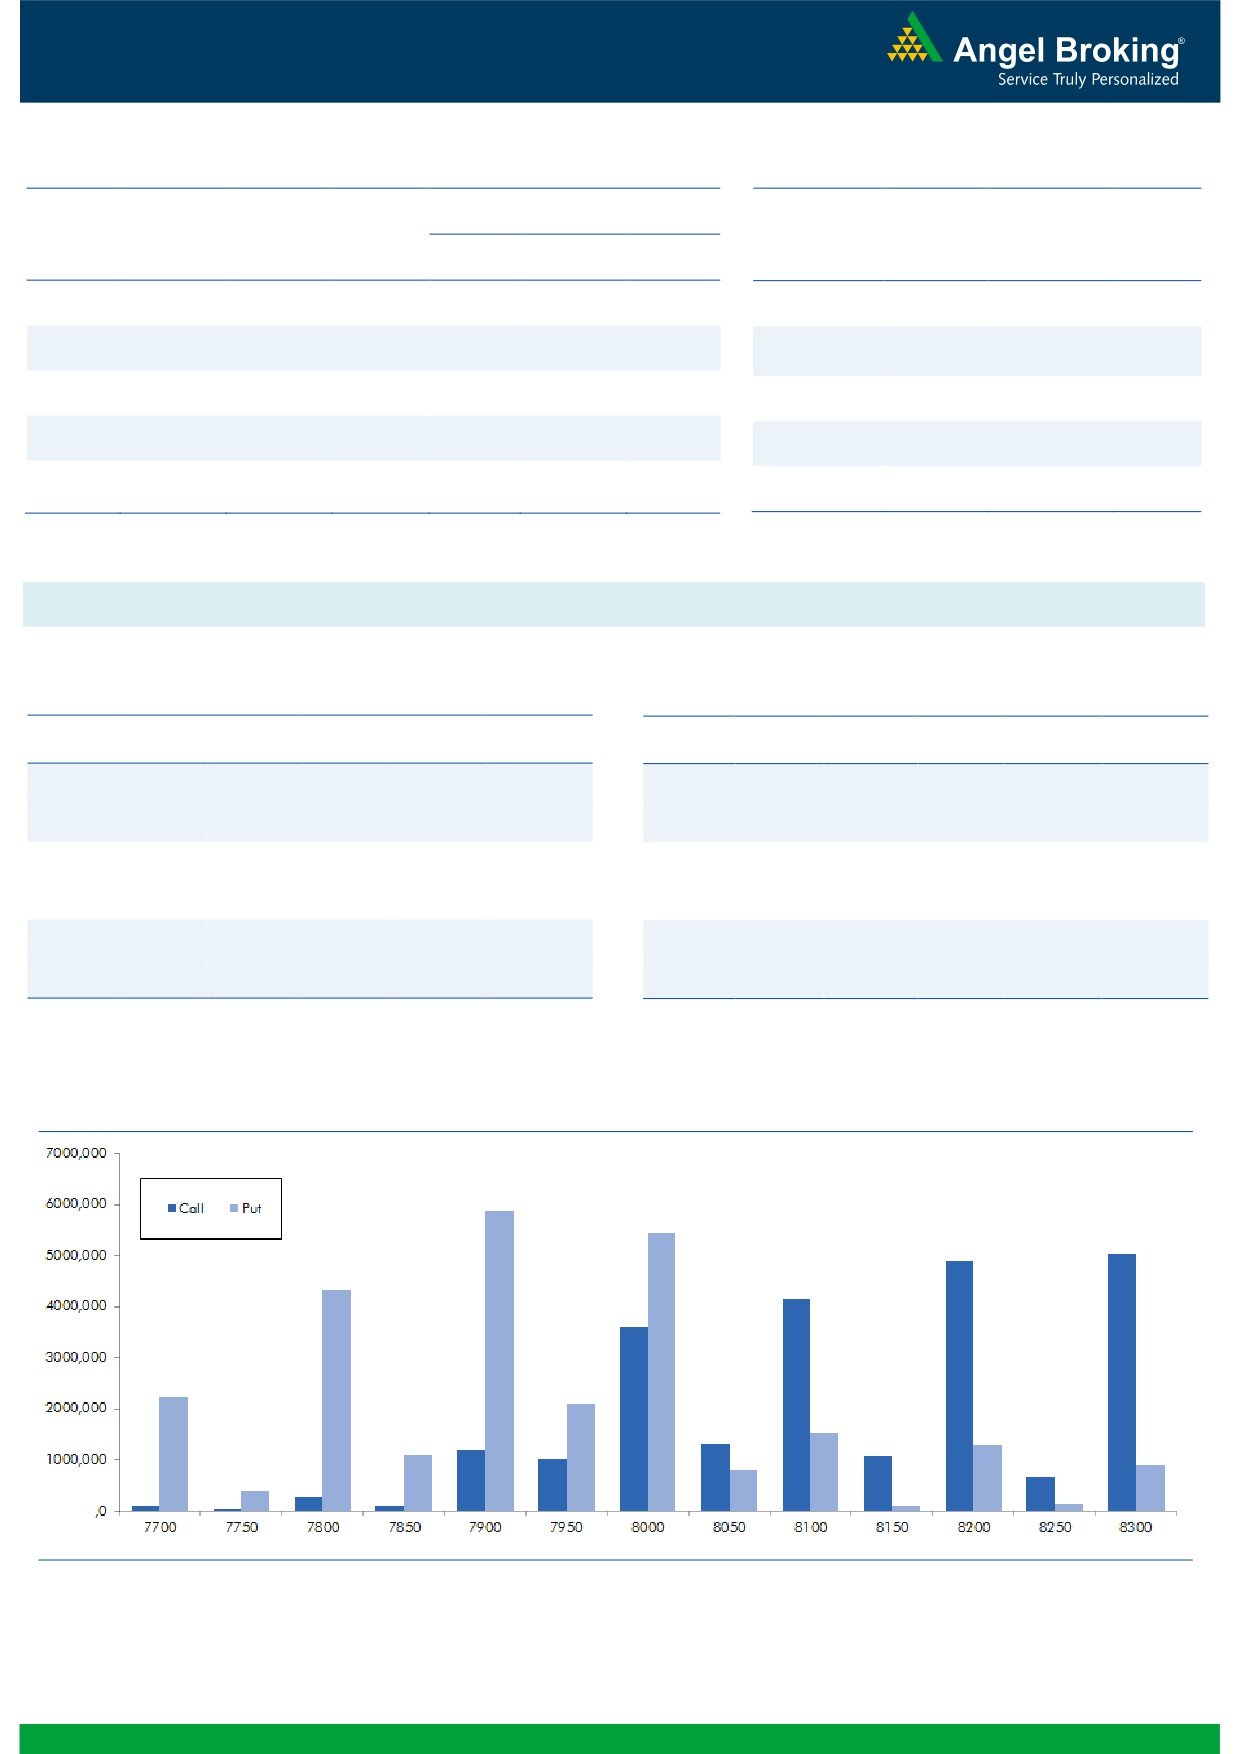
Nifty Vs OI
The Nifty futures open interest has increased by 3.40%
BankNifty futures open interest has decreased by 4.40%
as market closed at 8032.85 levels.
The Nifty December future closed with a discount of 1.50
against the premium of 3.05 points in last trading
session. The January series closed at a premium of
27.15 points.
The Implied Volatility of at the money options has
decreased from 14.84 % to 14.45%. At the same time,
the PCR-OI of Nifty has increased from 0.83 to 0.95
levels.
The total OI of the market is Rs. 2,87,473/- cr. and the
stock futures OI is Rs. 75,519/- cr.
Few of the liquid counters where we have seen high cost
of carry are JINDALSTEL, GMRINFRA, MINDTREE, IDBI
and WOCKPHARMA.
Views
OI Gainers
FIIs were net sellers in both cash market segment and
OI
PRICE
index futures. They sold equities to the tune of Rs. 712 cr.
SCRIP
OI
PRICE
CHG. (%)
CHG. (%)
While in index futures, they were net sellers worth Rs.
CEATLTD
1998500
19.26
1144.60
0.65
445 cr with significant rise in open interest, indicating
INDUSINDBK
5856600
17.19
1064.45
0.39
formation of both long and short positions. However,
IBREALEST
35980000
17.08
69.85
0.29
roking.com
majority of the positions formed were on short side.
ENGINERSIN
9667000
16.79
315.25
5.05
In index option segment, FIIs bought worth Rs. 1460 cr
BANKBARODA
58898000
15.98
150.10
1.62
with some rise change in open interest. In call options,
ADANIENT
16888000
15.10
71.05
1.86
we hardly saw any relevant OI addition. However,
AMBUJACEM
16085000
14.46
202.70
2.32
significant amount of unwinding was seen in 7900-8000
WIPRO
8093000
12.83
465.15
1.88
and 8100 call options. While in put options, 8000 strike
added significant build-up and we believe these are long
OI Losers
positions formed by weaker hands. Highest OI in current
OI
PRICE
series is now placed at 8300 call and 7900 put option.
SCRIP
OI
PRICE
CHG. (%)
CHG. (%)
Since past four trading session, we are witnessing
UNIONBANK
21084000
-12.80
123.65
2.78
significant open interest addition in Index Futures, which
TORNTPHARM
254400
-10.04
1289.95
2.17
are blend of both long and short positions. While in cash
VOLTAS
5224000
-9.81
317.30
3.17
segment FIIs continue their selling. Taking into
ACC
1464400
-9.56
1296.65
1.10
consideration the above data, we are unable to get any
IDBI
34016000
-8.32
67.20
1.82
clarity on direction front. Thus, traders are suggested to
ICIL
3660500
-8.07
154.40
0.92
remain light in Index and prefer stock specific approach
JETAIRWAYS
5975000
-7.76
344.00
1.01
to trade as of now.
BIOCON
3169000
-6.92
918.45
2.55
Historical Volatility
Put-Call Ratio
SCRIP
HV
SCRIP
PCR-OI
PCR-VOL
IDFCBANK
55.01
NIFTY
0.95
0.86
ITC
32.47
BANKNIFTY
1.03
0.85
DABUR
33.01
SUNPHARMA
0.42
0.48
TVSMOTOR
36.93
SBIN
0.49
0.40
ENGINERSIN
56.08
INFY
0.64
0.70
2
Technical & Derivatives Report
December 28, 2016
FII Statistics for December 27, 2016
Turnover on December 27, 2016
Open Interest
No. of
Turnover
Change
Detail
Buy
Sell
Net
Instrument
Value
Change
Contracts
( in Cr. )
(%)
Contracts
(in Cr.)
(%)
INDEX
INDEX
5083.95
5528.77
(444.82)
290147
17918.93
10.35
349972
21993.28
34.29
FUTURES
FUTURES
INDEX
INDEX
40807.71
39347.48
1460.23
1187081
72901.31
1.42
5899340
371346.73
19.90
OPTIONS
OPTIONS
STOCK
20712.98
19897.80
815.18
978039
57479.74
2.60
STOCK
FUTURES
1041235
62785.65
24.02
FUTURES
STOCK
STOCK
3940.48
3985.75
(45.26)
95756
5964.26
1.17
OPTIONS
371548
24830.07
1.12
OPTIONS
TOTAL
70545.12
68759.80
1785.33
2551023
154264.24
2.81
TOTAL
7662095
480955.72
19.86
Nifty Spot = 8032.85
Lot Size = 75
Bull-Call Spreads
Bear-Put Spreads
Action
Strike
Price
Risk
Reward
BEP
Action
Strike
Price
Risk
Reward
BEP
Buy
8000
55.90
Buy
8000
24.30
43.00
57.00
8043.00
16.55
83.45
7983.45
Sell
8100
12.90
Sell
7900
7.75
Buy
8000
55.90
Buy
8000
24.30
52.95
147.05
8052.95
21.40
178.60
7978.60
Sell
8200
2.95
Sell
7800
2.90
Buy
8100
12.90
Buy
7900
7.75
9.95
90.05
8109.95
4.85
95.15
7895.15
Sell
8200
2.95
Sell
7800
2.90
Note: Above mentioned Bullish or Bearish Spreads in Nifty (December Series) are given as an information and not as a recommendation.
Nifty Put-Call Analysis
3
Technical & Derivatives Report
December 28, 2016
Daily Pivot Levels for Nifty Constituents
Scrips
S2
S1
PIVOT
R1
R2
ACC
1,273
1,284
1,290
1,301
1,308
ADANIPORTS
253
260
265
272
276
AMBUJACEM
196
200
201
205
207
ASIANPAINT
858
867
872
881
887
AUROPHARMA
613
629
639
655
665
AXISBANK
428
433
436
441
444
BAJAJ-AUTO
2,542
2,588
2,616
2,662
2,690
BANKBARODA
144
147
149
152
154
BHEL
115
117
118
121
122
BPCL
595
606
611
621
627
BHARTIARTL
288
294
297
303
307
INFRATEL
320
326
330
336
340
BOSCH
18,786
19,373
19,836
20,423
20,886
CIPLA
551
557
562
568
573
COALINDIA
279
284
287
292
295
DRREDDY
2,962
2,999
3,019
3,056
3,076
EICHERMOT
20,070
20,385
20,608
20,923
21,146
GAIL
415
420
425
430
435
GRASIM
791
801
810
821
830
HCLTECH
778
791
801
814
823
HDFCBANK
1,169
1,177
1,182
1,190
1,195
HDFC
1,201
1,217
1,227
1,242
1,252
HEROMOTOCO
2,924
2,980
3,013
3,069
3,103
HINDALCO
145
150
153
159
162
HINDUNILVR
792
799
804
811
816
ICICIBANK
244
249
252
256
259
IDEA
67
69
70
71
72
INDUSINDBK
1,044
1,054
1,061
1,070
1,077
INFY
972
985
994
1,007
1,016
ITC
221
227
231
238
242
KOTAKBANK
701
707
711
717
722
LT
1,318
1,337
1,348
1,367
1,378
LUPIN
1,386
1,416
1,434
1,464
1,483
M&M
1,130
1,149
1,160
1,179
1,190
MARUTI
5,073
5,148
5,193
5,269
5,313
NTPC
159
159
160
161
162
ONGC
186
188
190
192
193
POWERGRID
175
178
180
183
185
RELIANCE
1,040
1,052
1,060
1,072
1,080
SBIN
240
245
247
251
254
SUNPHARMA
609
615
619
625
628
TCS
2,263
2,293
2,312
2,342
2,360
TATAMTRDVR
285
291
295
301
305
TATAMOTORS
453
460
464
471
476
TATAPOWER
72
73
73
74
75
TATASTEEL
371
382
388
399
406
TECHM
453
461
467
475
481
ULTRACEMCO
3,010
3,083
3,124
3,197
3,238
WIPRO
450
458
462
469
474
YESBANK
1,087
1,107
1,120
1,141
1,154
ZEEL
427
432
435
440
443
4
Technical & Derivatives Report
December 28, 2016
Research Team Tel: 022 - 39357800
For Technical Queries
For Derivatives Queries
DISCLAIMER
Angel Broking Private Limited (hereinafter referred to as “Angel”) is a registered Member of National Stock Exchange of India Limited,
Bombay Stock Exchange Limited and Metropolitan Stock Exchange Limited. It is also registered as a Depository Participant with CDSL
and Portfolio Manager with SEBI. It also has registration with AMFI as a Mutual Fund Distributor. Angel Broking Private Limited is a
registered entity with SEBI for Research Analyst in terms of SEBI (Research Analyst) Regulations, 2014 vide registration number
INH000000164. Angel or its associates has not been debarred/ suspended by SEBI or any other regulatory authority for accessing
/dealing in securities Market. Angel or its associates/analyst has not received any compensation / managed or co-managed public
offering of securities of the company covered by Analyst during the past twelve months.
This document is solely for the personal information of the recipient, and must not be singularly used as the basis of any investment
decision. Nothing in this document should be construed as investment or financial advice. Each recipient of this document should
make such investigations as they deem necessary to arrive at an independent evaluation of an investment in the securities of the
companies referred to in this document (including the merits and risks involved), and should consult their own advisors to determine
the merits and risks of such an investment.
Reports based on technical and derivative analysis center on studying charts of a stock's price movement, outstanding positions and
trading volume, as opposed to focusing on a company's fundamentals and, as such, may not match with a report on a company's
fundamentals. Investors are advised to refer the Fundamental and Technical Research Reports available on our website to evaluate the
contrary view, if any.
The information in this document has been printed on the basis of publicly available information, internal data and other reliable
sources believed to be true, but we do not represent that it is accurate or complete and it should not be relied on as such, as this
document is for general guidance only. Angel Broking Pvt. Limited or any of its affiliates/ group companies shall not be in any way
responsible for any loss or damage that may arise to any person from any inadvertent error in the information contained in this report.
Angel Broking Pvt. Limited has not independently verified all the information contained within this document. Accordingly, we cannot
testify, nor make any representation or warranty, express or implied, to the accuracy, contents or data contained within this document.
While Angel Broking Pvt. Limited endeavors to update on a reasonable basis the information discussed in this material, there may be
regulatory, compliance, or other reasons that prevent us from doing so.
This document is being supplied to you solely for your information, and its contents, information or data may not be reproduced,
redistributed or passed on, directly or indirectly.
Neither Angel Broking Pvt. Limited, nor its directors, employees or affiliates shall be liable for any loss or damage that may arise from
or in connection with the use of this information.
5