Technical & Derivatives Report
October 28, 2015
Sensex (27253) / Nifty (8233)
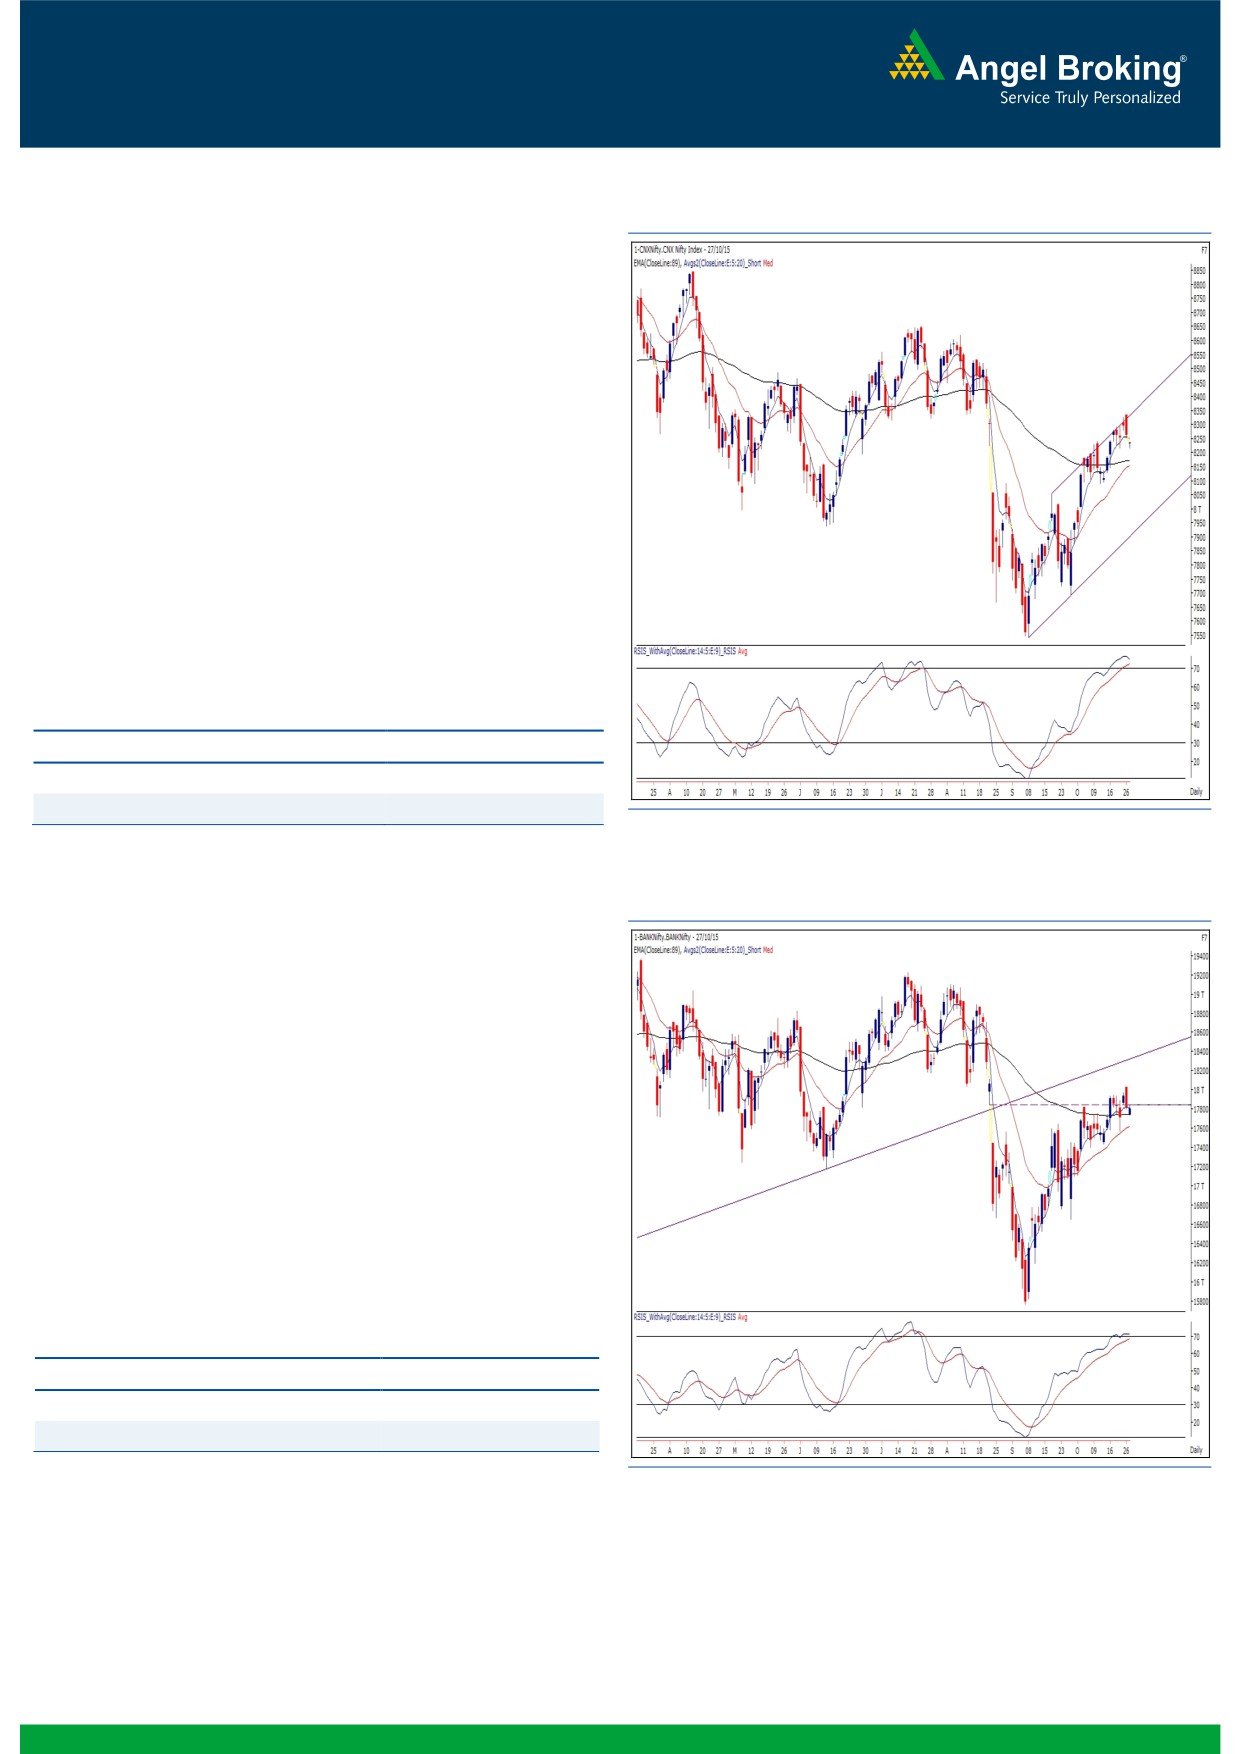
Exhibit 1: Nifty Daily Chart
Yesterday, our benchmark index opened lower tracking weak
global bourses. Subsequently, we witnessed a very thin trading
range throughout the session to end the session tad below the
8250 mark.
Technically speaking, we do not see any major change in the
chart structure due to very lethargic movement and narrow
trading range. Thus, we continue to expect a range bound
movement within the range of 8350 to 8170 for next couple of
days atleast. In order to form a directional view on the index, we
need to wait for further developments to happen on the chart.
Until then we continue to recommend a stock centric approach
with proper exits. Going forward, the intraday resistance for the
Nifty is placed at 8270 - 8300 levels; whereas, 8200 - 8170
levels would now act as an immediate support zone for the index.
Key Levels
Support 1 - 8200
Resistance 1 - 8270
Support 2 - 8170
Resistance 2 - 8300
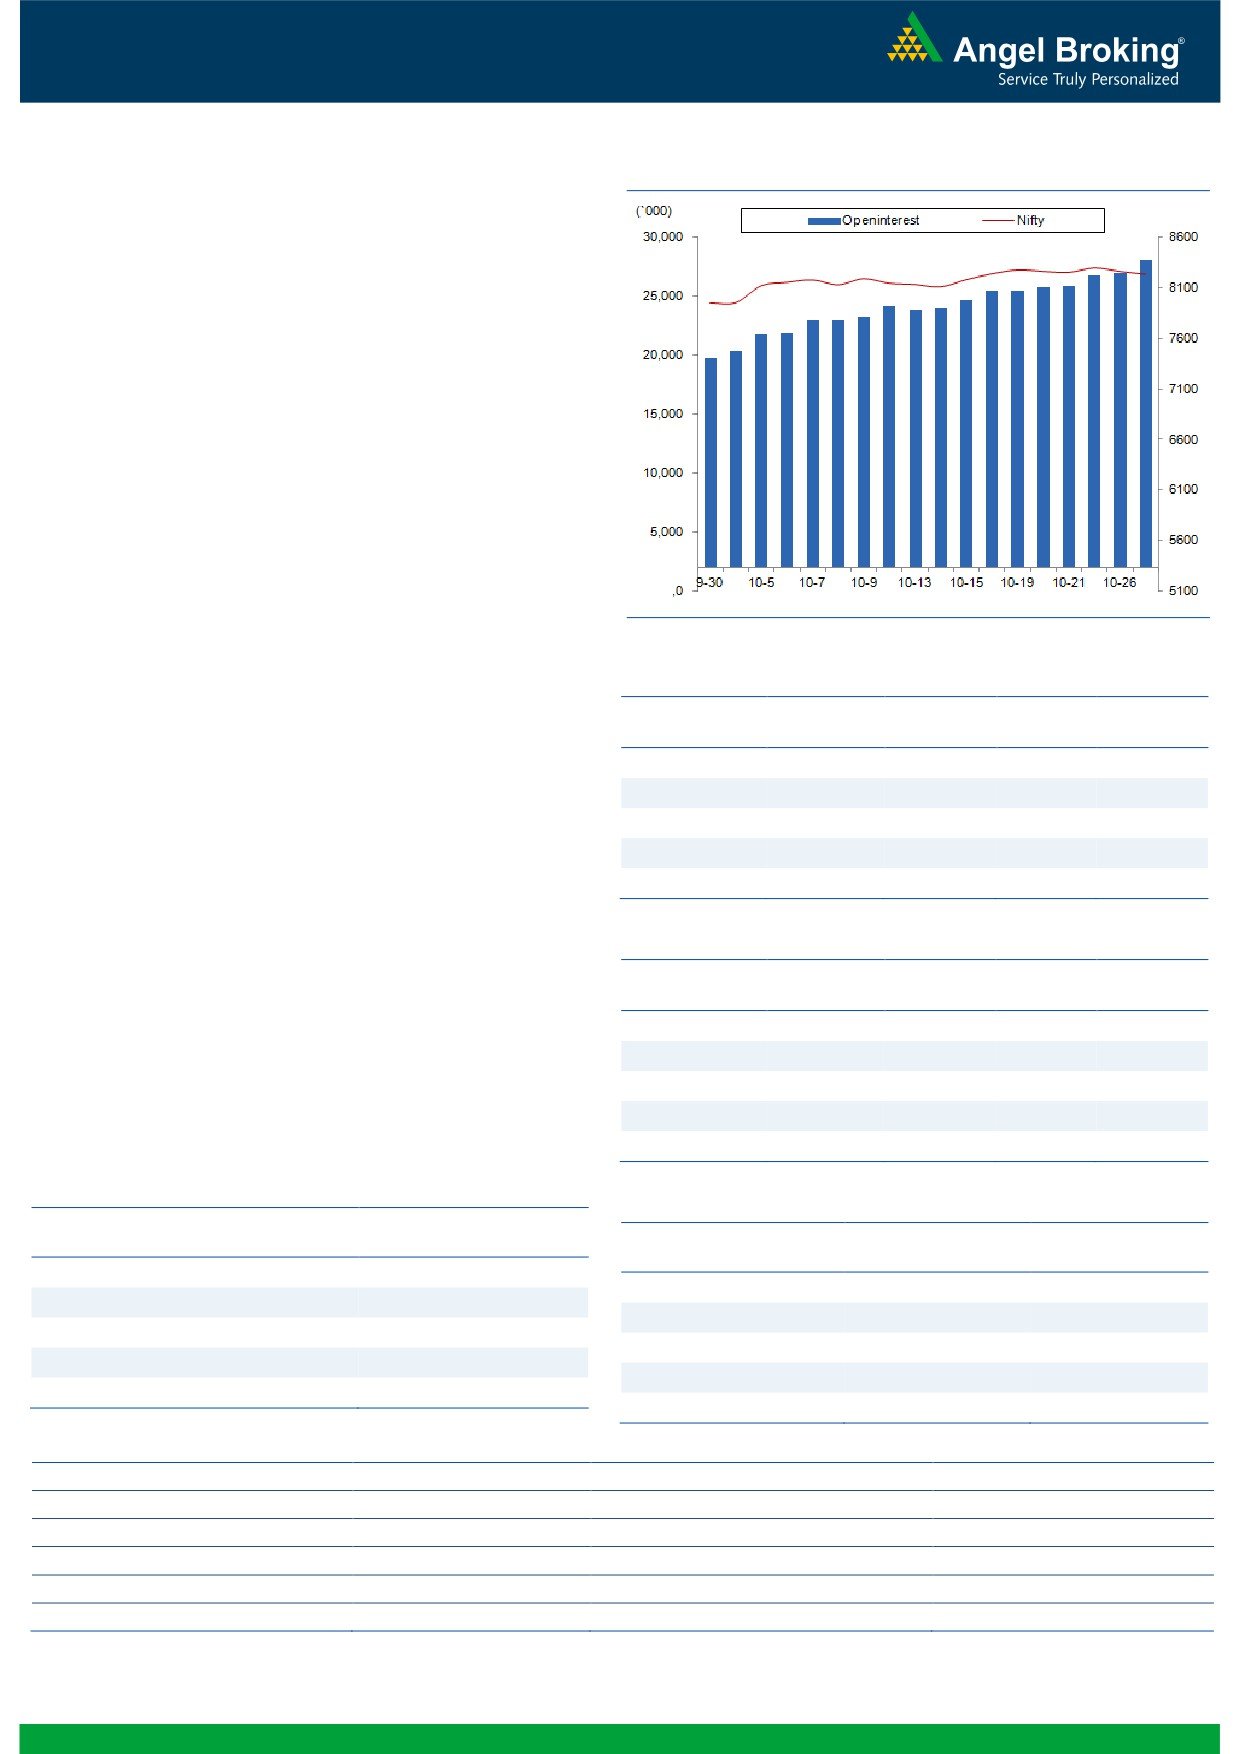
Exhibit 2: Bank Nifty Daily Chart
Bank Nifty Outlook - (17806)
Post the gap down opening, the Bank Nifty continued to trade in
a narrow range and ended the session on a flat note. Recently,
we observed a breakout in the index; but, the follow up buying
interest (momentum) was clearly missing. The index then formed
a bearish engulfing pattern on Monday; but, this time, the bears
failed to keep the momentum on the downside. This indicates
indecisiveness among the market participants. The lack of
momentum clearly suggests no directional bias in the index and
hence, it's a prudent strategy to wait for some clear signs to form
a concrete view. The near term support levels for the index are
placed around 17565 and 17430 levels; whereas, resistances are
seen around 18040 and 18220 levels.
Key Levels
Support 1 - 17565
Resistance 1 - 18040
Support 2 - 17430
Resistance 2 - 18220
1
Technical & Derivatives Report
October 28, 2015
Comments
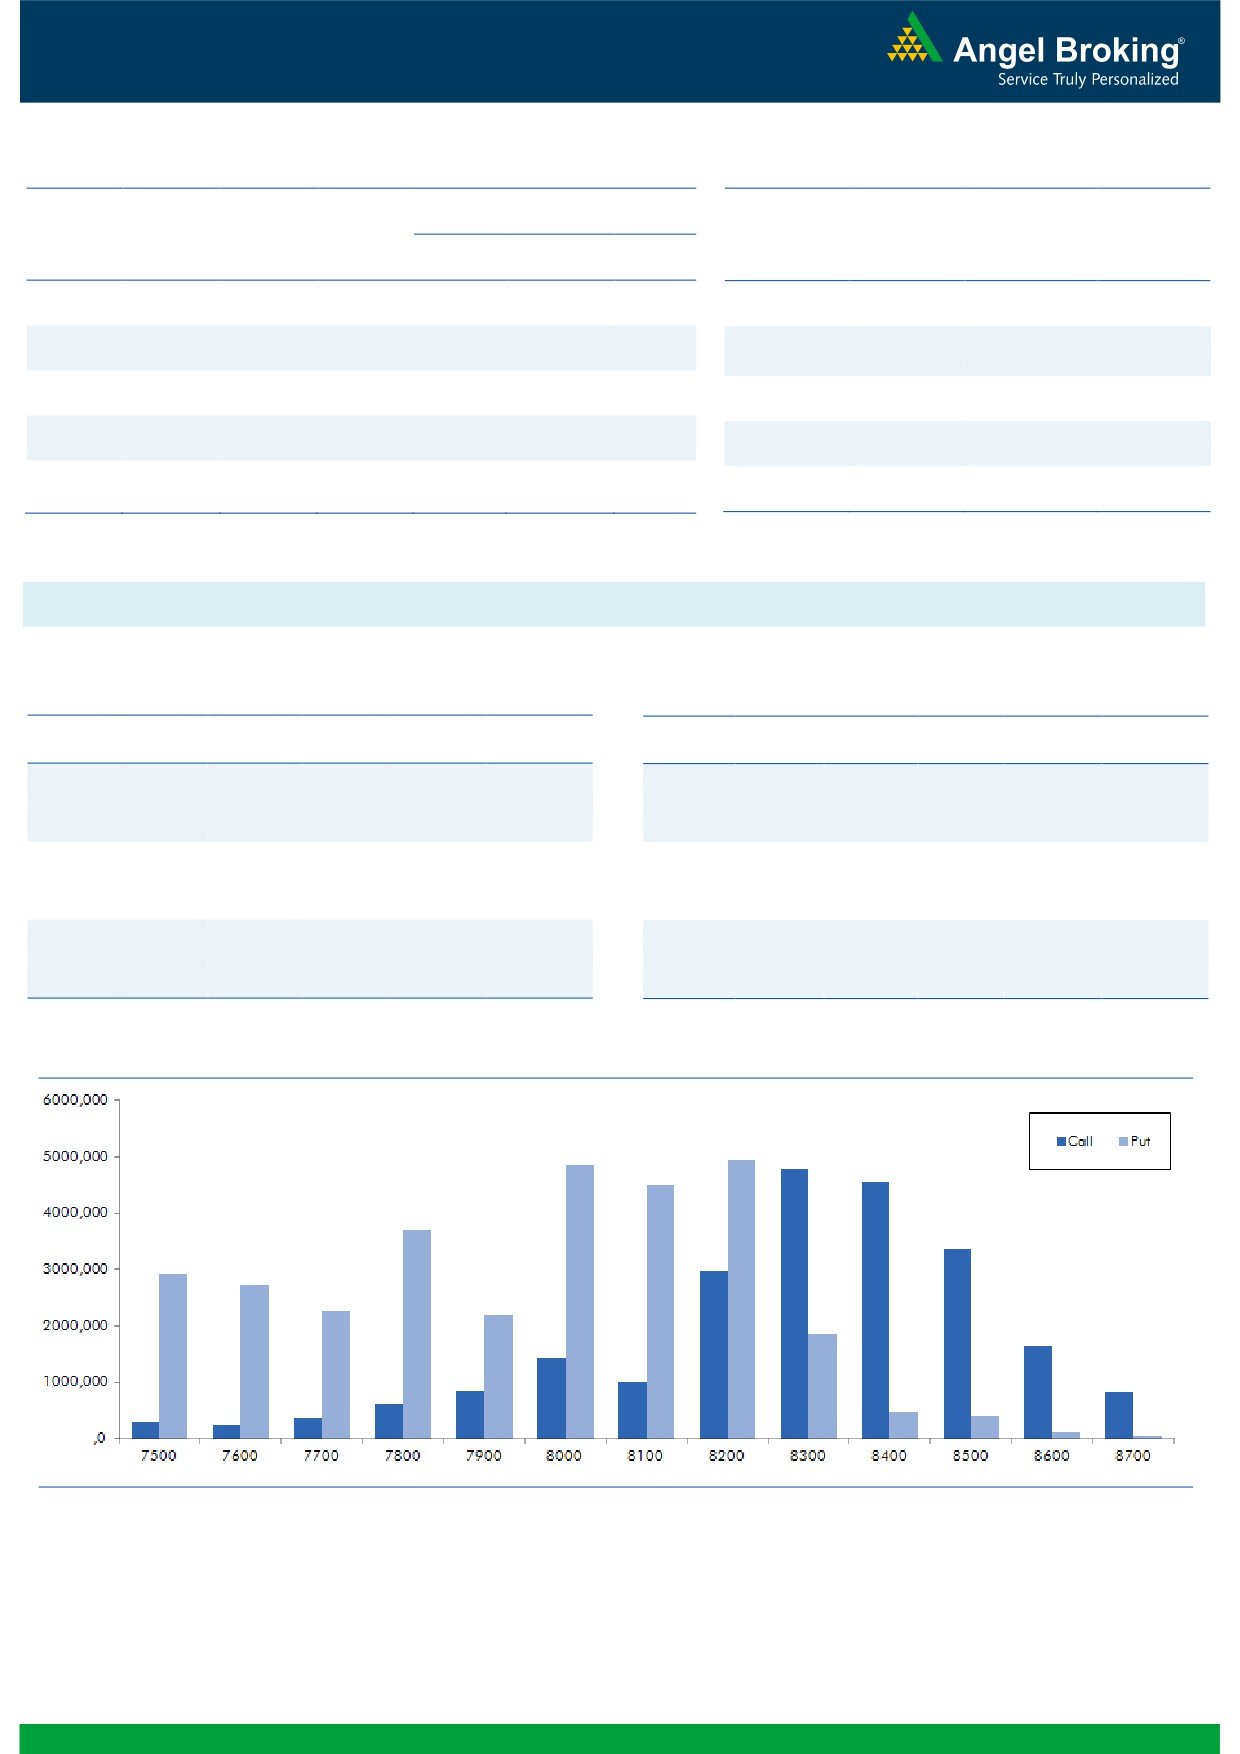
Nifty Vs OI
The Nifty futures open interest has increased by 4.15%
BankNifty futures open interest has increased by 2.59%
as market closed at 8232.90 levels.
The Nifty October future closed at a premium of 11.35
points against a premium of 3.05 points. The November
series closed at a premium of 47.05 points.
The Implied Volatility of at the money options has
decreased from 14.52% to 14.46%.
The total OI of the market is Rs. 2,47,682/- cr. and the
stock futures OI is Rs. 65,506/- cr.
Few of the liquid counters where we have seen high cost
of carry are UNITECH, TV18BRDCST, SAIL, UCOBANK
and GMRINFRA.
Views
OI Gainers
OI
PRICE
FIIs activity in cash market segment was subdued. In
SCRIP
OI
PRICE
CHG. (%)
CHG. (%)
Index Futures they bought to the tune of Rs. 624 crores
TVSMOTOR
7476000
32.62
274.90
12.85
with good amount of fall in OI, suggesting covering of
OIL
2301500
25.28
405.95
-2.74
shorts formed earlier in last trading session.
INDUSINDBK
4347250
16.26
956.05
-0.25
In Index Options front, they sold of worth Rs. 1087 crores
VOLTAS
6835400
16.01
287.45
-2.01
with fall in OI. In call options, we saw decent build-up inng.co
JSWENERGY
8762000
15.62
91.45
3.74
8250 call options, followed by huge unwinding in 8200
& 8300 call options. Out of the money calls 8350-8500
OI Losers
also shed good amount of OI. On the other hand in put
OI
PRICE
options, we hardly saw any strikes adding fresh OI, good
SCRIP
OI
PRICE
CHG. (%)
CHG. (%)
amount of unwinding was visible in 8200-8300 put
BATAINDIA
2570500
-12.39
523.45
1.02
options. Maximum OI is seen in 8300 call and 8200 put
JUSTDIAL
1651750
-8.50
993.15
-0.17
options. One should avoid forming shorts in Nifty till we
BHEL
21551000
-8.04
214.90
-1.53
see any short formation. Roll-over in Nifty and BankNifty
MCLEODRUSS
2764600
-5.89
178.95
2.37
is at 46.10% & 31.41% respectively.
PETRONET
4176000
-5.69
194.85
-0.26
Historical Volatility
Put-Call Ratio
SCRIP
HV
SCRIP
PCR-OI
PCR-VOL
TVSMOTOR
67.94
NIFTY
1.10
0.86
LUPIN
40.01
BANKNIFTY
0.97
0.93
UPL
48.39
INFY
0.36
0.42
APOLLOHOSP
33.21
RELIANCE
0.97
0.70
SYNDIBANK
47.90
TATAMOTORS
1.20
0.96
Strategy Date
Symbol
Strategy
Status
September 28, 2015
NIFTY
Long Strangle
Profit booked on October 16, 2015
October 05, 2015
SBIN
Ratio Bear Put Spread
Active
October 12, 2015
LT
Long Put Ladder
Active
October 19, 2015
NIFTY
Long Put
Book Loss on October 27, 2015
October 26, 2015
INFY
Long Call
Active
2
Technical & Derivatives Report
October 28, 2015
FII Statistics for 27-October 2015
Turnover on 27-October 2015
Open Interest
No. of
Turnover
Change
Detail
Buy
Sell
Net
Instrument
Value
Change
Contracts
( in Cr. )
(%)
Contracts
(in Cr.)
(%)
INDEX
INDEX
5713.96
5089.69
624.28
895664
28107.65
(5.65)
567343
17446.09
5.87
FUTURES
FUTURES
INDEX
INDEX
11959.91
13047.33
(1087.42)
2230056
75410.41
(5.92)
7954209
190230.12
-4.28
OPTIONS
OPTIONS
STOCK
15392.23
16037.22
(645.00)
1478678
52005.09
(8.18)
STOCK
FUTURES
1683860
56286.91
19.45
FUTURES
STOCK
STOCK
3101.64
3039.17
62.47
141506
3876.32
8.25
OPTIONS
627576
20259.86
43.65
OPTIONS
TOTAL
36167.73
37213.41
(1045.68)
4745904
159399.48
(6.22)
TOTAL
10832988
284222.98
2.81
Nifty Spot = 8232.90
Lot Size = 25
Bull-Call Spreads
Bear-Put Spreads
Action
Strike
Price
Risk
Reward
BEP
Action
Strike
Price
Risk
Reward
BEP
Buy
8300
15.10
Buy
8200
19.05
13.10
86.90
8313.10
14.15
85.85
8185.85
Sell
8400
2.00
Sell
8100
4.90
Buy
8300
15.10
Buy
8200
19.05
14.55
185.45
8314.55
17.50
182.50
8182.50
Sell
8500
0.55
Sell
8000
1.55
Buy
8400
2.00
Buy
8100
4.90
1.45
98.55
8401.45
3.35
96.65
8096.65
Sell
8500
0.55
Sell
8000
1.55
Nifty Put-Call Analysis
3
Technical & Derivatives Report
October 28, 2015
Daily Pivot Levels for Nifty 50 Stocks
Scrips
S2
S1
PIVOT
R1
R2
ACC
1,370
1,378
1,388
1,396
1,406
AMBUJACEM
201
203
207
209
212
ASIANPAINT
813
820
825
832
837
AXISBANK
509
515
522
528
535
BAJAJ-AUTO
2,537
2,560
2,577
2,600
2,617
BANKBARODA
165
167
170
171
175
BHARTIARTL
345
349
352
356
358
BHEL
209
212
216
218
222
BOSCHLTD
21,302
21,463
21,622
21,783
21,941
BPCL
888
901
909
922
930
CAIRN
154
156
158
160
162
CIPLA
666
675
682
691
697
COALINDIA
325
329
332
336
339
DRREDDY
4,126
4,153
4,189
4,215
4,251
GAIL
307
313
322
328
337
GRASIM
3,643
3,665
3,692
3,714
3,741
HCLTECH
846
857
865
876
885
HDFC
1,251
1,263
1,284
1,296
1,317
HDFCBANK
1,088
1,100
1,107
1,118
1,125
HEROMOTOCO
2,560
2,590
2,617
2,647
2,674
HINDALCO
82
83
85
86
87
HINDUNILVR
793
803
809
818
824
ICICIBANK
280
282
284
286
288
IDEA
138
139
141
143
145
INDUSINDBK
946
950
955
959
964
INFY
1,139
1,144
1,150
1,155
1,160
ITC
352
354
355
358
359
KOTAKBANK
653
657
661
665
670
LT
1,470
1,482
1,503
1,515
1,536
LUPIN
1,875
1,910
1,968
2,003
2,061
M&M
1,221
1,235
1,248
1,263
1,275
MARUTI
4,322
4,410
4,464
4,551
4,605
NMDC
96
97
98
99
100
NTPC
130
131
132
134
134
ONGC
243
245
250
252
257
PNB
133
133
134
135
136
POWERGRID
132
133
135
136
137
RELIANCE
931
935
942
946
953
SBIN
246
247
250
251
254
VEDL
100
102
104
107
109
SUNPHARMA
875
892
902
919
929
TATAMOTORS
379
381
384
386
389
TATAPOWER
70
70
71
72
72
TATASTEEL
241
243
247
249
253
TCS
2,508
2,519
2,532
2,544
2,557
TECHM
532
535
540
543
548
ULTRACEMCO
2,807
2,859
2,887
2,938
2,967
WIPRO
561
568
573
580
584
YESBANK
736
743
750
758
764
ZEEL
418
421
425
428
432
4
Technical & Derivatives Report
October 28, 2015
Research Team Tel: 022 - 39357800
For Technical Queries
For Derivatives Queries
DISCLAIMER
Angel Broking Private Limited (hereinafter referred to as “Angel”) is a registered Member of National Stock Exchange of India Limited,
Bombay Stock Exchange Limited and MCX Stock Exchange Limited. It is also registered as a Depository Participant with CDSL and
Portfolio Manager with SEBI. It also has registration with AMFI as a Mutual Fund Distributor. Angel Broking Private Limited is a
registered entity with SEBI for Research Analyst in terms of SEBI (Research Analyst) Regulations, 2014 vide registration number
INH000000164. Angel or its associates has not been debarred/ suspended by SEBI or any other regulatory authority for accessing
/dealing in securities Market. Angel or its associates including its relatives/analyst do not hold any financial interest/beneficial
ownership of more than 1% in the company covered by Analyst. Angel or its associates/analyst has not received any compensation /
managed or co-managed public offering of securities of the company covered by Analyst during the past twelve months. Angel/analyst
has not served as an officer, director or employee of company covered by Analyst and has not been engaged in market making activity
of the company covered by Analyst.
This document is solely for the personal information of the recipient, and must not be singularly used as the basis of any investment
decision. Nothing in this document should be construed as investment or financial advice. Each recipient of this document should
make such investigations as they deem necessary to arrive at an independent evaluation of an investment in the securities of the
companies referred to in this document (including the merits and risks involved), and should consult their own advisors to determine
the merits and risks of such an investment.
Reports based on technical and derivative analysis center on studying charts of a stock's price movement, outstanding positions and
trading volume, as opposed to focusing on a company's fundamentals and, as such, may not match with a report on a company's
fundamentals.
The information in this document has been printed on the basis of publicly available information, internal data and other reliable
sources believed to be true, but we do not represent that it is accurate or complete and it should not be relied on as such, as this
document is for general guidance only. Angel Broking Pvt. Limited or any of its affiliates/ group companies shall not be in any way
responsible for any loss or damage that may arise to any person from any inadvertent error in the information contained in this report.
Angel Broking Pvt. Limited has not independently verified all the information contained within this document. Accordingly, we cannot
testify, nor make any representation or warranty, express or implied, to the accuracy, contents or data contained within this document.
While Angel Broking Pvt. Limited endeavors to update on a reasonable basis the information discussed in this material, there may be
regulatory, compliance, or other reasons that prevent us from doing so.
This document is being supplied to you solely for your information, and its contents, information or data may not be reproduced,
redistributed or passed on, directly or indirectly.
Neither Angel Broking Pvt. Limited, nor its directors, employees or affiliates shall be liable for any loss or damage that may arise from
or in connection with the use of this information.
Note: Please refer to the important ‘Stock Holding Disclosure' report on the Angel website (Research Section). Also, please refer to the
latest update on respective stocks for the disclosure status in respect of those stocks. Angel Broking Pvt. Limited and its affiliates may
have investment positions in the stocks recommended in this report.
5