Technical & Derivatives Report
June 28, 2016
Sensex (26403) / Nifty (8095)
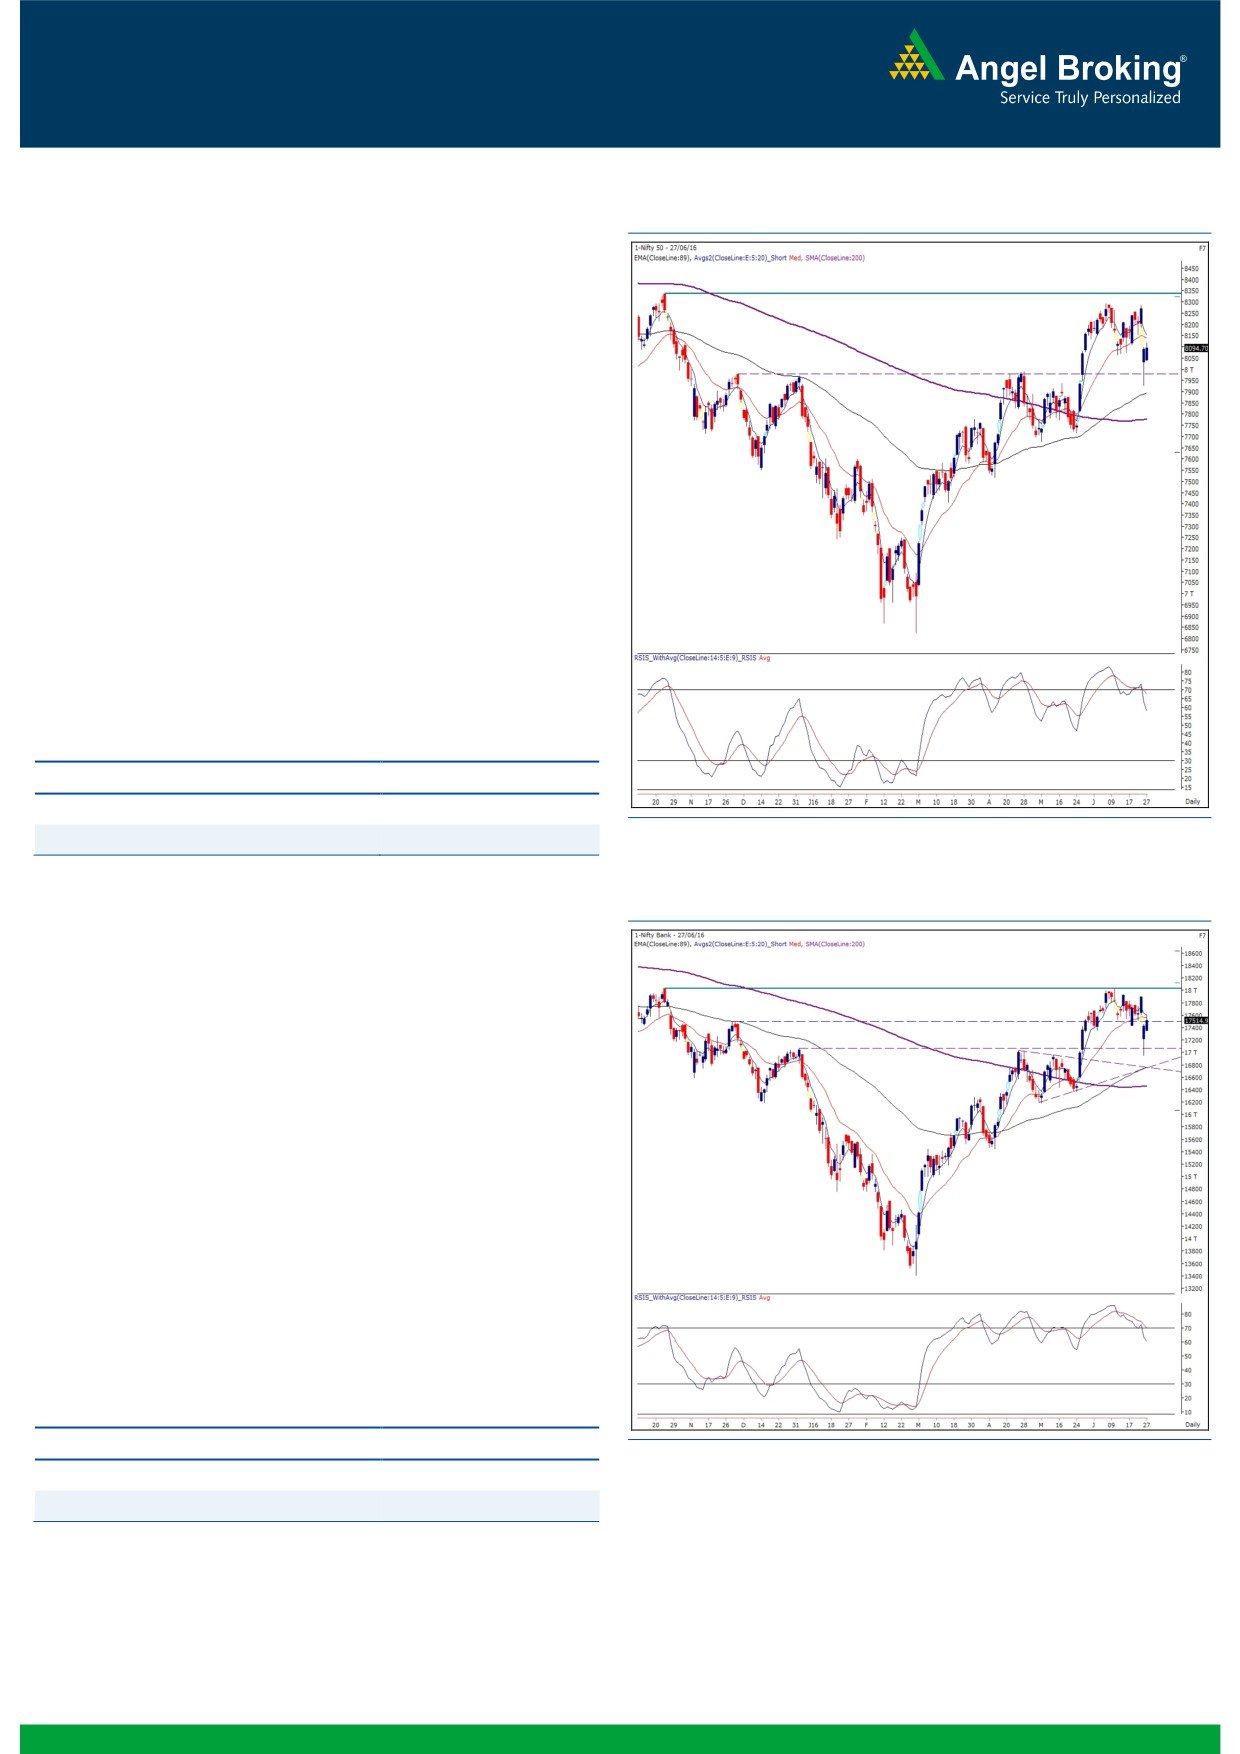
Exhibit 1: Nifty Daily Chart
The opening session of the week started on a soft note citing to
mixed global cues. Subsequently, we witnessed a modest volatility
throughout the day to end the range bound session with
negligible gains.
Yesterday's session was slightly lethargic for intraday traders as
we saw Nifty moving within 80 points with no clear direction.
However, some of the individual stocks performed well during the
session. Going forward, we expect this stock specific action to
continue in the market and thus, traders are advised to focus on
such potential trades. The Nifty is now likely to oscillate within a
broad range of 8150 to 7927 before confirming any clear
direction. With a broader view, we maintain our positive stance
on the market as long as Nifty manages to hold the 7900 mark
on a closing basis.
Key Levels
Support 1 - 8035
Resistance 1 - 8150
Support 2 - 7990
Resistance 2 - 8188
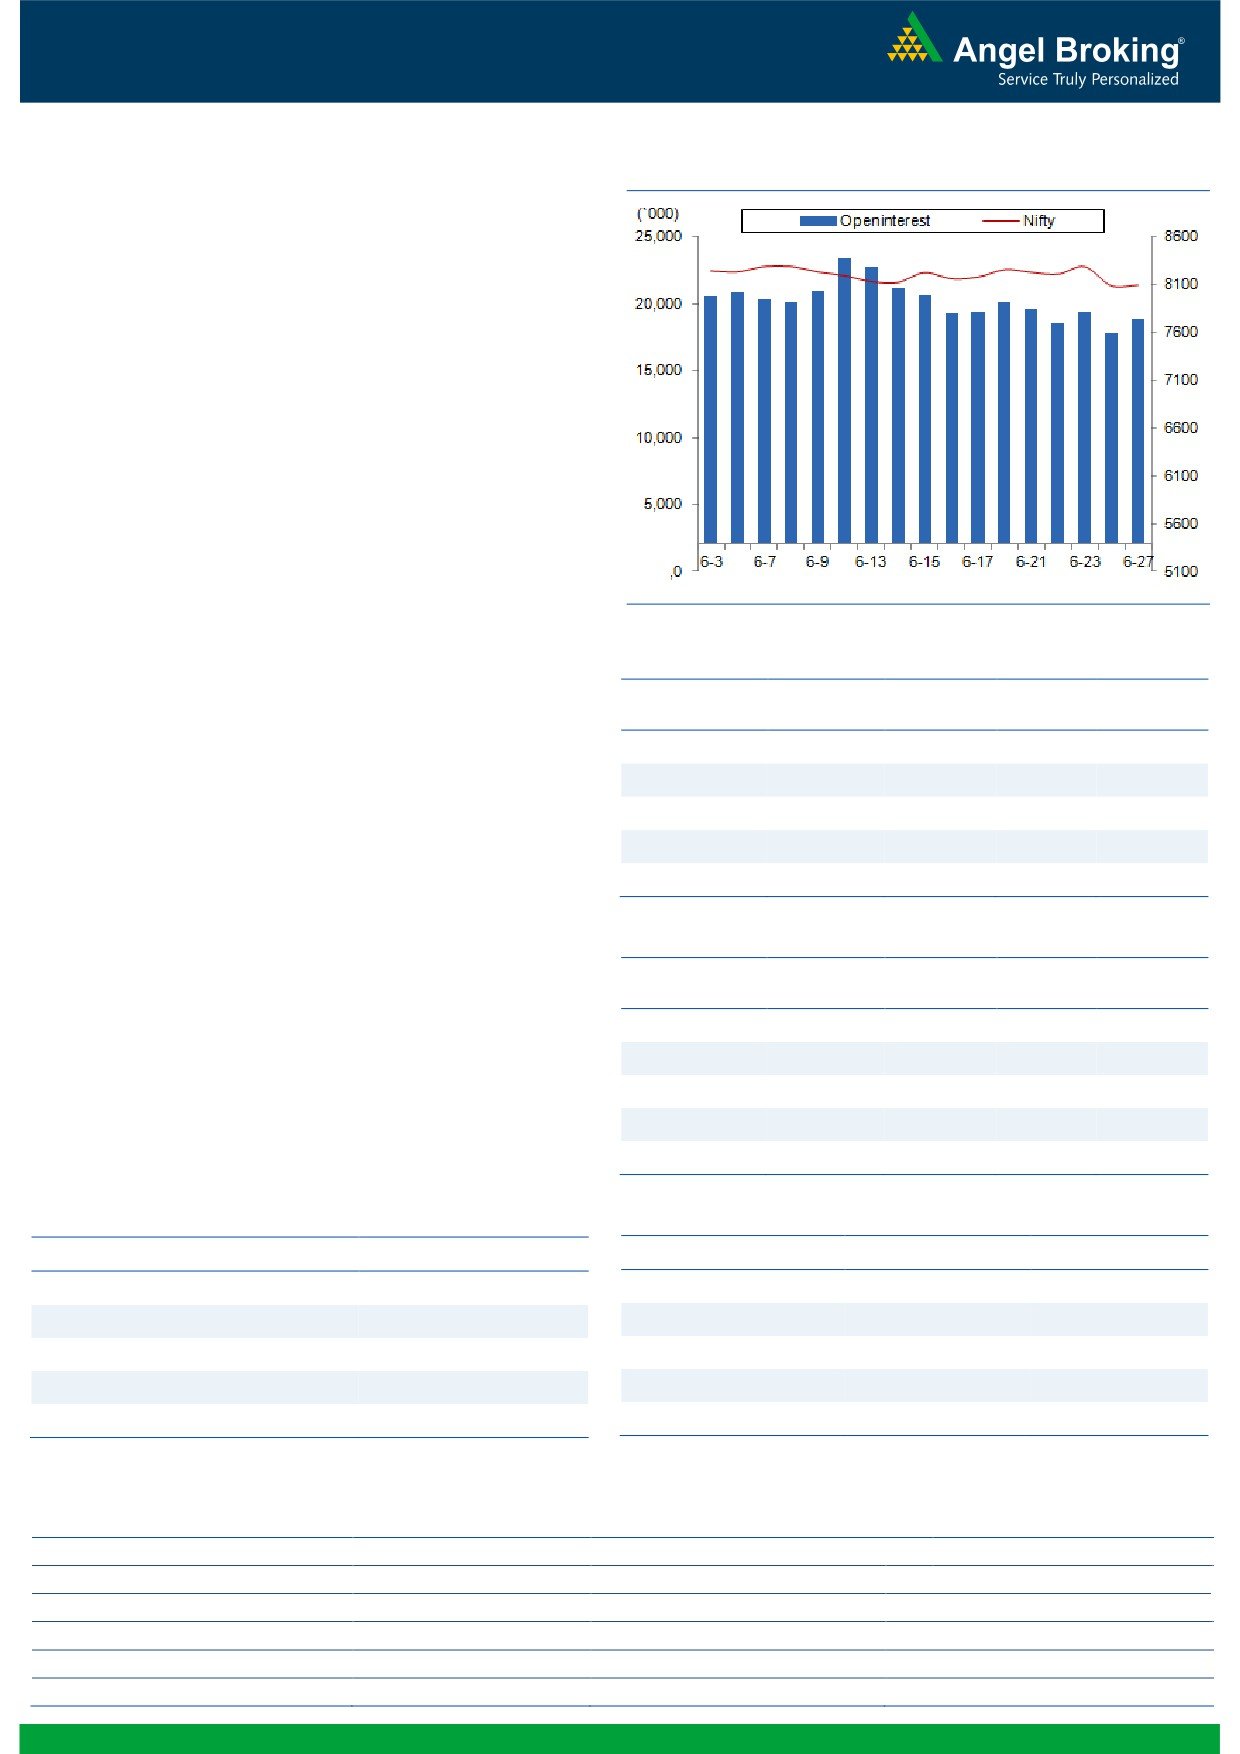
Exhibit 2: Nifty Bank Daily Chart
Nifty Bank Outlook - (17515)
Post opening, the Nifty Bank index traded with positive bias
throughout the session and ended the day with gains of 0.51
percent over its previous session's close.
Although the benchmark index ended the session on a marginal
positive note, the PSU Banks were the outperformers as the Nifty
PSU Bank index ended the session with gains of 2.83 percent.
With lack of clear directional move in the index, traders are
advised to continue to focus on stock specific approach an trade
with proper risk management. The intraday support for the index
are placed around 17340 and 17310 whereas resistances are
seen around 17611 and 17780.
Key Levels
Support 1 - 17340
Resistance 1 - 17611
Support 2 - 17310
Resistance 2 - 17780
1
Technical & Derivatives Report
June 28, 2016
Comments
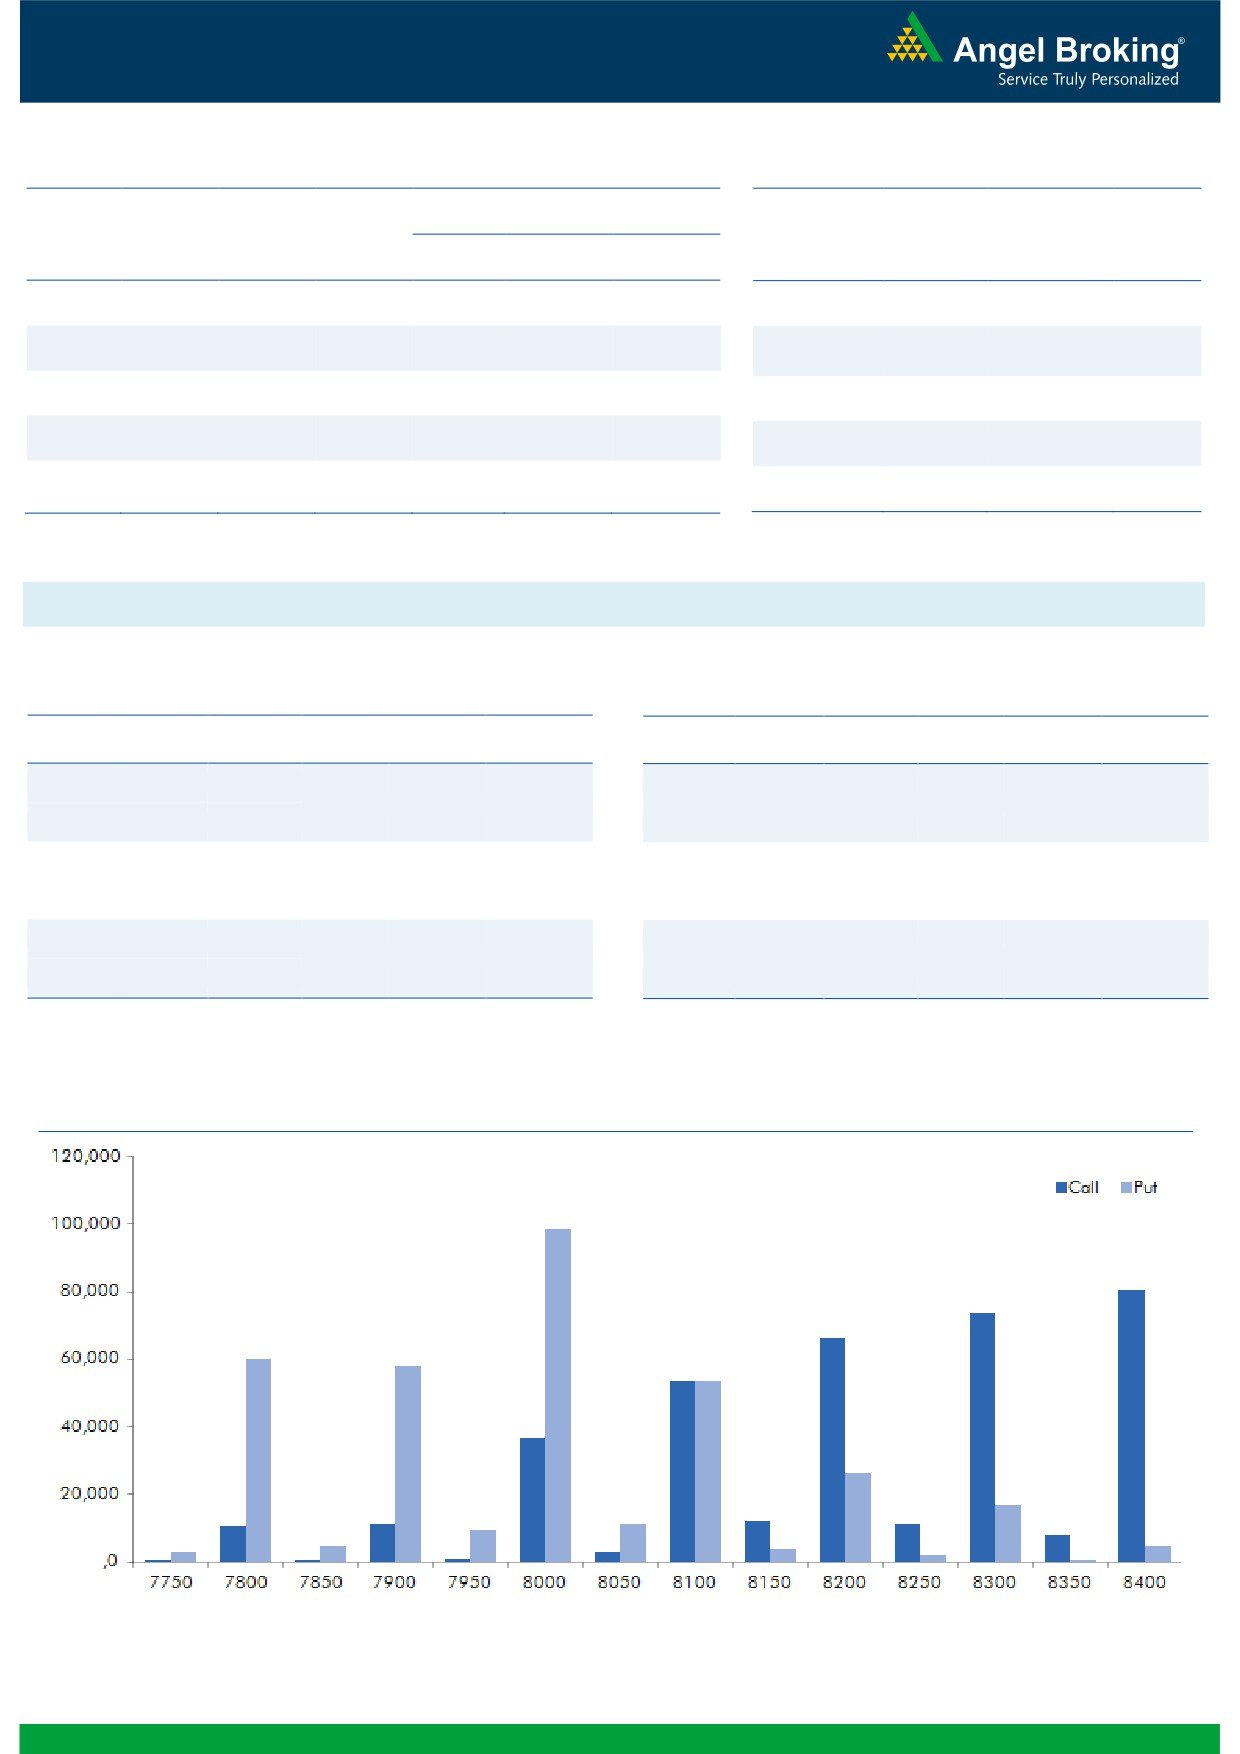
Nifty Vs OI
The Nifty futures open interest has increased by 5.95%
BankNifty futures open interest has increased by 4.66%
as market closed at 8094.70 levels.
The Nifty June future closed with a premium of 9.90
points against a discount of 1.70 points in previous
session. The July series closed at a premium of 39.80
points.
The Implied Volatility of at the money options has
increased from 17.47% to 19.15%.
The total OI of the market is Rs. 2,56,555/- cr. and the
stock futures OI is Rs. 66,524/- cr.
Few of the liquid counters where we have seen high cost
of carry are UNITECH, GMRINFRA, JPASSOCIAT,
ENGINERSIN and ADANIPOWER.
Views
OI Gainers
FIIs were net sellers in both cash market segment and in
OI
PRICE
Index Futures. They sold equities to the tune of Rs. 146
SCRIP
OI
PRICE
CHG. (%)
CHG. (%)
crores. While in Index Futures they were net sellers of Rs.
IBREALEST
34184000
28.66
89.05
3.35
287 crores with good amount of rise in open interest,
GODREJCP
485600
26.72
1521.85
0.60
indicating blend of short and long formation.
ABIRLANUVO
1774000
23.84
1125.00
6.90
On Index Options front, FIIs sold worth Rs. 404 crores
with some rise in open interest. In Call option, 8150-
TCS
4445200
22.41
2495.85
-3.04
8300 strikes added decent amount of OI. We believe it’s
MOTHERSUMI
13863500
22.28
272.90
-0.96
more of writing in these call strikes and now 8150-8200
may act as wall of resistance for Nifty. Some unwinding
OI Losers
was also visible in 7900 and 8000 strike prices, which
OI
PRICE
SCRIP
OI
PRICE
may be covering of short positions. While in Put option,
CHG. (%)
CHG. (%)
OI addition was seen in 8000-8100 strikes; these are
HDIL
22926000
-11.34
98.00
0.56
mostly longs. Seeing the above data it seems expiry may
PIDILITIND
1083000
-9.75
706.00
2.03
be below 8150 levels, if any bounce above these levels
AMBUJACEM
8426600
-7.98
254.40
2.31
trader should buy 8150 puts. Rollovers in Nifty and
INDIACEM
27403000
-6.10
102.65
2.60
BankNifty are on the higher side at 35.59% and 23.21%
RCOM
124894000
-5.75
47.65
1.06
respectively.
Historical Volatility
Put-Call Ratio
SCRIP
HV
SCRIP
PCR-OI
PCR-VOL
BIOCON
40.59
NIFTY
1.05
0.96
ABIRLANUVO
42.80
BANKNIFTY
1.09
0.84
IFCI
42.32
SBIN
0.92
0.69
GRASIM
18.41
TATAMOTORS
0.77
0.79
ACC
21.55
RELIANCE
0.45
0.41
Strategy Date
Symbol
Strategy
Status
May 30, 2016
TCS
Ratio Bull Call Spread
Active
June 06, 2016
NIFTY
Long Call
Exited at Cost
June 13, 2016
ONGC
Ratio Bull Call Spread
Active
June 20, 2016
MARUTI
Long Call Ladder
Active
2
Technical & Derivatives Report
June 28, 2016
FII Statistics for 27-June 2016
Turnover on 27-June 2016
Open Interest
No. of
Turnover
Change
Detail
Buy
Sell
Net
Instrument
Value
Contracts
( in Cr. )
(%)
Contracts
Change (%)
(in Cr.)
INDEX
INDEX
4584.07
4871.48
(287.41)
233598
13976.97
14.58
372622
21985.78
-47.86
FUTURES
FUTURES
INDEX
INDEX
28804.35
29208.08
(403.72)
1265145
75982.51
0.86
5154225
307268.90
-40.20
OPTIONS
OPTIONS
STOCK
17505.57
17444.99
60.58
1072869
55479.37
(0.35)
STOCK
FUTURES
1052699
56415.17
7.20
FUTURES
STOCK
STOCK
4136.27
4273.06
(136.78)
131134
6809.05
(0.92)
OPTIONS
446899
23697.47
-40.10
OPTIONS
TOTAL
55030.27
55797.61
(767.34)
2702746
152247.90
1.33
TOTAL
7026445
409367.32
-36.85
Nifty Spot = 8094.70
Lot Size = 75
Bull-Call Spreads
Bear-Put Spreads
Action
Strike
Price
Risk
Reward
BEP
Action
Strike
Price
Risk
Reward
BEP
Buy
8100
64.10
Buy
8100
59.75
41.75
58.25
8141.75
31.20
68.80
8068.80
Sell
8200
22.35
Sell
8000
28.55
Buy
8100
64.10
Buy
8100
59.75
57.80
142.20
8157.80
46.50
153.50
8053.50
Sell
8300
6.30
Sell
7900
13.25
Buy
8200
22.35
Buy
8000
28.55
16.05
83.95
8216.05
15.30
84.70
7984.70
Sell
8300
6.30
Sell
7900
13.25
Note: Above mentioned Bullish or Bearish Spreads in Nifty (June Series) are given as an information and not as a recommendation.
Nifty Put-Call Analysis
3
Technical & Derivatives Report
June 28, 2016
Daily Pivot Levels for Nifty Constituents
Scrips
S2
S1
PIVOT
R1
R2
ACC
1,544
1,573
1,593
1,622
1,642
ADANIPORTS
200
202
204
206
207
AMBUJACEM
245
250
253
257
260
ASIANPAINT
956
965
979
988
1,002
AUROPHARMA
690
707
717
734
744
AXISBANK
503
509
513
519
524
BAJAJ-AUTO
2,606
2,627
2,665
2,686
2,724
BANKBARODA
144
148
150
154
157
BHEL
117
118
119
120
122
BPCL
1,004
1,021
1,034
1,051
1,064
BHARTIARTL
345
348
353
356
361
INFRATEL
318
323
326
331
334
BOSCH
20,557
20,744
20,987
21,174
21,417
CIPLA
468
478
485
495
502
COALINDIA
303
306
309
312
315
DRREDDY
3,080
3,163
3,216
3,299
3,352
EICHERMOT
18,312
18,511
18,630
18,829
18,948
GAIL
370
375
379
384
388
GRASIM
4,231
4,300
4,349
4,418
4,467
HCLTECH
707
721
735
749
763
HDFCBANK
1,145
1,152
1,161
1,168
1,177
HDFC
1,199
1,207
1,218
1,226
1,238
HEROMOTOCO
2,992
3,022
3,053
3,083
3,113
HINDALCO
114
117
119
122
124
HINDUNILVR
844
851
863
870
881
ICICIBANK
227
230
232
235
237
IDEA
99
100
100
101
102
INDUSINDBK
1,059
1,069
1,085
1,095
1,110
INFY
1,147
1,156
1,170
1,180
1,193
ITC
351
355
358
362
365
KOTAKBANK
714
727
736
748
757
LT
1,413
1,440
1,455
1,481
1,496
LUPIN
1,449
1,464
1,476
1,492
1,504
M&M
1,367
1,379
1,390
1,403
1,414
MARUTI
3,973
3,999
4,030
4,056
4,087
NTPC
145
147
149
151
154
ONGC
205
208
210
212
215
POWERGRID
151
152
155
156
159
RELIANCE
934
945
952
963
969
SBIN
207
212
216
220
224
SUNPHARMA
745
760
768
782
790
TCS
2,444
2,470
2,509
2,534
2,573
TATAMTRDVR
290
293
297
300
304
TATAMOTORS
436
443
450
456
464
TATAPOWER
71
72
72
73
73
TATASTEEL
305
308
310
313
315
TECHM
494
499
504
509
514
ULTRACEMCO
3,249
3,322
3,364
3,437
3,478
WIPRO
542
545
550
553
558
YESBANK
1,059
1,067
1,079
1,087
1,098
ZEEL
428
434
443
449
458
4
Technical & Derivatives Report
June 28, 2016
Research Team Tel: 022 - 39357800
For Technical Queries
For Derivatives Queries
DISCLAIMER
Angel Broking Private Limited (hereinafter referred to as “Angel”) is a registered Member of National Stock Exchange of India Limited,
Bombay Stock Exchange Limited and MCX Stock Exchange Limited. It is also registered as a Depository Participant with CDSL and
Portfolio Manager with SEBI. It also has registration with AMFI as a Mutual Fund Distributor. Angel Broking Private Limited is a
registered entity with SEBI for Research Analyst in terms of SEBI (Research Analyst) Regulations, 2014 vide registration number
INH000000164. Angel or its associates has not been debarred/ suspended by SEBI or any other regulatory authority for accessing
/dealing in securities Market. Angel or its associates including its relatives/analyst do not hold any financial interest/beneficial
ownership of more than 1% in the company covered by Analyst. Angel or its associates/analyst has not received any compensation /
managed or co-managed public offering of securities of the company covered by Analyst during the past twelve months. Angel/analyst
has not served as an officer, director or employee of company covered by Analyst and has not been engaged in market making activity
of the company covered by Analyst.
This document is solely for the personal information of the recipient, and must not be singularly used as the basis of any investment
decision. Nothing in this document should be construed as investment or financial advice. Each recipient of this document should
make such investigations as they deem necessary to arrive at an independent evaluation of an investment in the securities of the
companies referred to in this document (including the merits and risks involved), and should consult their own advisors to determine
the merits and risks of such an investment.
Reports based on technical and derivative analysis center on studying charts of a stock's price movement, outstanding positions and
trading volume, as opposed to focusing on a company's fundamentals and, as such, may not match with a report on a company's
fundamentals.
The information in this document has been printed on the basis of publicly available information, internal data and other reliable
sources believed to be true, but we do not represent that it is accurate or complete and it should not be relied on as such, as this
document is for general guidance only. Angel Broking Pvt. Limited or any of its affiliates/ group companies shall not be in any way
responsible for any loss or damage that may arise to any person from any inadvertent error in the information contained in this report.
Angel Broking Pvt. Limited has not independently verified all the information contained within this document. Accordingly, we cannot
testify, nor make any representation or warranty, express or implied, to the accuracy, contents or data contained within this document.
While Angel Broking Pvt. Limited endeavors to update on a reasonable basis the information discussed in this material, there may be
regulatory, compliance, or other reasons that prevent us from doing so.
This document is being supplied to you solely for your information, and its contents, information or data may not be reproduced,
redistributed or passed on, directly or indirectly.
Neither Angel Broking Pvt. Limited, nor its directors, employees or affiliates shall be liable for any loss or damage that may arise from
or in connection with the use of this information.
Note: Please refer to the important ‘Stock Holding Disclosure' report on the Angel website (Research Section). Also, please refer to the
latest update on respective stocks for the disclosure status in respect of those stocks. Angel Broking Pvt. Limited and its affiliates may
have investment positions in the stocks recommended in this report.
5