Technical & Derivatives Report
March 28, 2016
Sensex (25338) / Nifty (7717)
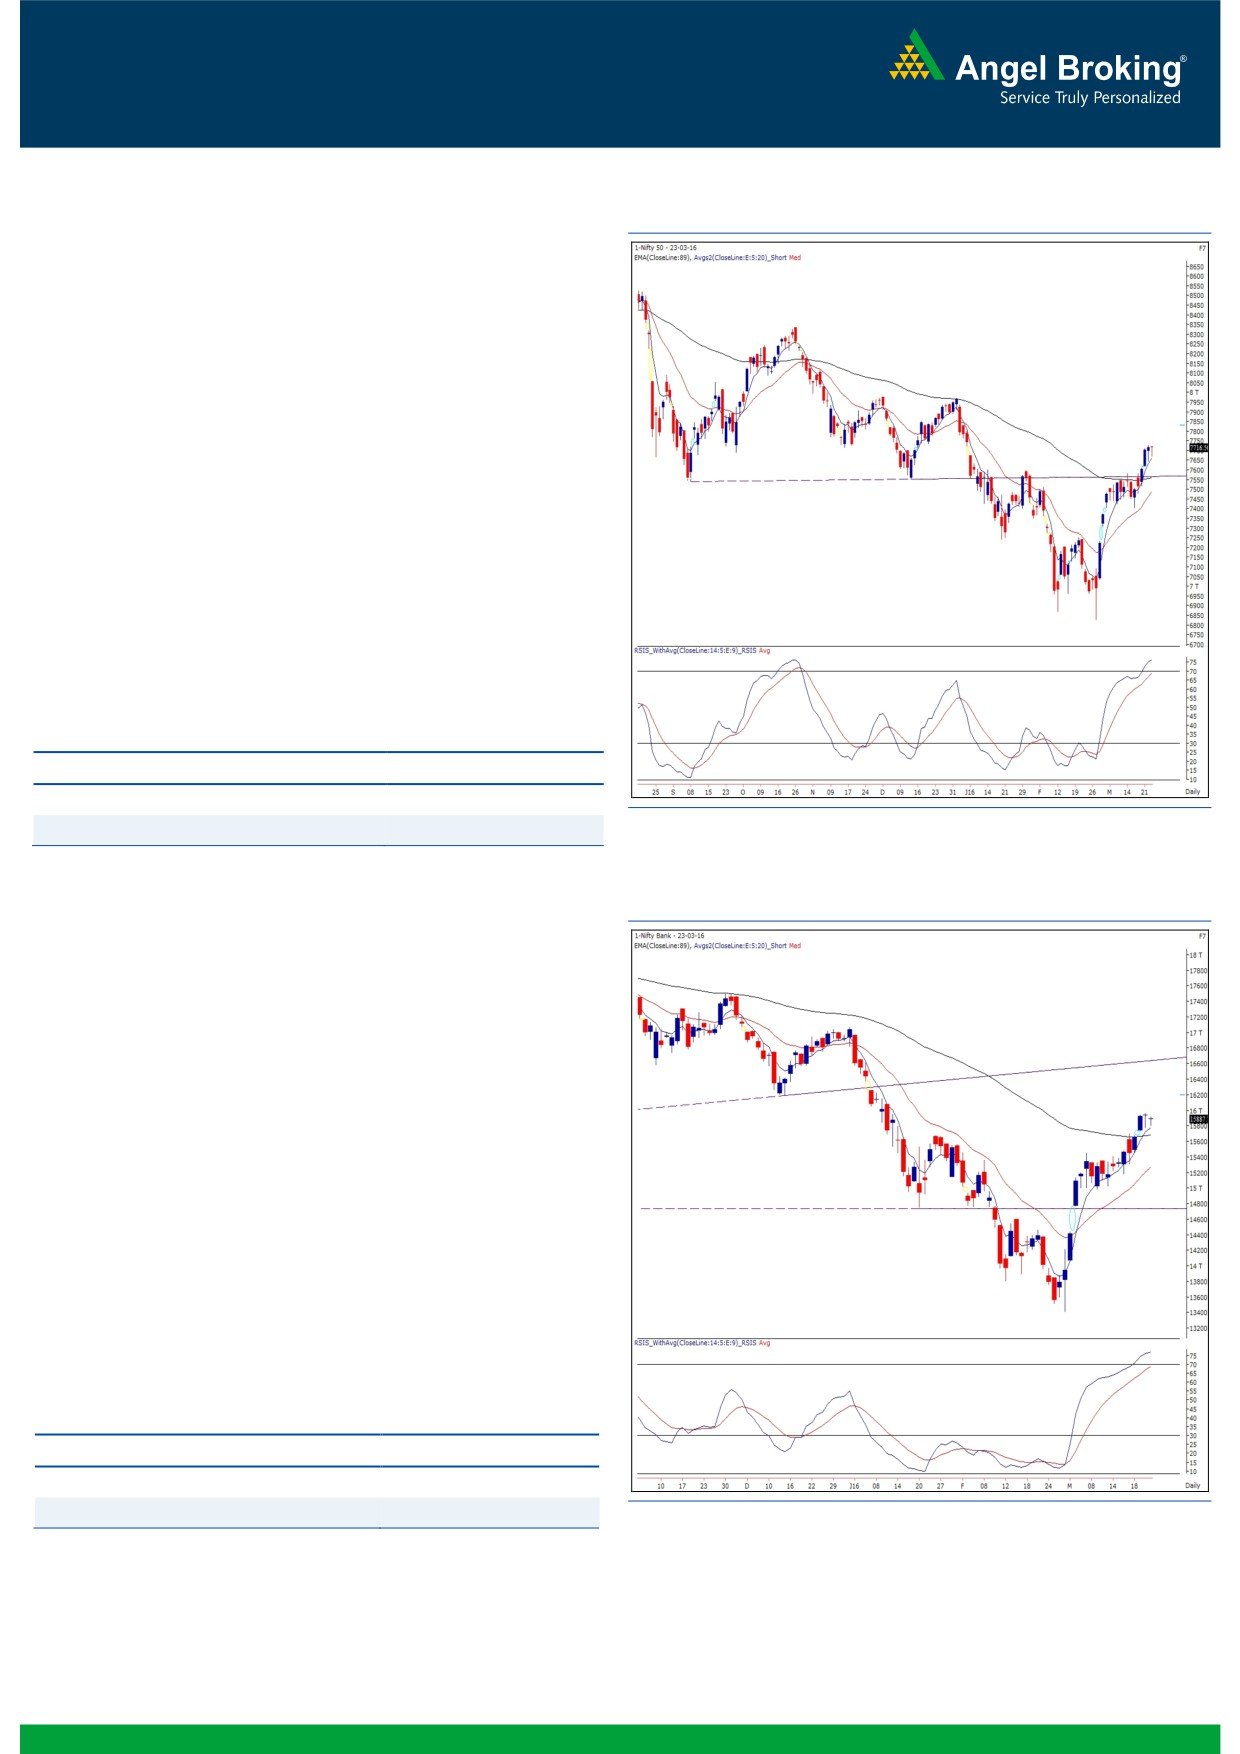
Exhibit 1: Nifty Daily Chart
The Nifty opened on a flat note on Wednesday and corrected
in first half of the session. However, we witnessed decent
recovery from the lower levels and as a result, Nifty trimmed
off all its intraday losses and ended flat.
Post the gains during last week, the Nifty index has now
reached yet another landmark of 7700 within no time. As of
now, we do not see any weakness on charts and thus, we
reiterate our view that traders shouldn't pre-empt any reversal
until we see any definite signal. However, having said that,
one can adopt a cautious approach if Nifty reaches 7750 -
7780 (strong resistance of the Weekly ’89 EMA’) levels by
booking timely profits or trailing stop losses; but, shorting is
strictly avoided in such kind of strong optimism. On the
downside, 7600 - 7550 would now be seen as a strong
support. Meanwhile, individual stocks are giving good moves
and thus, traders should focus on such potential trades.
Key Levels
Support 1 - 7643
Resistance 1 - 7750
Support 2 - 7600
Resistance 2 -
7780
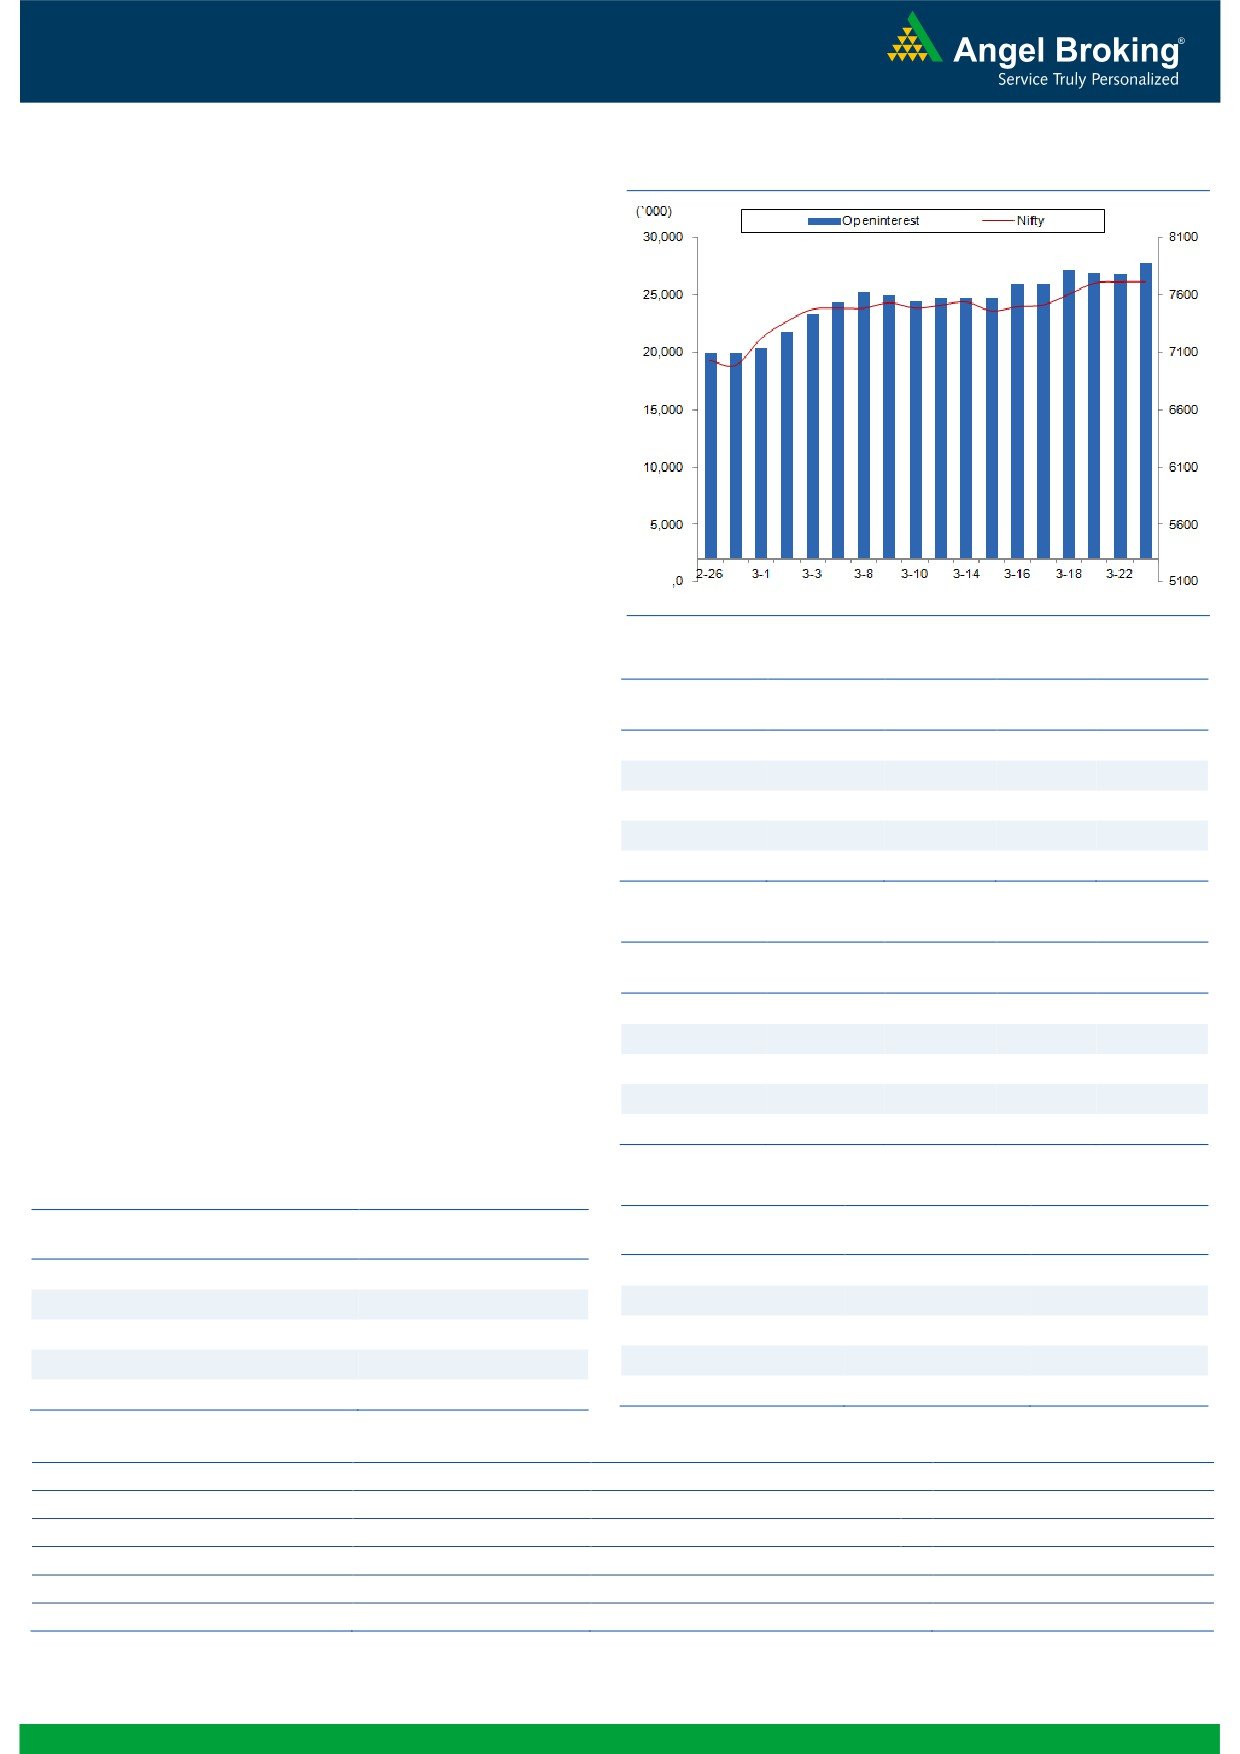
Exhibit 2: Nifty Bank Daily Chart
Nifty Bank Outlook - (15888)
During last week, the Nifty Bank index rallied higher post gap
up opening on Monday, which was then followed by two
range-bound trading sessions. The truncated week ended with
gains of 1.49% as compared to its previous week’s close.
The short term trend of the Nifty Bank index continues to
remain up as there is no sign of reversal on the chart and the
stocks within the index continues to trade with positive bias. In
near term, the index could, hence, continue its upmove upto
the resistance level of
16188 (December low support
breached in January which could now become a resistance)
and 16256 - 16378 range (gap resistance). The recent gap
area of 15670 - 15735 is the near term support as it also
coincides with the 89 DEMA. Trades can thus keep a stop loss
below the lower end of the mentioned support zone and trade
with positive bias.
Key Levels
Support 1 - 15735
Resistance 1 - 16188
Support 2 - 15670
Resistance 2 - 16378
1
Technical & Derivatives Report
March 28, 2016
Comments
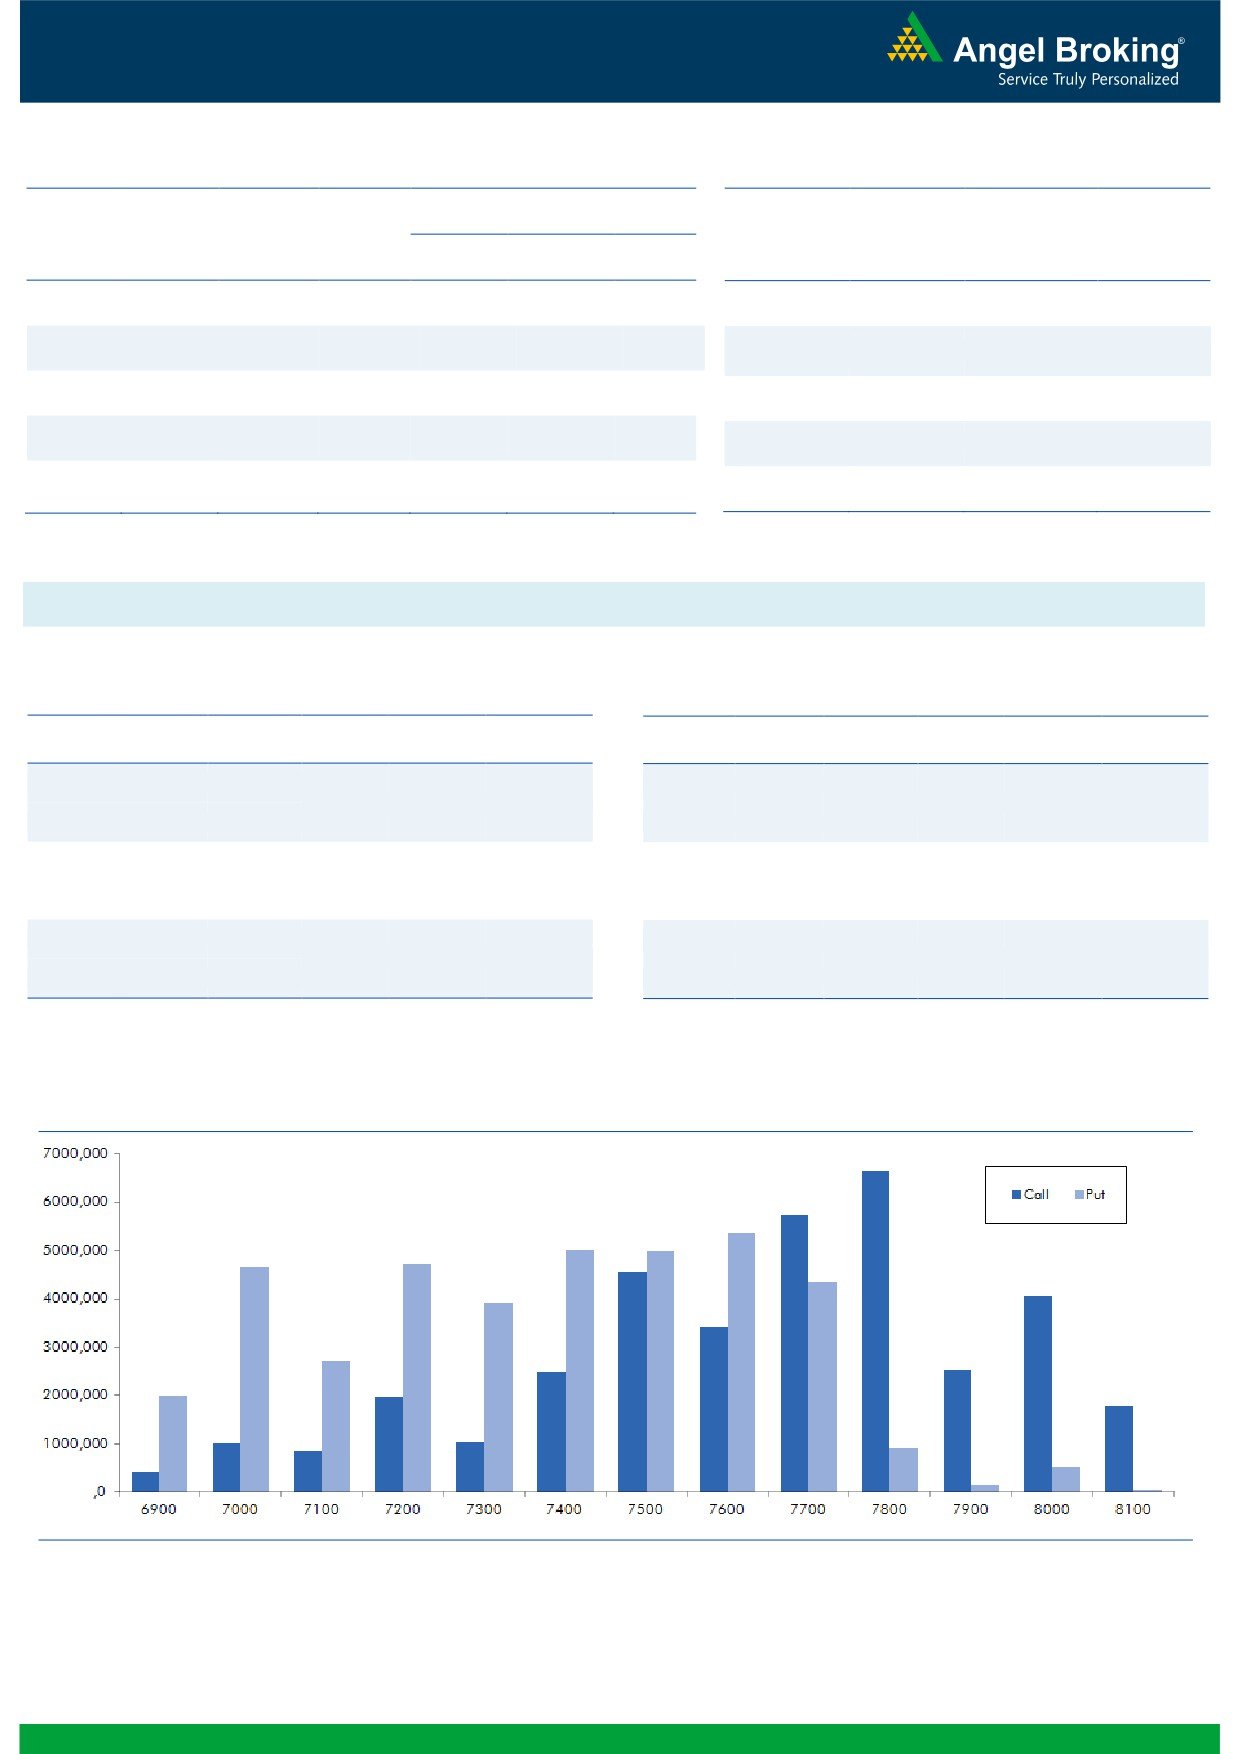
Nifty Vs OI
The Nifty futures open interest has increased by 3.68%
BankNifty futures open interest has decreased by 0.84%
as market closed at 7716.50 levels.
The Nifty March future closed at a premium of 19.80
points against a premium of 11.35 points. The April
series closed at a premium of 64.05 points.
The Implied Volatility of at the money options has
decreased from 11.73% to 10.93%.
The total OI of the market is Rs. 2,51,857/- cr. and the
stock futures OI is Rs. 58,474 /- cr.
Few of the liquid counters where we have seen high cost
of carry are UNITECH, JISLJALEQS, KTKBANK,
JPASSOCIAT and SOUTHBANK.
Views
FIIs continued to buy in both Cash market and Index
OI Gainers
Future segment. They bought equities to the tune of Rs.
OI
PRICE
SCRIP
OI
PRICE
CHG. (%)
CHG. (%)
977 crores. While in Index Futures, they were net buyers
CADILAHC
4273500
14.56
321.25
-0.20
of Rs. 740 crores with some rise in OI, suggesting mix of
PAGEIND
92550
13.35
10624.65
-3.62
some long formation and short covering in last trading
IDEA
46062000
10.88
105.40
3.03
session.
JSWENERGY
5898000
10.70
70.55
-2.89
In Index Options front, FIIs sold of worth Rs. 1078 crores
INFY
10952500
10.50
1211.45
1.69
with some fall in OI. In call options, we hardly saw anyng.com
meaningful OI addition,
7850 call option was
comparatively active. We witnessed decent unwinding in
OI Losers
7400 and 7600 call options. While in put options, 7700
OI
PRICE
SCRIP
OI
PRICE
CHG. (%)
CHG. (%)
strike continue to add fresh OI. Maximum OI in current
KPIT
1232000
-7.23
143.95
-0.07
series is visible in 7800 call and 7600 put options.
JUSTDIAL
2696500
-7.10
735.30
4.65
Despite being long weekend, we hardly saw any
BHEL
25320000
-6.33
116.65
-0.13
meaningful profit booking in most of the heavyweight
STAR
1623200
-6.20
1056.35
2.69
counters. We believe long in the system are still intact,
BEML
502000
-6.17
1092.70
-0.24
avoid shorting this market.
Historical Volatility
Put-Call Ratio
SCRIP
HV
SCRIP
PCR-OI
PCR-VOL
ABIRLANUVO
47.23
NIFTY
1.04
1.06
ADANIENT
44.18
BANKNIFTY
1.15
1.06
SAIL
55.08
SBIN
0.95
0.63
HINDALCO
61.84
LUPIN
0.37
0.48
IDEA
38.76
ICICIBANK
1.38
0.77
Strategy Date
Symbol
Strategy
Status
February 29, 2016
RELIANCE
Ratio Bull Call Spread
Active
March 07, 2016
BHEL
Long Call Ladder
Active
March 14, 2016
NIFTY
Ratio Bull Call Spread
Not Activated
March 21, 2016
BANKNIFTY
Long Call
Active
2
Technical & Derivatives Report
March 28, 2016
FII Statistics for 23-March 2016
Turnover on 23-March 2016
Open Interest
No. of
Turnover
Change
Detail
Buy
Sell
Net
Instrument
Value
Change
Contracts
( in Cr. )
(%)
Contracts
(in Cr.)
(%)
INDEX
INDEX
2011.71
1272.10
739.61
359744
20275.96
0.93
290286
15773.94
-8.23
FUTURES
FUTURES
INDEX
INDEX
32865.61
33944.10
(1078.49)
1552946
88399.76
(0.99)
4276764
240369.24
-6.66
OPTIONS
OPTIONS
STOCK
5335.64
6417.49
(1081.85)
1050361
48879.14
(0.25)
STOCK
FUTURES
597729
28783.89
-4.29
FUTURES
STOCK
STOCK
2546.14
2745.69
(199.54)
98879
4669.18
0.59
OPTIONS
331829
16460.98
-12.85
OPTIONS
TOTAL
42759.09
44379.37
(1620.28)
3061930
162224.04
(0.46)
TOTAL
5496608
301388.05
-6.88
Nifty Spot = 7716.50
Lot Size = 75
Bull-Call Spreads
Bear-Put Spreads
Action
Strike
Price
Risk
Reward
BEP
Action
Strike
Price
Risk
Reward
BEP
Buy
7700
67.90
Buy
7700
35.30
47.35
52.65
7747.35
20.90
79.10
7679.10
Sell
7800
20.55
Sell
7600
14.40
Buy
7700
67.90
Buy
7700
35.30
62.80
137.20
7762.80
28.65
171.35
7671.35
Sell
7900
5.10
Sell
7500
6.65
Buy
7800
20.55
Buy
7600
14.40
15.45
84.55
7815.45
7.75
92.25
7592.25
Sell
7900
5.10
Sell
7500
6.65
Note: Above mentioned Bullish or Bearish Spreads in Nifty (March Series) are given as an information and not as a recommendation.
Nifty Put-Call Analysis
3
Technical & Derivatives Report
March 28, 2016
Daily Pivot Levels for Nifty 50 Stocks
Scrips
S2
S1
PIVOT
R1
R2
ACC
1,335
1,354
1,377
1,396
1,419
ADANIPORTS
234
236
240
242
245
AMBUJACEM
222
225
229
232
236
ASIANPAINT
840
845
851
856
862
AXISBANK
432
435
438
441
444
BAJAJ-AUTO
2,305
2,308
2,313
2,316
2,322
BANKBARODA
141
143
144
146
147
BHARTIARTL
348
353
357
362
367
BHEL
115
116
117
118
119
BOSCHLTD
19,624
19,921
20,232
20,529
20,840
BPCL
855
862
871
878
887
CAIRN
153
155
158
160
163
CIPLA
521
527
532
538
542
COALINDIA
294
296
297
299
301
DRREDDY
3,005
3,026
3,053
3,074
3,100
GAIL
349
353
358
362
368
GRASIM
3,738
3,760
3,793
3,815
3,848
HCLTECH
804
811
820
827
837
HDFC
1,134
1,148
1,158
1,172
1,182
HDFCBANK
1,035
1,042
1,048
1,055
1,060
HEROMOTOCO
2,833
2,852
2,883
2,903
2,934
HINDALCO
87
89
90
93
94
HINDUNILVR
854
864
871
880
887
ICICIBANK
229
232
233
236
238
IDEA
100
102
104
107
109
INDUSINDBK
920
924
929
933
939
INFY
1,172
1,190
1,200
1,218
1,229
ITC
318
321
323
326
328
KOTAKBANK
658
662
665
669
673
LT
1,222
1,232
1,241
1,251
1,259
LUPIN
1,493
1,508
1,534
1,549
1,575
M&M
1,232
1,241
1,251
1,260
1,271
MARUTI
3,638
3,687
3,715
3,765
3,793
NTPC
126
127
128
128
129
ONGC
209
212
215
218
221
PNB
83
84
85
86
87
POWERGRID
136
137
138
139
140
RELIANCE
1,008
1,019
1,033
1,043
1,057
SBIN
194
195
197
198
199
VEDL
95
96
97
98
99
SUNPHARMA
827
837
844
854
862
TATAMOTORS
371
374
377
380
382
TATAPOWER
62
62
63
63
63
TATASTEEL
308
313
315
320
323
TCS
2,442
2,458
2,473
2,489
2,504
TECHM
470
475
480
485
490
ULTRACEMCO
3,139
3,169
3,217
3,247
3,295
WIPRO
540
548
554
561
567
YESBANK
817
833
843
859
868
ZEEL
381
385
390
393
398
4
Technical & Derivatives Report
March 28, 2016
Research Team Tel: 022 - 39357800
For Technical Queries
For Derivatives Queries
DISCLAIMER
Angel Broking Private Limited (hereinafter referred to as “Angel”) is a registered Member of National Stock Exchange of India Limited,
Bombay Stock Exchange Limited and MCX Stock Exchange Limited. It is also registered as a Depository Participant with CDSL and
Portfolio Manager with SEBI. It also has registration with AMFI as a Mutual Fund Distributor. Angel Broking Private Limited is a
registered entity with SEBI for Research Analyst in terms of SEBI (Research Analyst) Regulations, 2014 vide registration number
INH000000164. Angel or its associates has not been debarred/ suspended by SEBI or any other regulatory authority for accessing
/dealing in securities Market. Angel or its associates including its relatives/analyst do not hold any financial interest/beneficial
ownership of more than 1% in the company covered by Analyst. Angel or its associates/analyst has not received any compensation /
managed or co-managed public offering of securities of the company covered by Analyst during the past twelve months. Angel/analyst
has not served as an officer, director or employee of company covered by Analyst and has not been engaged in market making activity
of the company covered by Analyst.
This document is solely for the personal information of the recipient, and must not be singularly used as the basis of any investment
decision. Nothing in this document should be construed as investment or financial advice. Each recipient of this document should
make such investigations as they deem necessary to arrive at an independent evaluation of an investment in the securities of the
companies referred to in this document (including the merits and risks involved), and should consult their own advisors to determine
the merits and risks of such an investment.
Reports based on technical and derivative analysis center on studying charts of a stock's price movement, outstanding positions and
trading volume, as opposed to focusing on a company's fundamentals and, as such, may not match with a report on a company's
fundamentals.
The information in this document has been printed on the basis of publicly available information, internal data and other reliable
sources believed to be true, but we do not represent that it is accurate or complete and it should not be relied on as such, as this
document is for general guidance only. Angel Broking Pvt. Limited or any of its affiliates/ group companies shall not be in any way
responsible for any loss or damage that may arise to any person from any inadvertent error in the information contained in this report.
Angel Broking Pvt. Limited has not independently verified all the information contained within this document. Accordingly, we cannot
testify, nor make any representation or warranty, express or implied, to the accuracy, contents or data contained within this document.
While Angel Broking Pvt. Limited endeavors to update on a reasonable basis the information discussed in this material, there may be
regulatory, compliance, or other reasons that prevent us from doing so.
This document is being supplied to you solely for your information, and its contents, information or data may not be reproduced,
redistributed or passed on, directly or indirectly.
Neither Angel Broking Pvt. Limited, nor its directors, employees or affiliates shall be liable for any loss or damage that may arise from
or in connection with the use of this information.
Note: Please refer to the important ‘Stock Holding Disclosure' report on the Angel website (Research Section). Also, please refer to the
latest update on respective stocks for the disclosure status in respect of those stocks. Angel Broking Pvt. Limited and its affiliates may
have investment positions in the stocks recommended in this report.
5