Technical & Derivatives Report
January 28, 2016
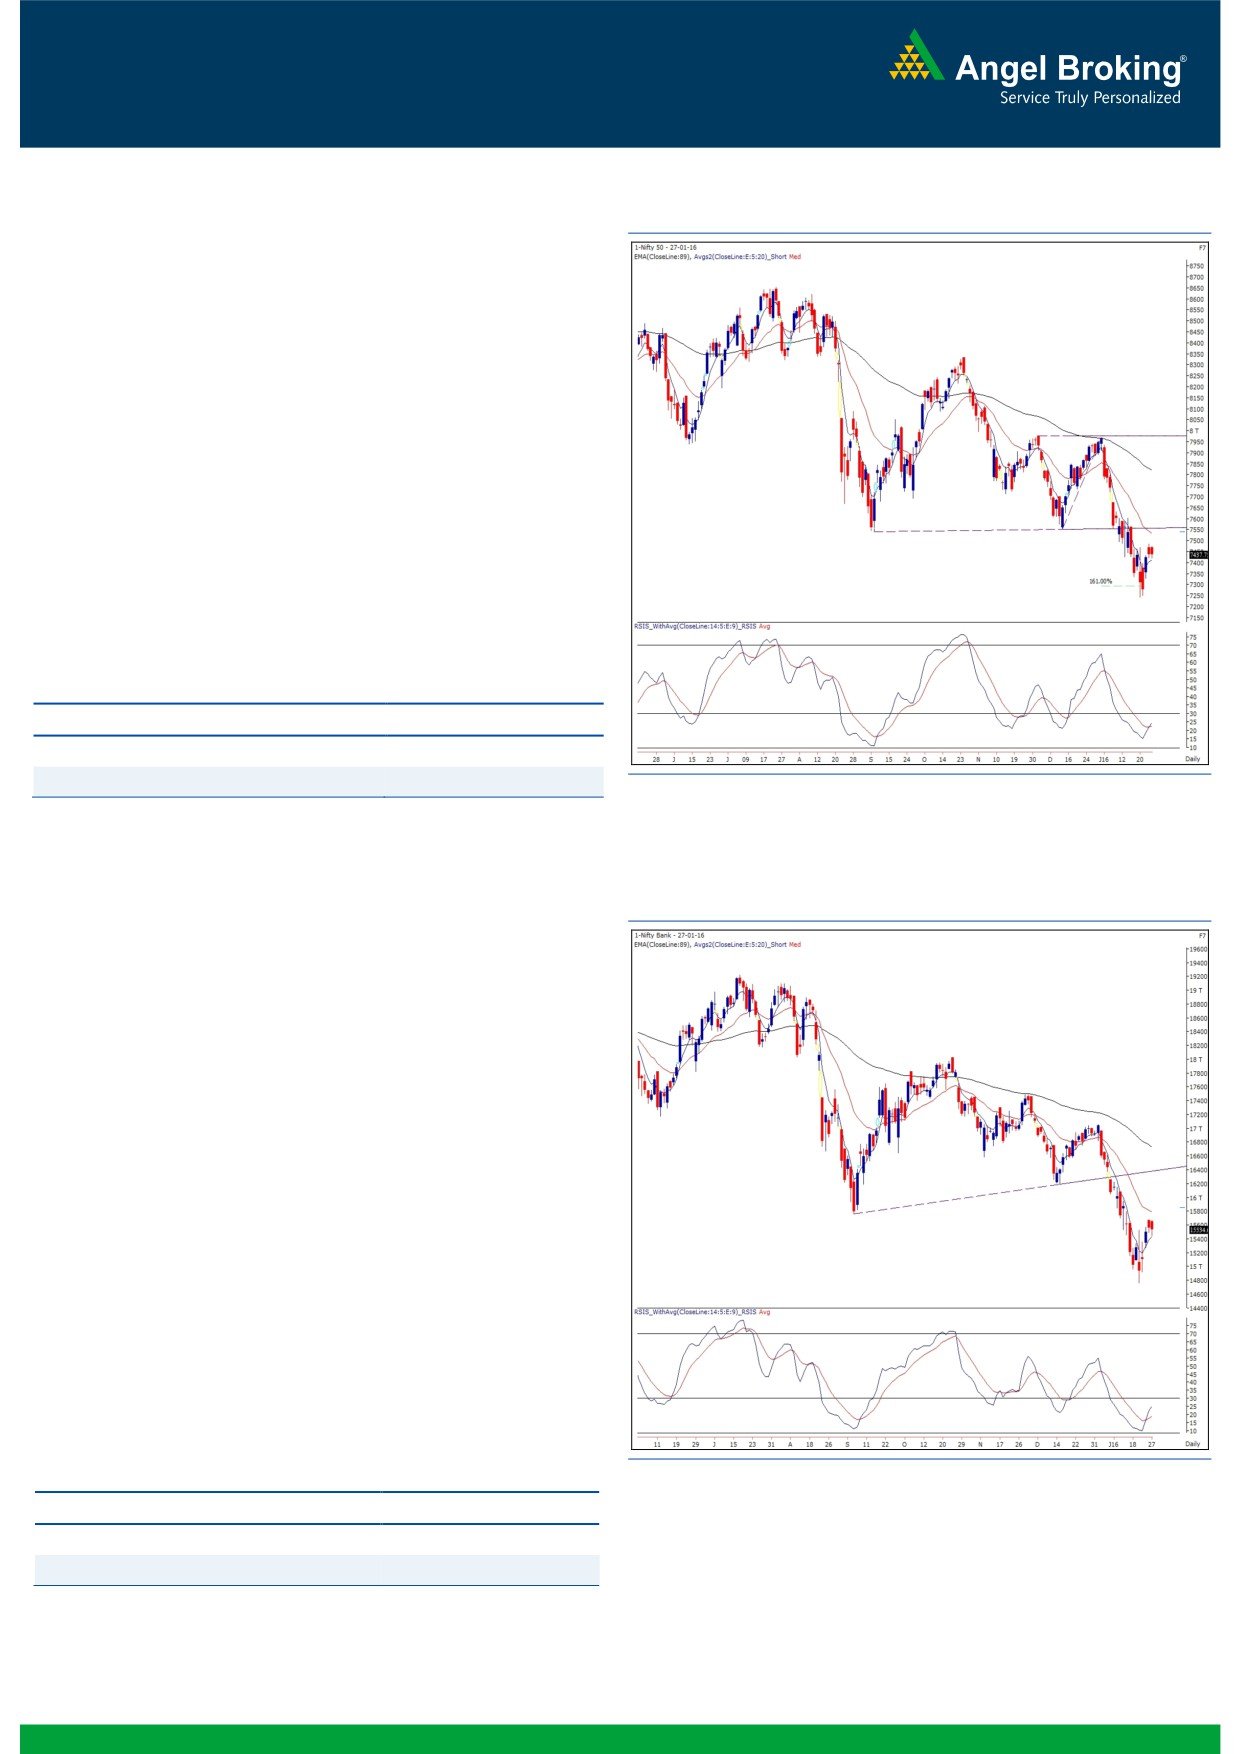
Sensex (24492) / Nifty (7438)
Exhibit 1: Nifty Daily Chart
Yesterday, our markets opened on a subdued note as
compared to Monday’s close. Subsequently, we witnessed a
range bound action within merely
60 points on Nifty
throughout the session to conclude on a flat note.
Technically speaking, we are not observing any major change
in the chart structure, except, a positive crossover in ‘RSI-
Smoothened’ oscillator on daily chart. Considering this
evidence, we maintain our view that the Nifty is likely to extend
this bounce towards 7520 - 7550 levels. On the flipside,
7327 is now seen as an immediate support level for the index.
The coming session may trade with enhanced volatility on
account of January series derivative expiry on NSE. Thus,
traders should make a note of it and accordingly, form your
trading strategies for the day.
Key Levels
Support 1 - 7327
Resistance 1 - 7520
Support 2 - 7241
Resistance 2 - 7550
Exhibit 2: Bank Nifty Daily Chart
Bank Nifty Outlook - (15535)
The Nifty Bank index opened with marginal gains and traded
in a narrow range throughout the session. Eventually, the
banking index ended the session with negligible losses of 0.17
percent over its previous close.
Although the index remained in a narrow range, we witnessed
positive biasness in the PSU banking space which led to gains
of 1.28% in Nifty PSU Bank index and thus it outperformed the
benchmark. The rangebound movement in last couple of
sessions just seems to be a pause within this pullback move.
We are thus, expecting further upside in the Nifty Bank index
in near term. Owing to F&O expiry slated today, we may see
volatility in the stock specific moves and thus traders are
advised to remain light on their positions with proper exit
strategy. For short term trading, the crucial support for the
index is placed around 15425 and 15270 whereas resistances
are seen around 15765 and 16150.
Key Levels
Support 1 - 15425
Resistance 1 - 15765
Support 2 - 15270
Resistance 2 - 16150
1
Technical & Derivatives Report
January 28, 2016
Comments
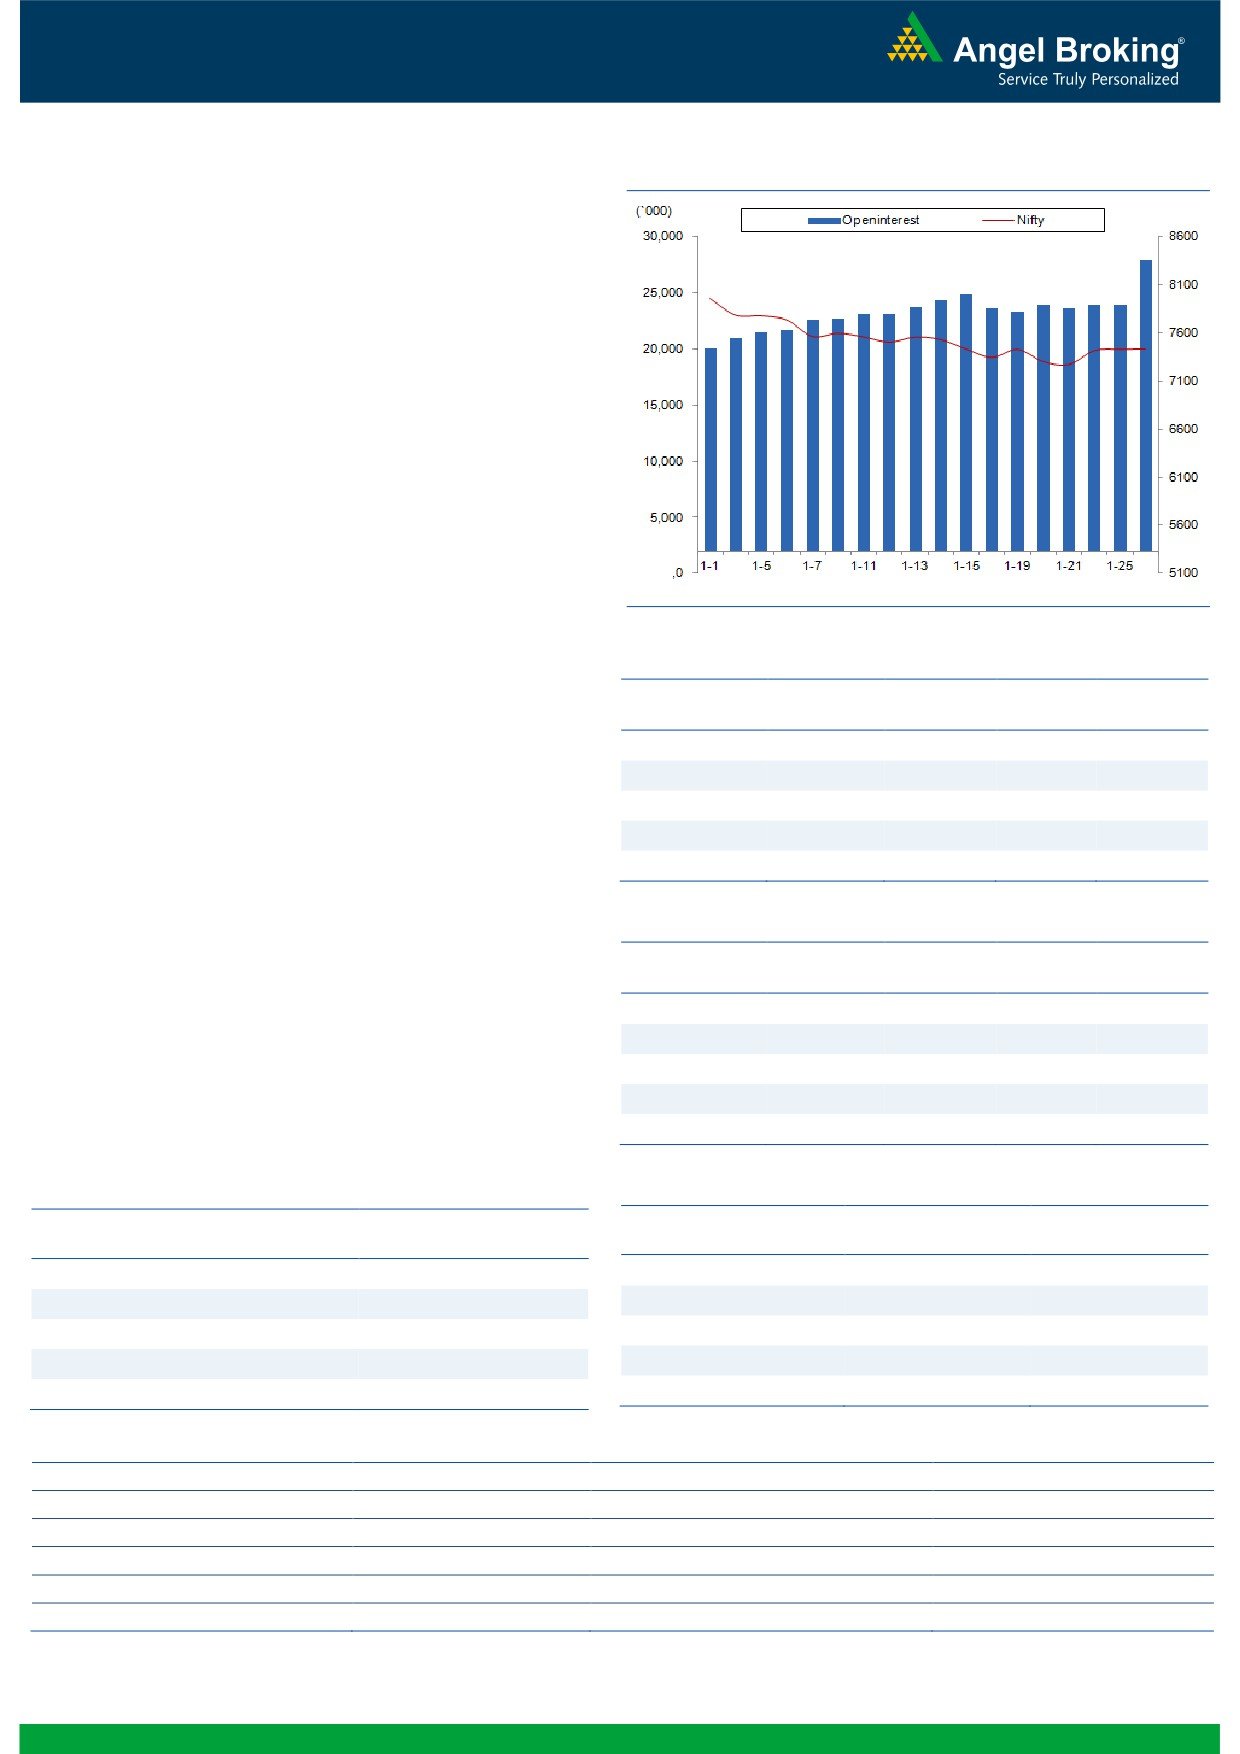
Nifty Vs OI
The Nifty futures open interest has increased by 16.63%
BankNifty futures open interest has decreased by 1.54%
as market closed at 7437.75 levels.
The Nifty January future closed at a discount of 4.35
points against a discount of 0.70 points. The February
series closed at a premium of 5.55 points.
The Implied Volatility of at the money options has
increased from 14.61% to 17.86 %.
The total OI of the market is Rs. 2,66,296/- cr. and the
stock futures OI is Rs. 65,858 /- cr.
Few of the liquid counters where we have seen high cost
of carry are UNITECH, JPASSOCIAT, RELINFRA, GAIL
and FEDERALBNK.
Views
FIIs were net seller in both equity cash and Index future
OI Gainers
segment on Monday. They sold equities to the tune of Rs.
OI
PRICE
SCRIP
OI
PRICE
366 crores; while in Index Futures, they sold worth Rs.
CHG. (%)
CHG. (%)
619 crores with significant rise in OI, indicating short
POWERGRID
27388000
33.18
138.45
3.79
build-up in last trading session.
GODREJCP
302800
26.80
1148.55
-0.46
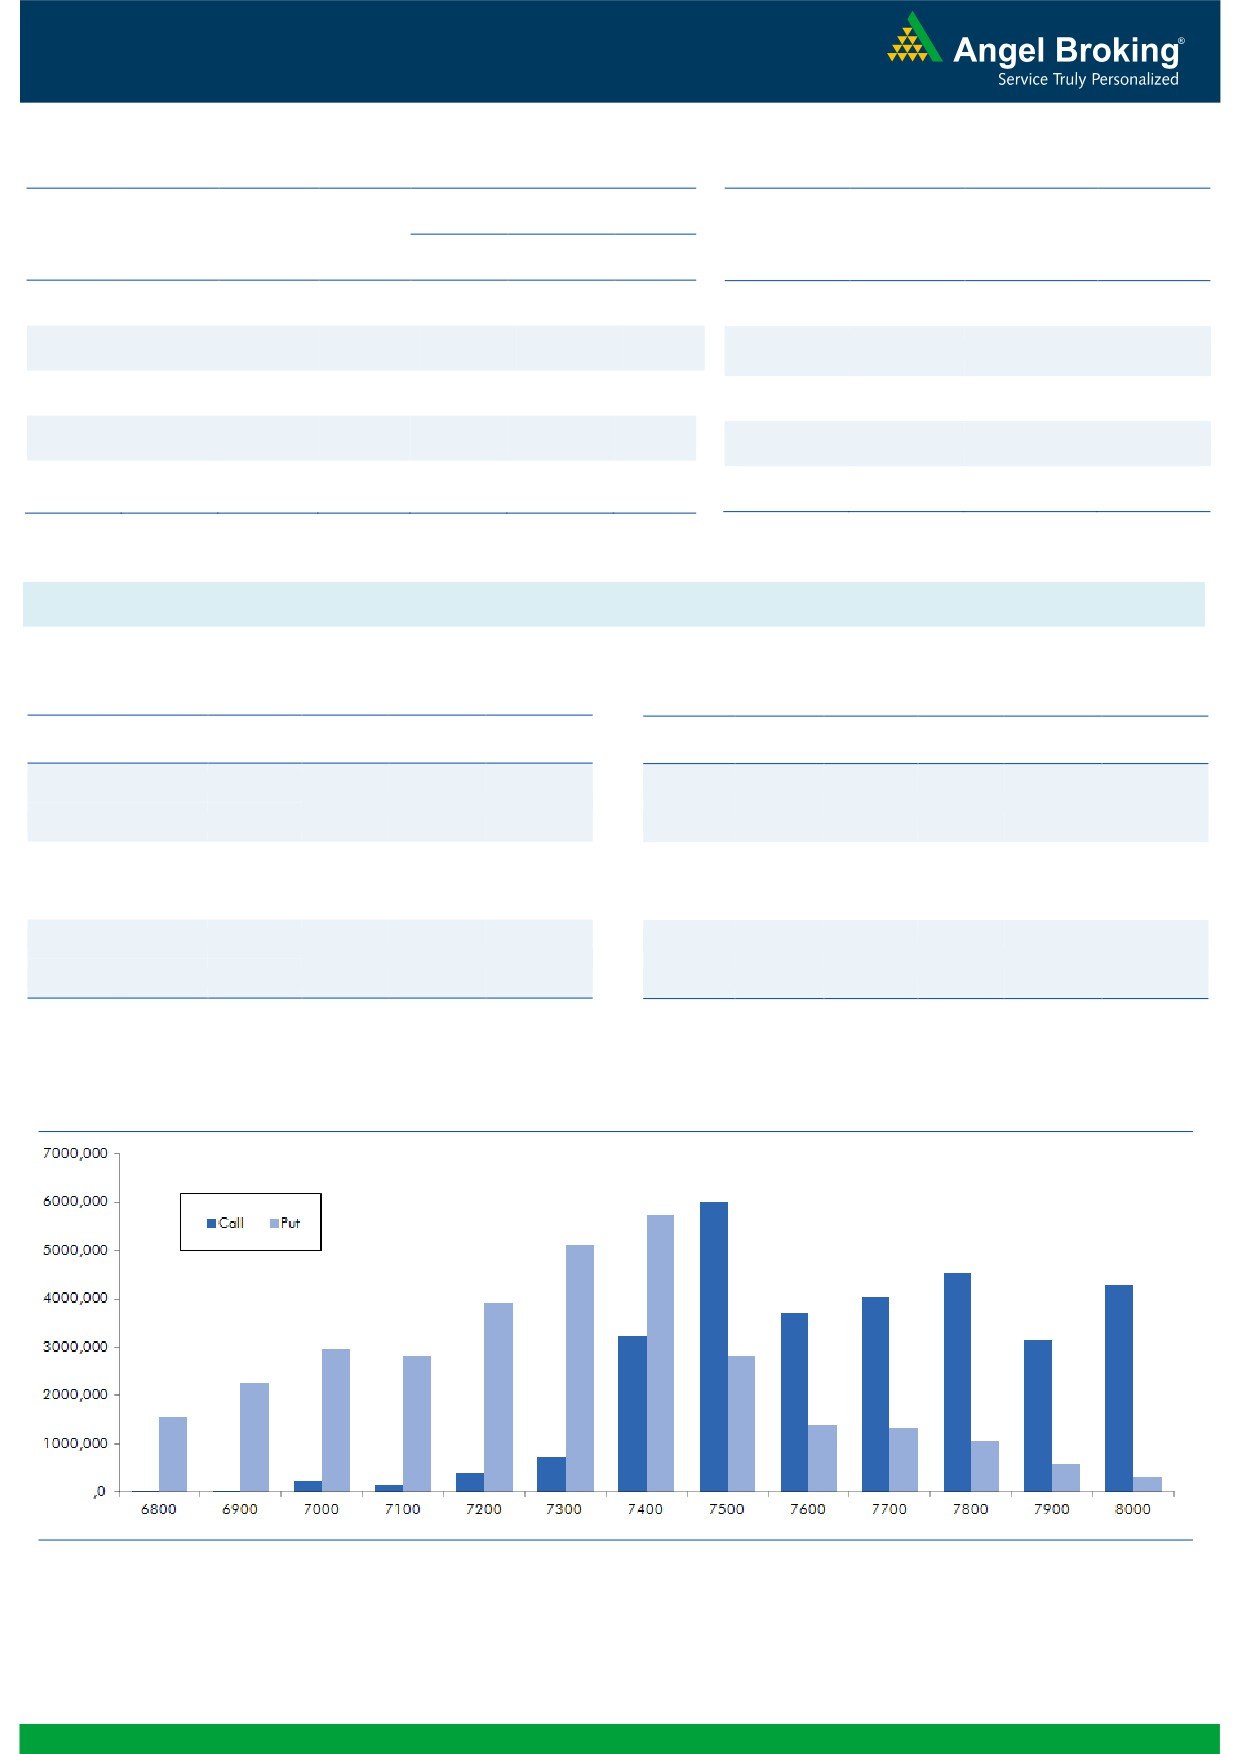
In Index Options front, FII’s were net buyers of Rs. 1051
KSCL
3533250
23.88
327.95
-1.07
crores with marginal change in OI. In call options, 7450
INDUSINDBK
7515000
23.37
908.15
0.31
strike was active and they added some OI. Good amount
ADANIPOWER
95520000
22.02
28.45
0.89
of unwinding was seen in 7600 call options. While in put
options, 7400 strike added good amount of OI, followed
OI Losers
by unwinding in 7300 put option. Maximum build-up in
OI
PRICE
SCRIP
OI
PRICE
current series is now visible in 7500 call and 7400 put
CHG. (%)
CHG. (%)
options. We believe, we may not see any major fall or
ARVIND
4170100
-16.76
314.00
-0.82
bounce in Nifty from current levels in January series.
IOB
14392000
-16.35
26.10
1.56
Nifty may test the resistance zone of 7500-7550 levels;
MCLEODRUSS
3240600
-15.10
148.65
2.62
one should book profits near these levels.
UNIONBANK
16026000
-14.01
130.50
10.17
APOLLOTYRE
9975000
-13.97
145.55
2.36
Historical Volatility
Put-Call Ratio
SCRIP
HV
SCRIP
PCR-OI
PCR-VOL
DIVISLAB
31.40
NIFTY
0.83
0.87
POWERGRID
29.24
BANKNIFTY
0.87
0.99
PIDILITIND
27.28
SBIN
0.34
0.40
UNIONBANK
75.97
RELIANCE
0.39
0.46
HINDZINC
46.93
INFY
1.00
1.31
Strategy Date
Symbol
Strategy
Status
January 04, 2016
SBIN
Ratio Bear Put Spread
Loss booked on Jan 15, 2016
January 11, 2016
TCS
Short Strangle
Profit booked on Jan 18, 2016
January 18, 2016
HINDUNILVR
Short Strangle
Profit booked on Jan 25, 2016
January 25, 2016
TCS
Long Call
Didn’t triggered
2
Technical & Derivatives Report
January 28, 2016
FII Statistics for 27-January 2015
Turnover on 27-January 2015
Open Interest
No. of
Turnover
Change
Detail
Buy
Sell
Net
Instrument
Value
Change
Contracts
( in Cr. )
(%)
Contracts
(in Cr.)
(%)
INDEX
INDEX
7469.20
8088.53
(619.34)
357325
19321.25
14.98
524106
27687.21
27.99
FUTURES
FUTURES
INDEX
INDEX
36358.22
35306.41
1051.81
1638737
89786.70
(0.08)
5590016
305781.04
11.45
OPTIONS
OPTIONS
STOCK
24293.30
23441.03
852.27
1196417
53704.29
6.08
STOCK
FUTURES
1593655
72519.05
32.31
FUTURES
STOCK
STOCK
2200.72
2237.67
(36.95)
101637
4661.66
(1.23)
OPTIONS
339775
16141.93
-0.68
OPTIONS
TOTAL
70321.44
69073.65
1247.79
3294116
167473.90
3.54
TOTAL
8047552
422129.23
15.00
Nifty Spot = 7437.75
Lot Size = 75
Bull-Call Spreads
Bear-Put Spreads
Action
Strike
Price
Risk
Reward
BEP
Action
Strike
Price
Risk
Reward
BEP
Buy
7500
13.45
Buy
7400
24.30
10.60
89.40
7510.60
17.20
82.80
7382.80
Sell
7600
2.85
Sell
7300
7.10
Buy
7500
13.45
Buy
7400
24.30
12.60
187.40
7512.60
21.30
178.70
7378.70
Sell
7700
0.85
Sell
7200
3.00
Buy
7600
2.85
Buy
7300
7.10
2.00
98.00
7602.00
4.10
95.90
7295.90
Sell
7700
0.85
Sell
7200
3.00
Note: Above mentioned Bullish or Bearish Spreads in Nifty (Jan. Series) are given as an information and not as a recommendation.
Nifty Put-Call Analysis
3
Technical & Derivatives Report
January 28, 2016
Daily Pivot Levels for Nifty 50 Stocks
Scrips
S2
S1
PIVOT
R1
R2
ACC
1,214
1,222
1,236
1,244
1,258
ADANIPORTS
211
213
217
219
222
AMBUJACEM
187
189
193
196
200
ASIANPAINT
179
182
184
187
189
AXISBANK
839
849
865
875
892
BAJAJ-AUTO
403
409
418
424
433
BANKBARODA
2,259
2,281
2,307
2,329
2,355
BHARTIARTL
123
126
129
132
135
BHEL
289
293
296
301
304
BOSCHLTD
135
137
142
144
148
BPCL
16,998
17,141
17,383
17,526
17,768
CAIRN
856
863
876
883
896
CIPLA
115
117
118
120
121
COALINDIA
565
573
580
588
596
DRREDDY
295
300
303
307
310
GAIL
2,870
2,921
2,952
3,003
3,034
GRASIM
345
352
357
364
369
HCLTECH
3,372
3,398
3,441
3,467
3,509
HDFC
825
831
836
841
846
HDFCBANK
1,147
1,158
1,173
1,185
1,200
HEROMOTOCO
1,023
1,030
1,039
1,045
1,055
HINDALCO
2,429
2,456
2,502
2,529
2,575
HINDUNILVR
70
70
72
72
74
ICICIBANK
755
762
773
779
790
IDEA
233
235
237
240
242
INDUSINDBK
105
107
109
111
113
INFY
864
886
902
924
940
ITC
1,126
1,132
1,141
1,147
1,156
KOTAKBANK
304
309
311
316
319
LT
658
667
674
683
691
LUPIN
1,085
1,096
1,109
1,121
1,134
M&M
1,626
1,658
1,691
1,723
1,756
MARUTI
1,127
1,152
1,175
1,200
1,223
NTPC
4,041
4,076
4,128
4,163
4,215
ONGC
136
140
142
146
148
PNB
214
216
219
221
224
POWERGRID
89
91
93
95
97
RELIANCE
131
135
137
141
143
SBIN
989
994
1,002
1,007
1,015
VEDL
62
63
64
65
67
SUNPHARMA
804
813
818
827
832
TATAMOTORS
329
333
337
341
345
TATAPOWER
60
61
62
62
63
TATASTEEL
250
254
257
261
263
TCS
2,262
2,291
2,311
2,339
2,359
TECHM
492
498
507
512
521
ULTRACEMCO
2,714
2,733
2,759
2,778
2,804
WIPRO
539
546
550
557
562
YESBANK
656
667
676
687
696
ZEEL
391
394
396
399
402
4
Technical & Derivatives Report
January 28, 2016
Research Team Tel: 022 - 39357800
For Technical Queries
For Derivatives Queries
DISCLAIMER
Angel Broking Private Limited (hereinafter referred to as “Angel”) is a registered Member of National Stock Exchange of India Limited,
Bombay Stock Exchange Limited and MCX Stock Exchange Limited. It is also registered as a Depository Participant with CDSL and
Portfolio Manager with SEBI. It also has registration with AMFI as a Mutual Fund Distributor. Angel Broking Private Limited is a
registered entity with SEBI for Research Analyst in terms of SEBI (Research Analyst) Regulations, 2014 vide registration number
INH000000164. Angel or its associates has not been debarred/ suspended by SEBI or any other regulatory authority for accessing
/dealing in securities Market. Angel or its associates including its relatives/analyst do not hold any financial interest/beneficial
ownership of more than 1% in the company covered by Analyst. Angel or its associates/analyst has not received any compensation /
managed or co-managed public offering of securities of the company covered by Analyst during the past twelve months. Angel/analyst
has not served as an officer, director or employee of company covered by Analyst and has not been engaged in market making activity
of the company covered by Analyst.
This document is solely for the personal information of the recipient, and must not be singularly used as the basis of any investment
decision. Nothing in this document should be construed as investment or financial advice. Each recipient of this document should
make such investigations as they deem necessary to arrive at an independent evaluation of an investment in the securities of the
companies referred to in this document (including the merits and risks involved), and should consult their own advisors to determine
the merits and risks of such an investment.
Reports based on technical and derivative analysis center on studying charts of a stock's price movement, outstanding positions and
trading volume, as opposed to focusing on a company's fundamentals and, as such, may not match with a report on a company's
fundamentals.
The information in this document has been printed on the basis of publicly available information, internal data and other reliable
sources believed to be true, but we do not represent that it is accurate or complete and it should not be relied on as such, as this
document is for general guidance only. Angel Broking Pvt. Limited or any of its affiliates/ group companies shall not be in any way
responsible for any loss or damage that may arise to any person from any inadvertent error in the information contained in this report.
Angel Broking Pvt. Limited has not independently verified all the information contained within this document. Accordingly, we cannot
testify, nor make any representation or warranty, express or implied, to the accuracy, contents or data contained within this document.
While Angel Broking Pvt. Limited endeavors to update on a reasonable basis the information discussed in this material, there may be
regulatory, compliance, or other reasons that prevent us from doing so.
This document is being supplied to you solely for your information, and its contents, information or data may not be reproduced,
redistributed or passed on, directly or indirectly.
Neither Angel Broking Pvt. Limited, nor its directors, employees or affiliates shall be liable for any loss or damage that may arise from
or in connection with the use of this information.
Note: Please refer to the important ‘Stock Holding Disclosure' report on the Angel website (Research Section). Also, please refer to the
latest update on respective stocks for the disclosure status in respect of those stocks. Angel Broking Pvt. Limited and its affiliates may
have investment positions in the stocks recommended in this report.
5