Technical & Derivatives Report
December 27, 2016
Sensex (25807) / Nifty (7908)
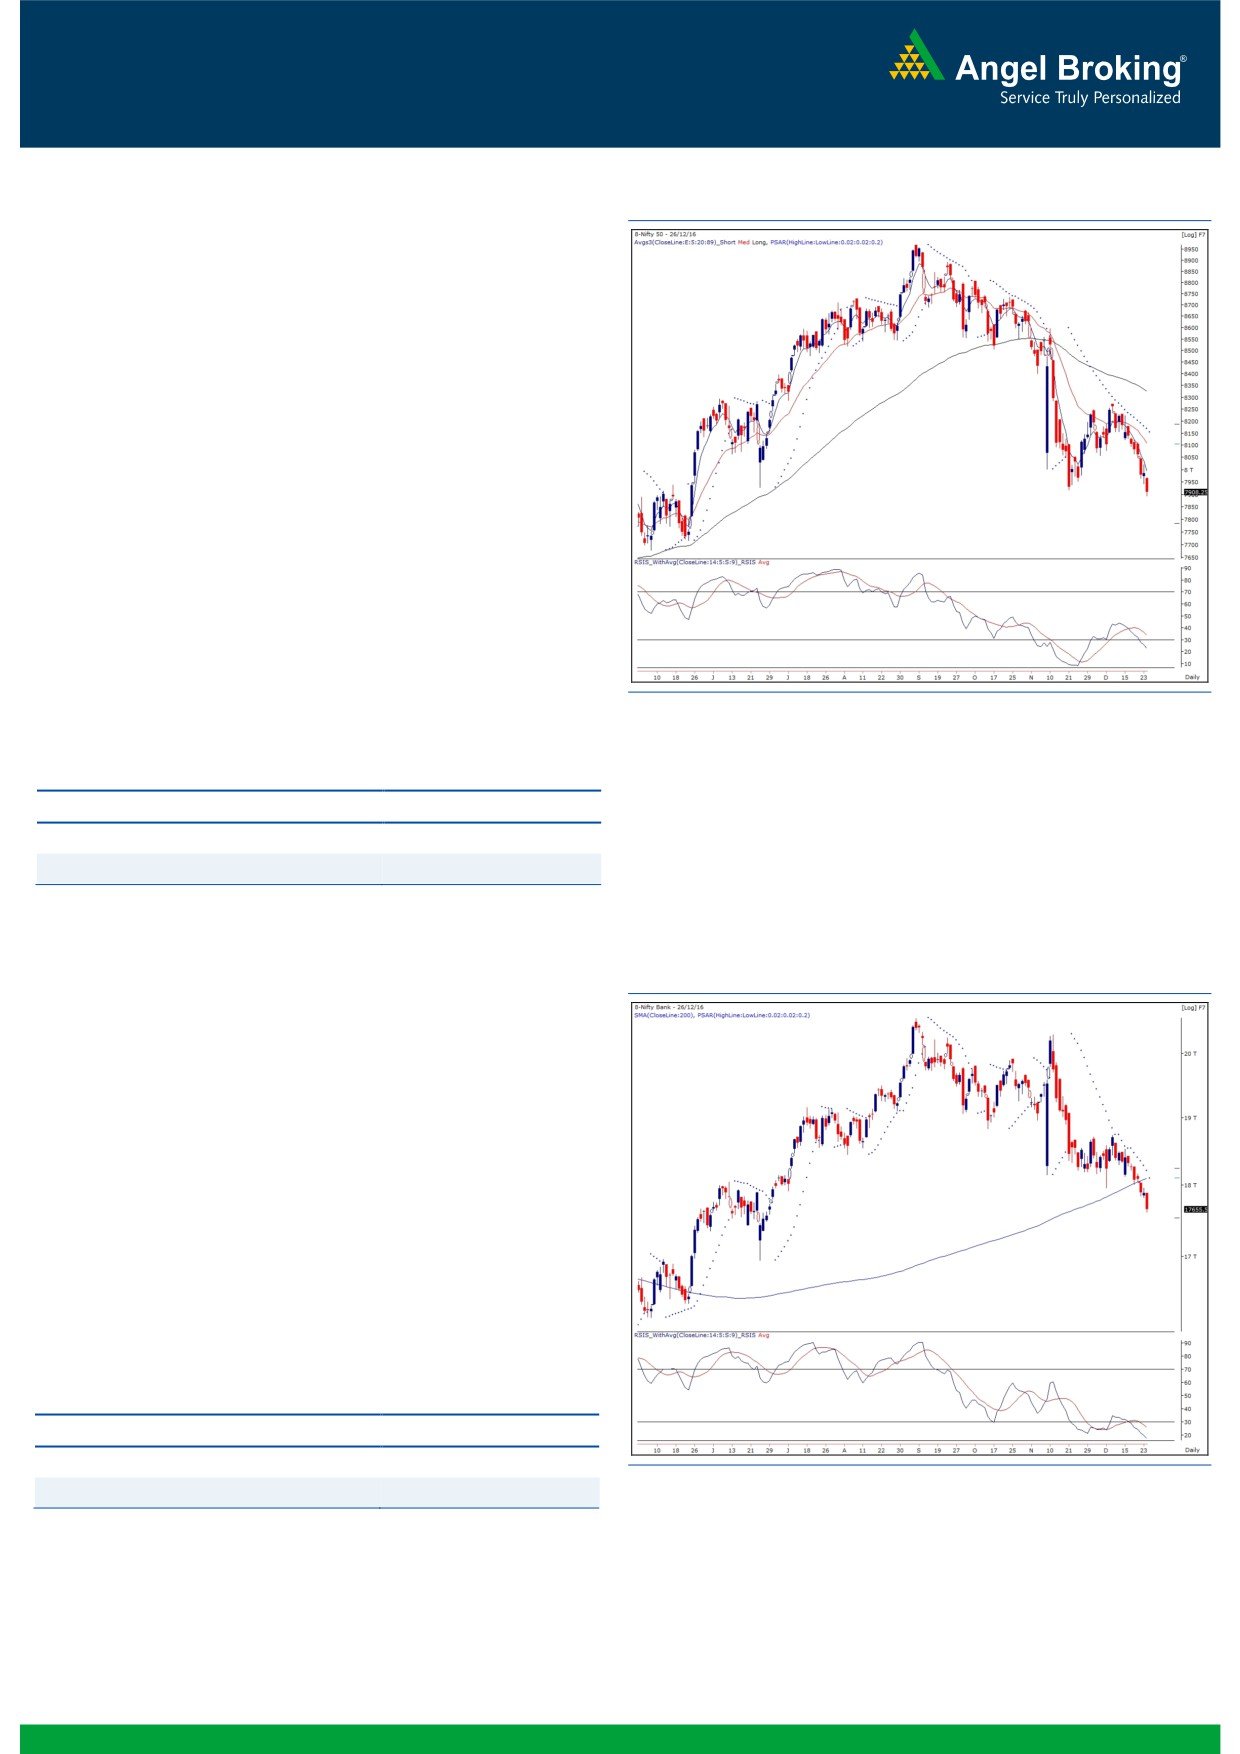
Exhibit 1: Nifty Daily Chart
A breather on Friday was followed by yet another gap down
opening to start the proceedings for the concluding week of the
calendar year. The price movement was certainly not so
encouraging as the Nifty slipped below the important swing low
of 7916.40 to post a new seven-month low.
Honestly speaking, we were not expecting this corrective move to
extend below 8000; but, it has happened and thus, we need to
now reassess the price development for next couple of days.
Although, considering multiple technical evidences, we do not
expect any major downside form current level, we would like to
stay on the sidelines and wait for a clear trend reversal on charts.
We continue with our opinion that one should stay away from
creating fresh short positions as the market seems extremely
oversold. For the coming session, yesterday’s high of 7970 would
act as an immediate hurdle, whereas a sustainable move below
yesterday’s low 7893.80 may lead to further weakness towards
7876 - 7850 levels.
Key Levels
Support 1 - 7876
Resistance 1 - 7970
Support 2 - 7850
Resistance 2 - 8000
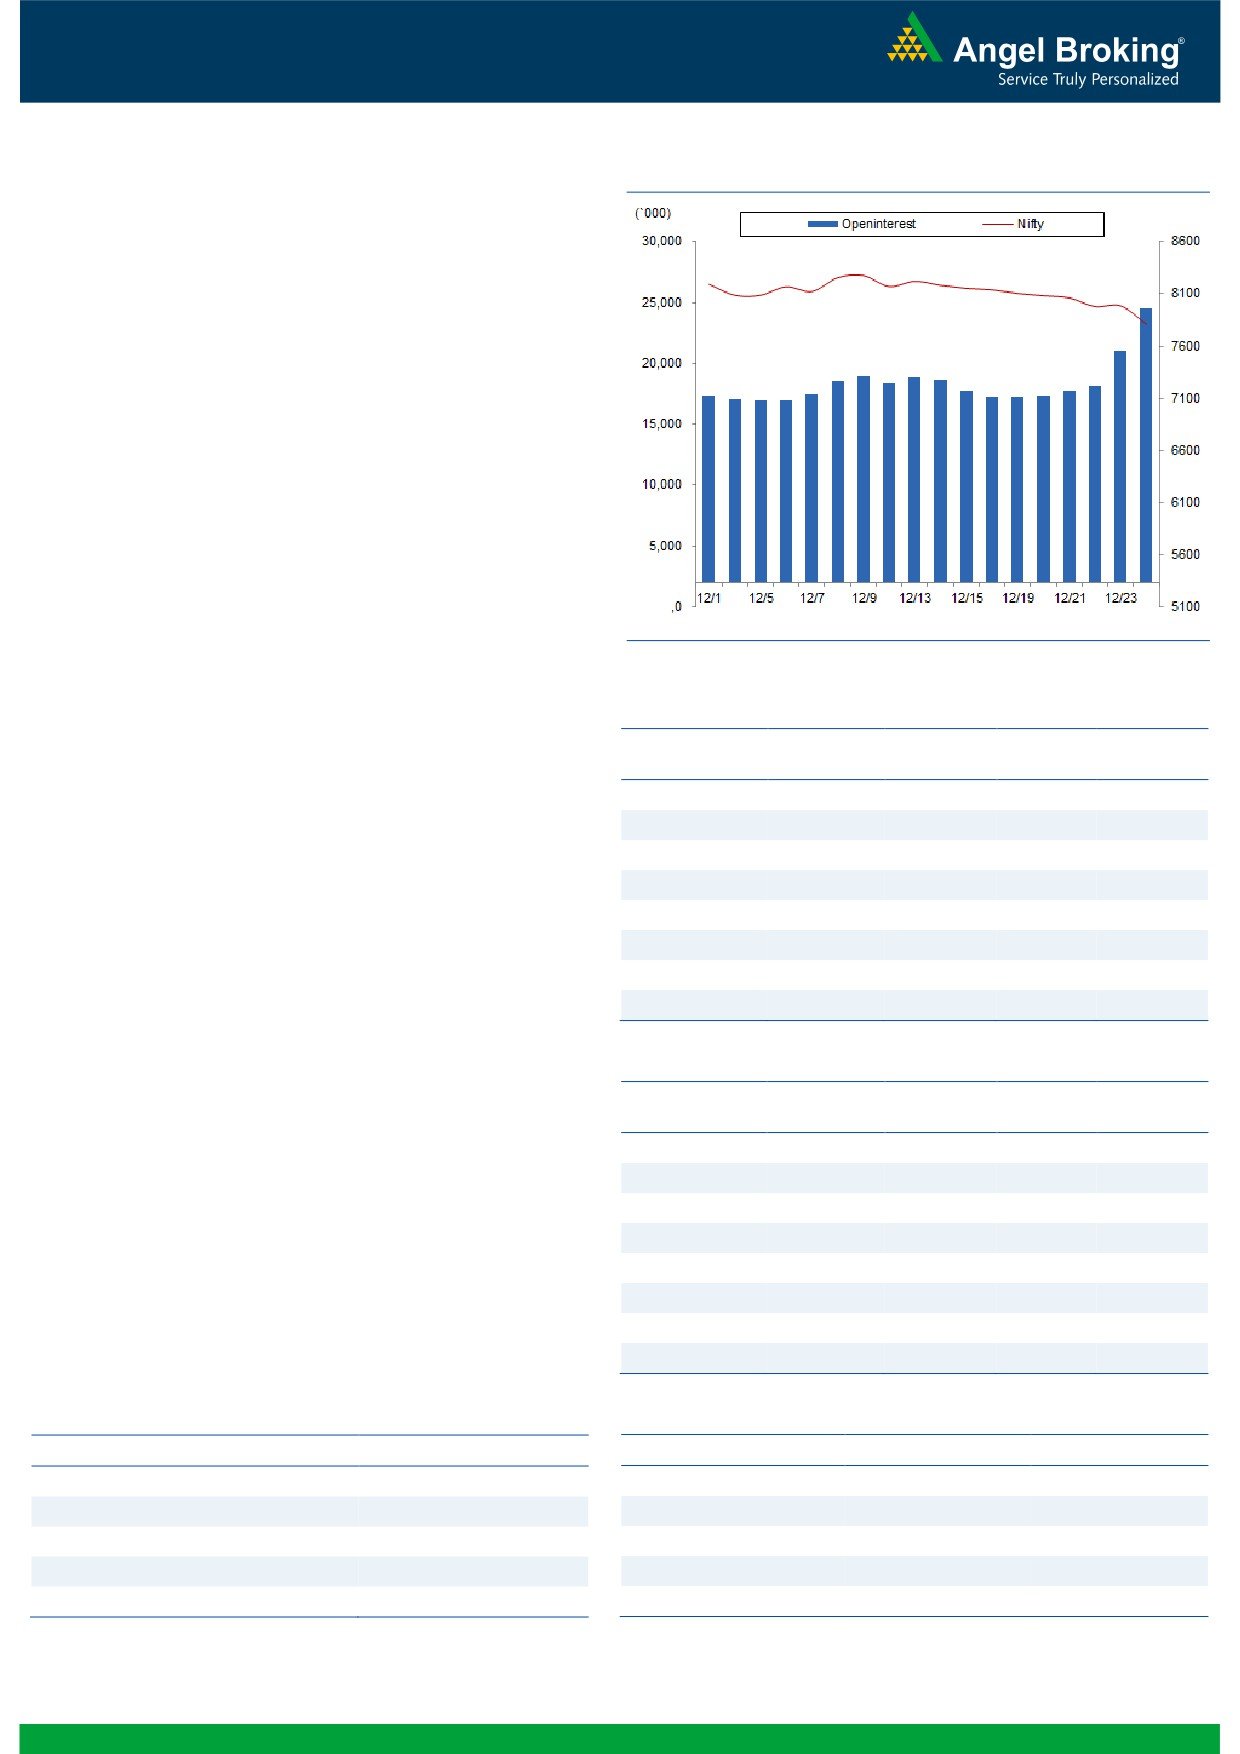
Nifty Bank Outlook - (17656)
Exhibit 2: Nifty Bank Daily Chart
The Nifty Bank index continued its corrective move and ended
yesterday's session with loss of 1.28 percent.
As of now, the bears seem to be in control over the stocks within
the sector as the index continued its corrective move below the
'200 SMA'. The PSU Banks were clearly under pressure yesterday
as the Nifty PSU Bank index lost 2.70 percent. The index is
trading near the weekly '89EMA' support which is placed around
17600. However, unless signs of reversal seen, traders are
advised to avoid trading in the index and trade on stock specific
moves. The intraday supports for the Nifty Bank index are placed
around 17600 and 17498 whereas resistances are seen around
17820 and 17900.
Key Levels
Support 1 - 17600
Resistance 1 - 17820
Support 2 - 17498
Resistance 2 - 17900
1
Technical & Derivatives Report
December 27, 2016
Comments
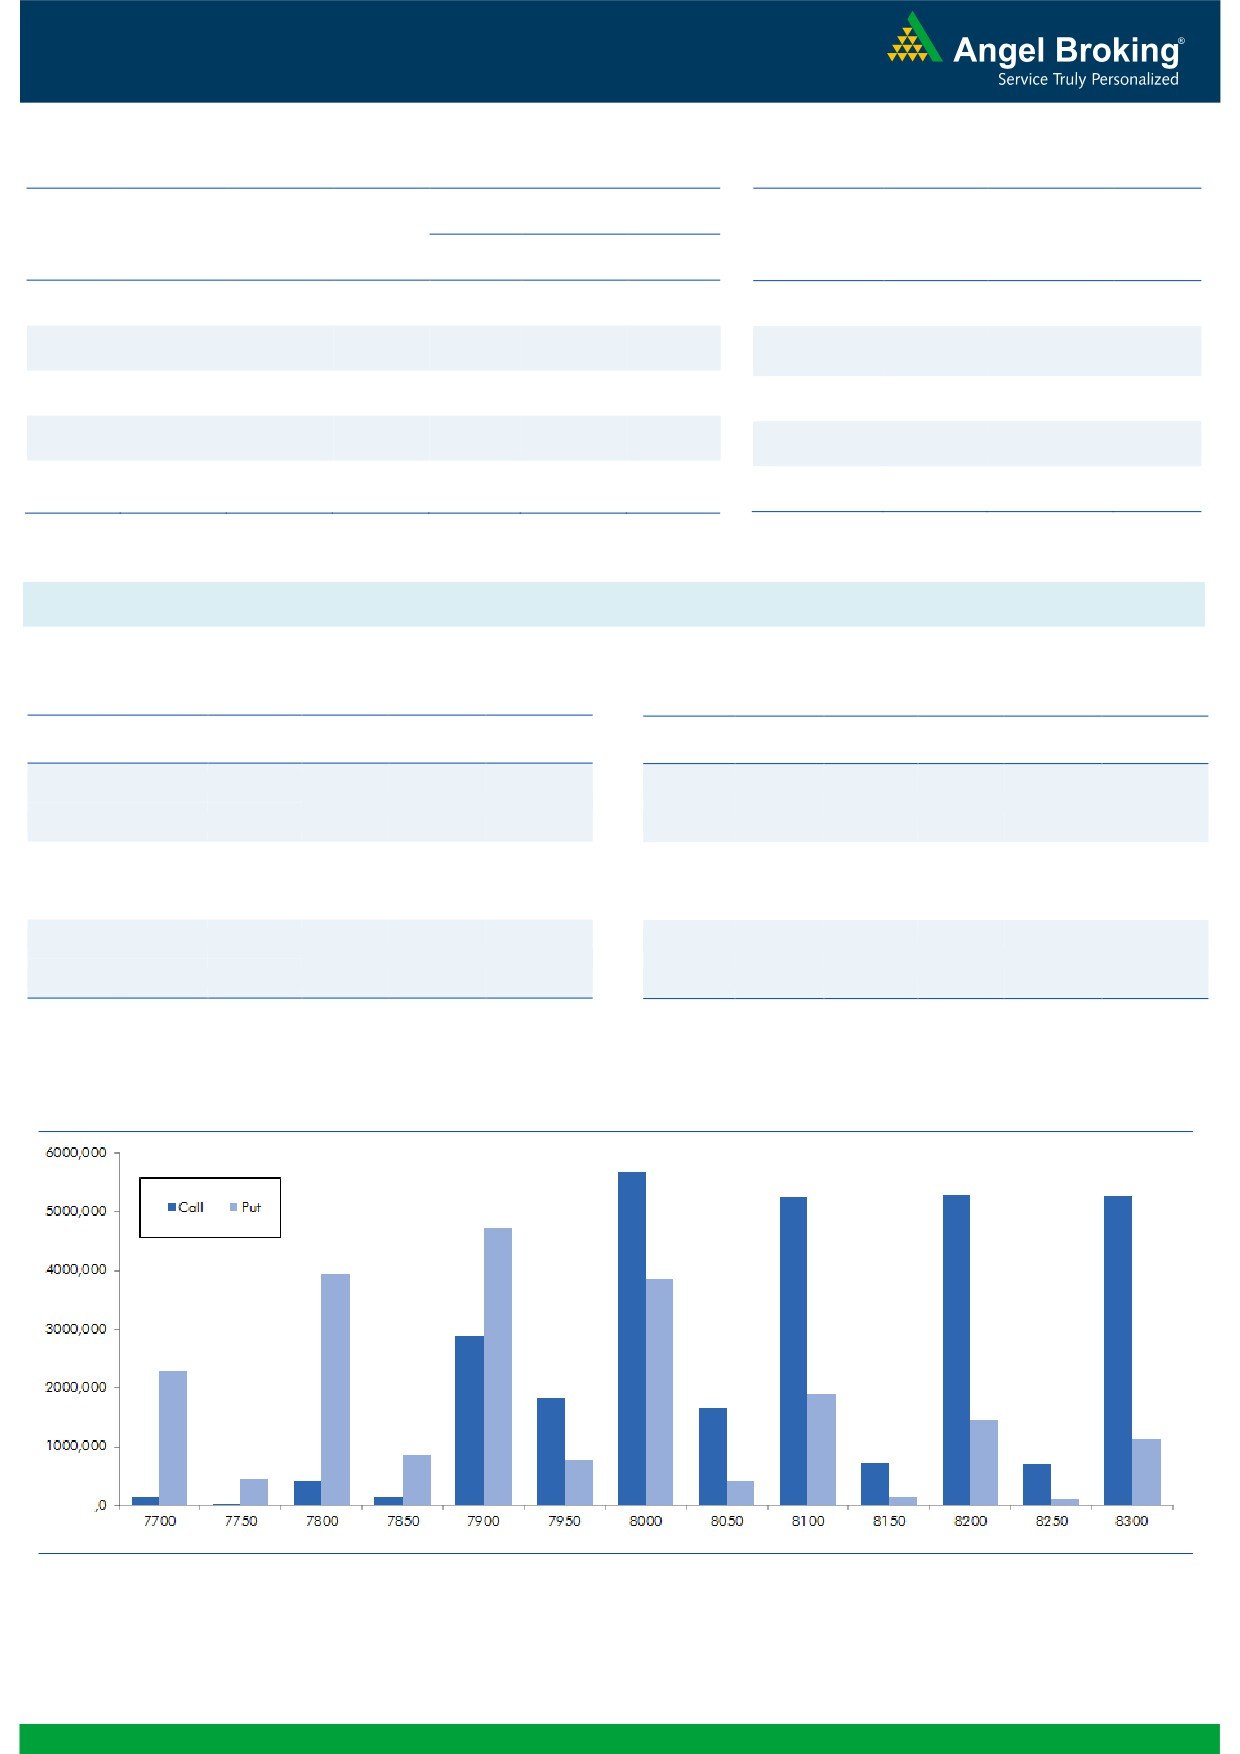
Nifty Vs OI
The Nifty futures open interest has increased by 16.55%
BankNifty futures open interest has increased by 8.76%
as market closed at 7908.25 levels.
The Nifty December future closed with a premium of
3.05 against the premium of 9.25 points in last trading
session. The January series closed at a premium of
34.35 points.
The Implied Volatility of at the money options has
increased from 11.94 % to 14.84%. At the same time,
the PCR-OI of Nifty has decreased from 0.92 to 0.83
levels.
The total OI of the market is Rs. 2,83,096/- cr. and the
stock futures OI is Rs. 73,119/- cr.
Few of the liquid counters where we have seen high cost
of carry are GMRINFRA, JINDALSTEL, RPOWER,
ADANIPOWER and MINDTREE.
Views
OI Gainers
FIIs continued their selling streak in cash segment; they
OI
PRICE
sold equities worth Rs. 1095 crores. While in index
SCRIP
OI
PRICE
CHG. (%)
CHG. (%)
futures, they were marginal buyers with significant rise in
DIVISLAB
3238800
48.05
763.95
-11.50
open interest, indicating formation of huge positions on
HDIL
31440000
17.70
54.25
-6.71
both long and short side in previous trading session.
BANKBARODA
50781500
16.93
147.70
-3.50
www.angelbroking.com
In index option segment, FIIs bought worth Rs.
956
RPOWER
65532000
14.10
39.65
-3.88
crores with negligible change in open interest. In call
ASIANPAINT
7004400
11.10
868.55
-0.64
options, significant build-up was visible in 7900-8000
CUMMINSIND
738600
10.11
790.90
-1.04
strikes and we believe these are longs formed by retailers
JUBLFOOD
2779000
10.04
787.55
0.36
in the hope of market recovering from current levels.
MARICO
9235200
8.29
239.70
-2.52
While in put options, we hardly saw any relevant OI
addition. However, good amount of unwinding was seen
OI Losers
in 8000 put option. Highest OI in current series has been
OI
PRICE
shifted from 8300 to 8000 call and of put option from
SCRIP
OI
PRICE
CHG. (%)
CHG. (%)
8000 to 7900 strike price.
BHARATFIN
13615000
-10.90
479.55
-7.93
Since past three trading session, we are witnessing
CANBK
15066000
-8.24
263.30
-5.76
significant open interest addition in Index Futures, which
L&TFH
29862000
-5.98
81.75
-3.02
are blend of both long and short positions. While in cash
TVSMOTOR
7888000
-5.47
366.65
-0.91
segment FIIs continue their selling. Hence, considering
CONCOR
662000
-5.29
1095.25
-0.45
the above data, we would like to wait for some clear
WOCKPHARMA
3697800
-5.27
634.85
-4.31
indication on direction front. Traders are suggested to
CEATLTD
1675800
-4.92
1137.25
-0.85
remain light in Index and prefer stock specific approach
M&MFIN
10975000
-3.52
249.85
-2.69
to trade as of now.
Historical Volatility
Put-Call Ratio
SCRIP
HV
SCRIP
PCR-OI
PCR-VOL
SOUTHBANK
44.73
NIFTY
0.83
0.83
CIPLA
37.83
BANKNIFTY
0.92
0.80
ENGINERSIN
51.53
SUNPHARMA
0.42
0.53
CANBK
45.64
SBIN
0.46
0.49
NIITTECH
33.18
INFY
0.63
0.68
2
Technical & Derivatives Report
December 27, 2016
FII Statistics for December 26, 2016
Turnover on December 26, 2016
Open Interest
No. of
Turnover
Change
Detail
Buy
Sell
Net
Instrument
Value
Change
Contracts
( in Cr. )
(%)
Contracts
(in Cr.)
(%)
INDEX
INDEX
3203.97
3105.93
98.04
262935
16076.18
21.87
275195
16377.69
1.74
FUTURES
FUTURES
INDEX
INDEX
27471.46
26515.48
955.98
1170418
70766.80
0.79
7496361
309714.69
16.12
OPTIONS
OPTIONS
STOCK
14872.41
14796.95
75.45
953241
54974.68
1.66
STOCK
FUTURES
543401
50624.57
16.27
FUTURES
STOCK
STOCK
4002.97
4051.26
(48.30)
94652
5776.12
1.37
OPTIONS
325774
24554.83
0.68
OPTIONS
TOTAL
49550.81
48469.63
1081.18
2481246
147593.78
3.04
TOTAL
8640731
401271.77
14.40
Nifty Spot = 7908.25
Lot Size = 75
Bull-Call Spreads
Bear-Put Spreads
Action
Strike
Price
Risk
Reward
BEP
Action
Strike
Price
Risk
Reward
BEP
Buy
7900
46.10
Buy
7900
39.00
33.35
66.65
7933.35
26.55
73.45
7873.45
Sell
8000
12.75
Sell
7800
12.45
Buy
7900
46.10
Buy
7900
39.00
42.85
157.15
7942.85
34.70
165.30
7865.30
Sell
8100
3.25
Sell
7700
4.30
Buy
8000
12.75
Buy
7800
12.45
9.50
90.50
8009.50
8.15
91.85
7791.85
Sell
8100
3.25
Sell
7700
4.30
Note: Above mentioned Bullish or Bearish Spreads in Nifty (December Series) are given as an information and not as a recommendation.
Nifty Put-Call Analysis
3
Technical & Derivatives Report
December 27, 2016
Daily Pivot Levels for Nifty Constituents
Scrips
S2
S1
PIVOT
R1
R2
ACC
1,269
1,277
1,286
1,293
1,302
ADANIPORTS
255
258
260
262
265
AMBUJACEM
195
197
199
201
203
ASIANPAINT
846
857
871
882
896
AUROPHARMA
607
616
631
640
655
AXISBANK
423
427
432
436
440
BAJAJ-AUTO
2,537
2,569
2,609
2,641
2,682
BANKBARODA
142
145
149
151
155
BHEL
115
116
118
119
120
BPCL
594
598
605
609
615
BHARTIARTL
286
291
294
299
302
INFRATEL
316
322
330
336
344
BOSCH
18,986
19,152
19,401
19,567
19,816
CIPLA
528
542
561
575
595
COALINDIA
280
282
285
288
291
DRREDDY
2,949
2,967
2,998
3,016
3,047
EICHERMOT
19,811
20,042
20,459
20,690
21,107
GAIL
419
424
429
433
438
GRASIM
802
808
818
825
835
HCLTECH
776
783
791
798
805
HDFCBANK
1,161
1,168
1,177
1,184
1,193
HDFC
1,198
1,209
1,217
1,227
1,235
HEROMOTOCO
2,936
2,972
3,011
3,047
3,086
HINDALCO
145
148
153
156
161
HINDUNILVR
777
790
797
809
817
ICICIBANK
244
246
249
251
255
IDEA
68
69
70
71
72
INDUSINDBK
1,042
1,051
1,058
1,067
1,074
INFY
965
974
984
993
1,003
ITC
220
223
224
227
228
KOTAKBANK
700
706
710
715
720
LT
1,307
1,322
1,334
1,349
1,360
LUPIN
1,355
1,379
1,421
1,445
1,487
M&M
1,129
1,139
1,156
1,166
1,183
MARUTI
5,085
5,126
5,192
5,233
5,299
NTPC
158
159
160
162
163
ONGC
185
187
190
192
195
POWERGRID
176
177
180
181
184
RELIANCE
1,031
1,039
1,053
1,061
1,074
SBIN
241
242
245
247
250
SUNPHARMA
600
606
615
621
630
TCS
2,251
2,272
2,287
2,308
2,323
TATAMTRDVR
282
285
289
292
296
TATAMOTORS
450
454
460
464
470
TATAPOWER
73
73
74
74
75
TATASTEEL
372
376
383
387
394
TECHM
456
460
464
468
472
ULTRACEMCO
3,039
3,064
3,092
3,117
3,145
WIPRO
449
453
457
460
464
YESBANK
1,074
1,088
1,104
1,118
1,135
ZEEL
423
427
435
439
446
4
Technical & Derivatives Report
December 27, 2016
Research Team Tel: 022 - 39357800
For Technical Queries
For Derivatives Queries
DISCLAIMER
Angel Broking Private Limited (hereinafter referred to as “Angel”) is a registered Member of National Stock Exchange of India Limited,
Bombay Stock Exchange Limited and Metropolitan Stock Exchange Limited. It is also registered as a Depository Participant with CDSL
and Portfolio Manager with SEBI. It also has registration with AMFI as a Mutual Fund Distributor. Angel Broking Private Limited is a
registered entity with SEBI for Research Analyst in terms of SEBI (Research Analyst) Regulations, 2014 vide registration number
INH000000164. Angel or its associates has not been debarred/ suspended by SEBI or any other regulatory authority for accessing
/dealing in securities Market. Angel or its associates/analyst has not received any compensation / managed or co-managed public
offering of securities of the company covered by Analyst during the past twelve months.
This document is solely for the personal information of the recipient, and must not be singularly used as the basis of any investment
decision. Nothing in this document should be construed as investment or financial advice. Each recipient of this document should
make such investigations as they deem necessary to arrive at an independent evaluation of an investment in the securities of the
companies referred to in this document (including the merits and risks involved), and should consult their own advisors to determine
the merits and risks of such an investment.
Reports based on technical and derivative analysis center on studying charts of a stock's price movement, outstanding positions and
trading volume, as opposed to focusing on a company's fundamentals and, as such, may not match with a report on a company's
fundamentals. Investors are advised to refer the Fundamental and Technical Research Reports available on our website to evaluate the
contrary view, if any.
The information in this document has been printed on the basis of publicly available information, internal data and other reliable
sources believed to be true, but we do not represent that it is accurate or complete and it should not be relied on as such, as this
document is for general guidance only. Angel Broking Pvt. Limited or any of its affiliates/ group companies shall not be in any way
responsible for any loss or damage that may arise to any person from any inadvertent error in the information contained in this report.
Angel Broking Pvt. Limited has not independently verified all the information contained within this document. Accordingly, we cannot
testify, nor make any representation or warranty, express or implied, to the accuracy, contents or data contained within this document.
While Angel Broking Pvt. Limited endeavors to update on a reasonable basis the information discussed in this material, there may be
regulatory, compliance, or other reasons that prevent us from doing so.
This document is being supplied to you solely for your information, and its contents, information or data may not be reproduced,
redistributed or passed on, directly or indirectly.
Neither Angel Broking Pvt. Limited, nor its directors, employees or affiliates shall be liable for any loss or damage that may arise from
or in connection with the use of this information.
5