Technical & Derivatives Report
November 27, 2015
Sensex (25959) / Nifty (7884)
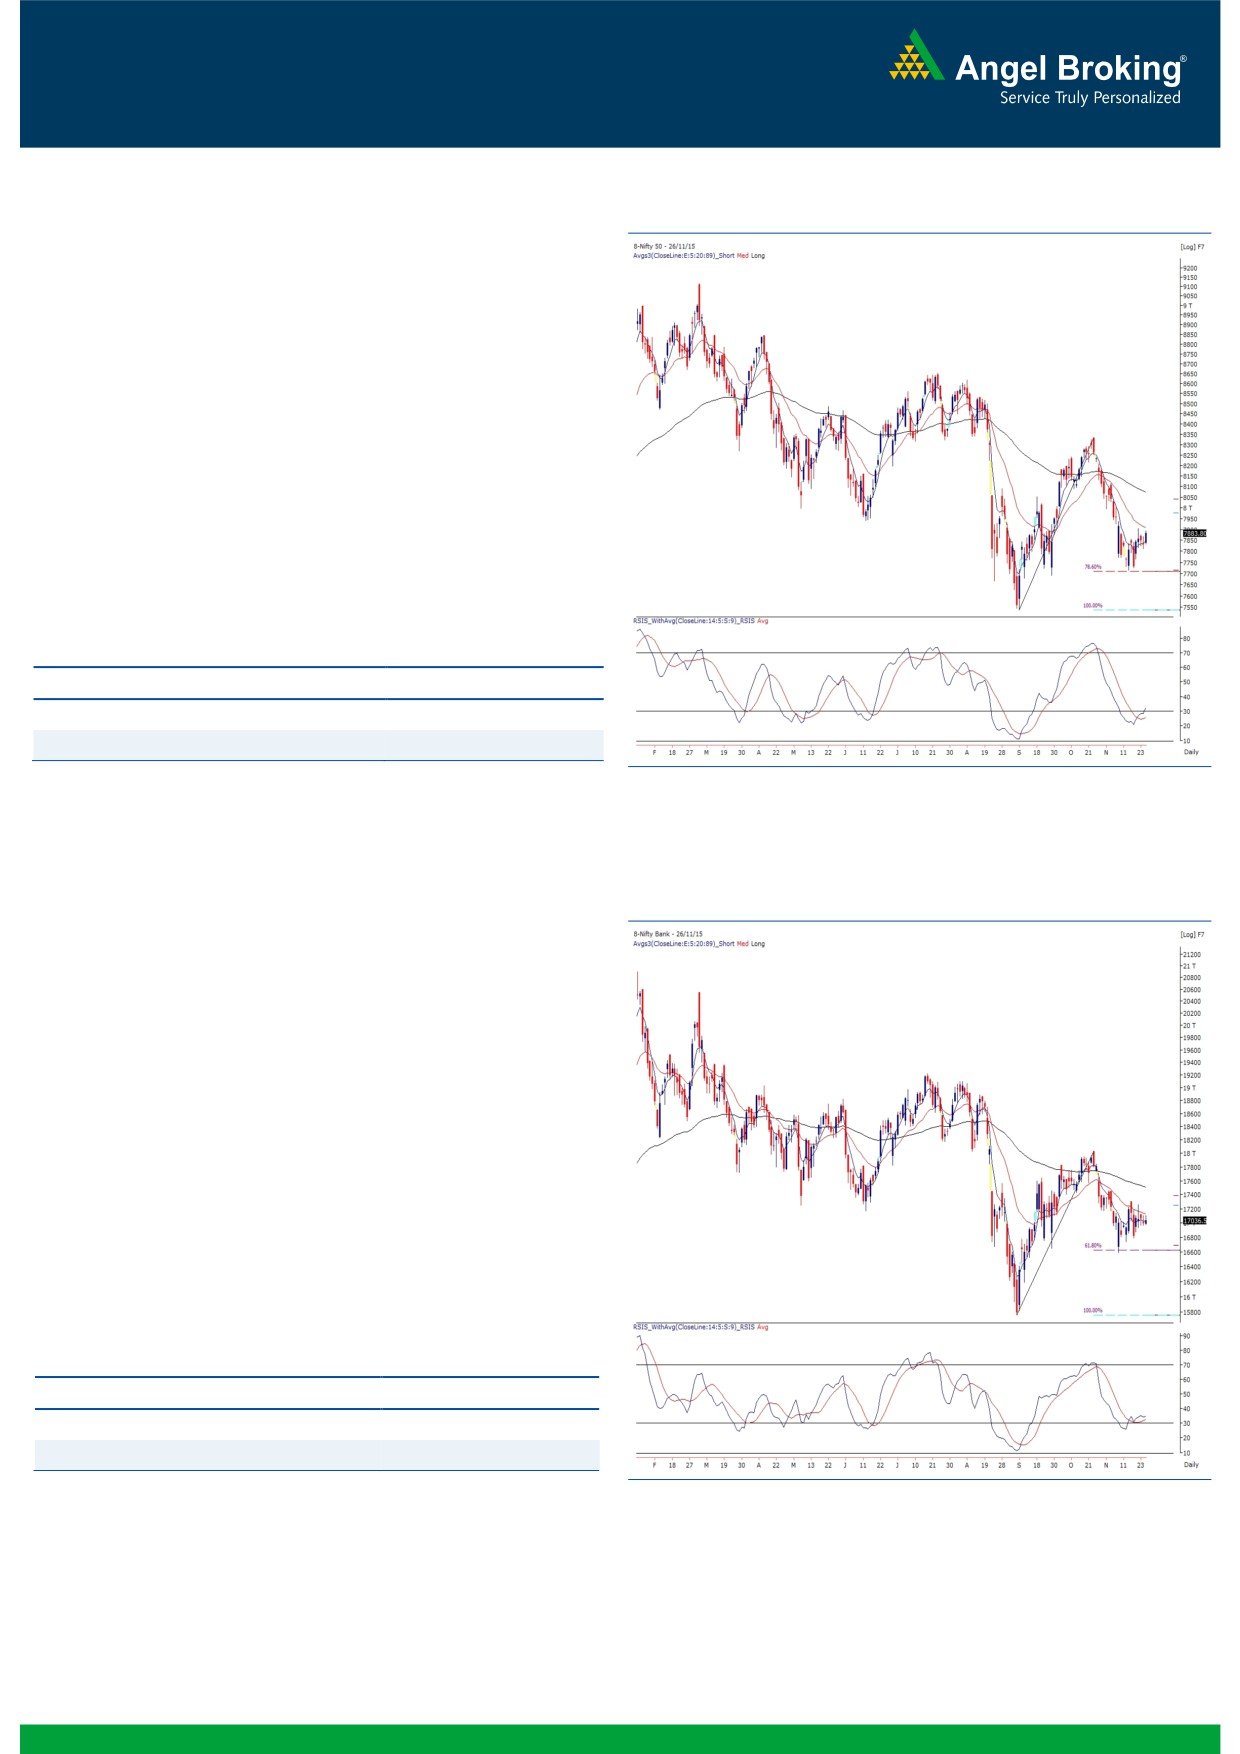
Exhibit 1: Nifty Daily Chart
Yesterday, our markets opened slightly higher tracking
cheerful global cues. The index then extended early morning
lead by a bit to end the session with half a percent gains.
Despite November month derivative expiry session, we did not
witness any volatility in the market. The Nifty has closed tad
below its resistance zone of 7900 - 7920 levels. Going
forward, if the Nifty manages to surpass the 7920 mark then
we may witness an impact of the technical indicator (RSI
Smoothened) to push the Nifty northwards. On the flipside,
7810 - 7700 remains to be strong support levels. Meanwhile,
traders should continue with their stock centric approach with
a proper exit strategy.
Key Levels
Support 1 - 7850
Resistance 1 - 7920
Support 2 - 7810
Resistance 2 - 7980
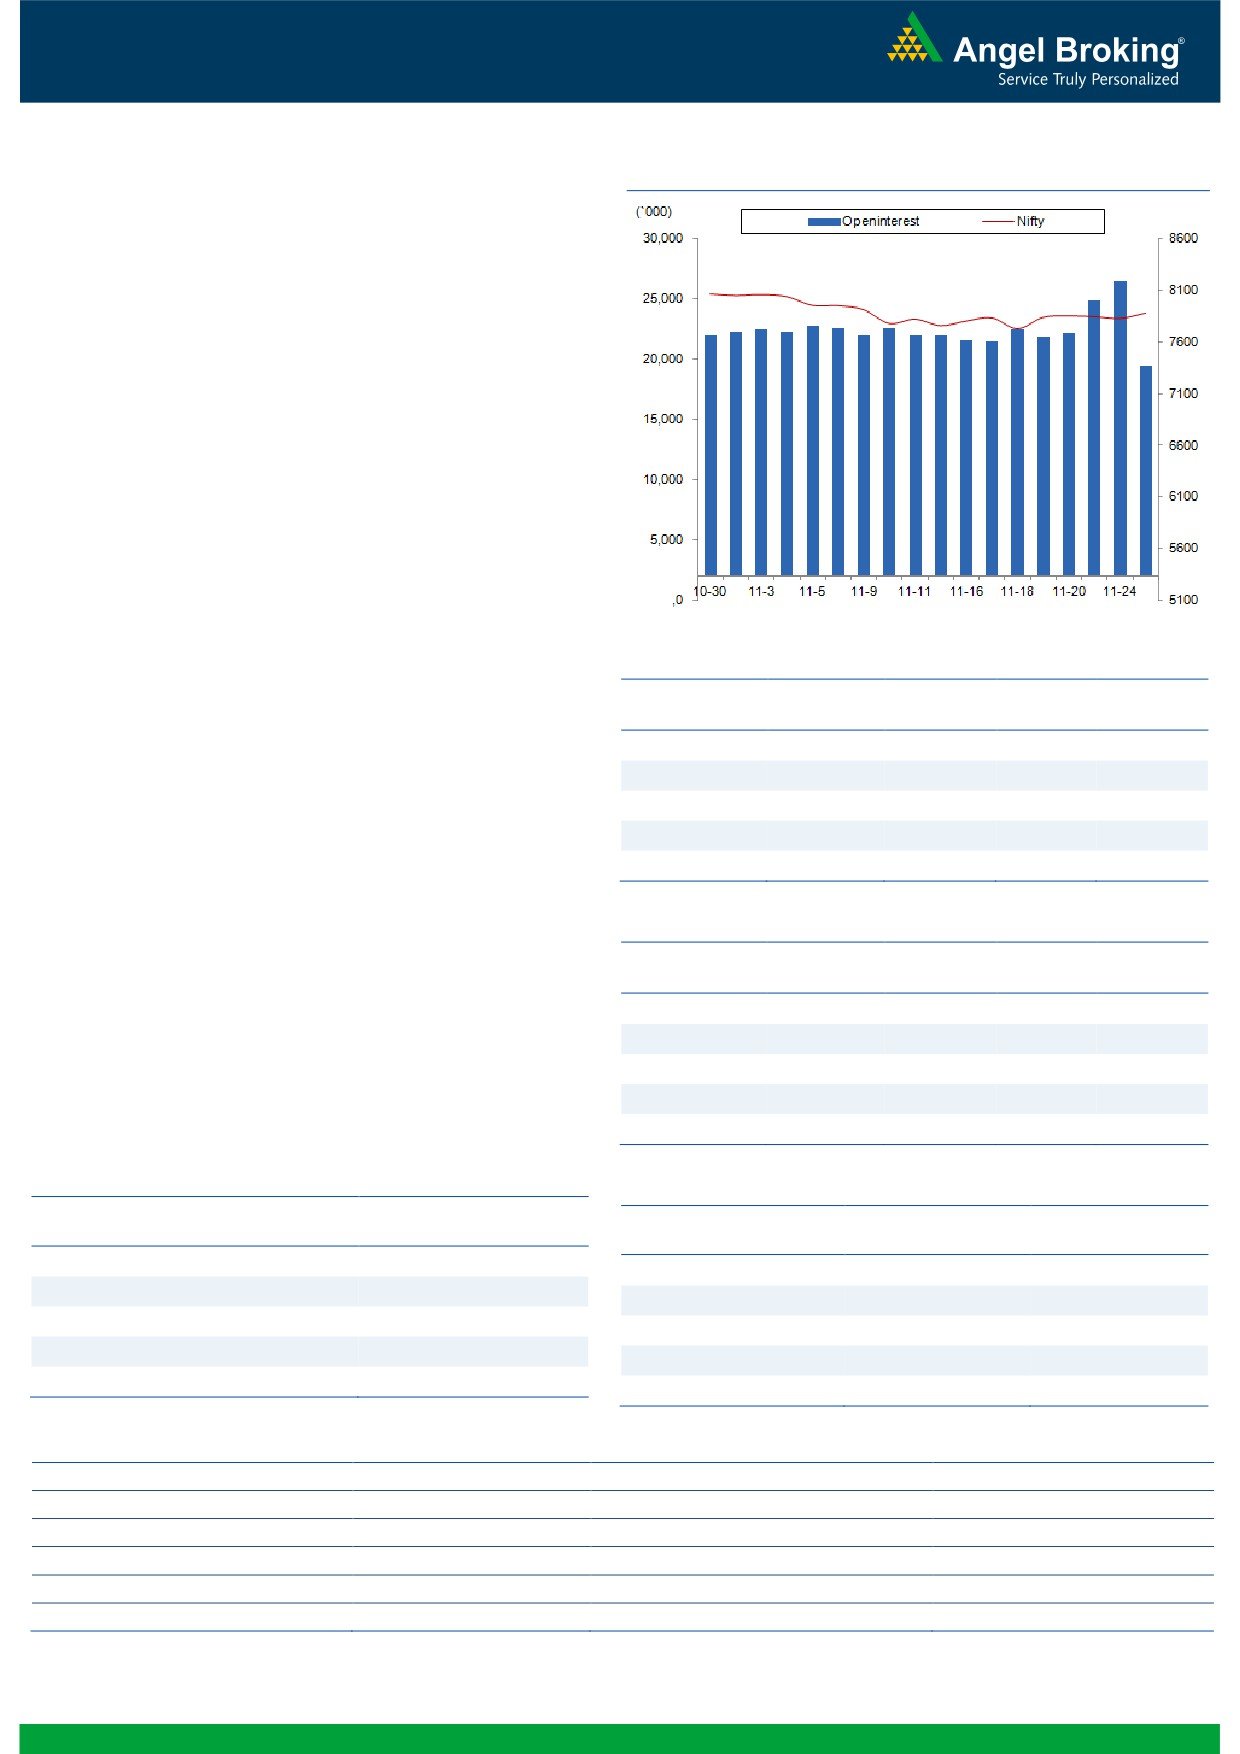
Exhibit 2: Bank Nifty Daily Chart
Bank Nifty Outlook - (17037)
The Nifty Bank index continued to trade in a narrow range
and ended the F&O expiry session on a marginal positive
note. Since last few trading sessions, the index have not shown
any clear directional move on either side and thus breakout
from the range only will led to a directional momentum
picking up. The support zone of the range is placed around
16785 whereas resistance is seen around 17225. Short term
traders are advised to keep a tab on the mentioned levels and
wait for a breakout from the range to initiate directional trade.
The intraday support for the Nifty Bank index is placed around
16950 and 16785 whereas resistances are sen around 17126
and 17225.
Key Levels
Support 1 - 16950
Resistance 1 - 17126
Support 2 - 16785
Resistance 2 - 17225
1
Technical & Derivatives Report
November 27, 2015
Comments
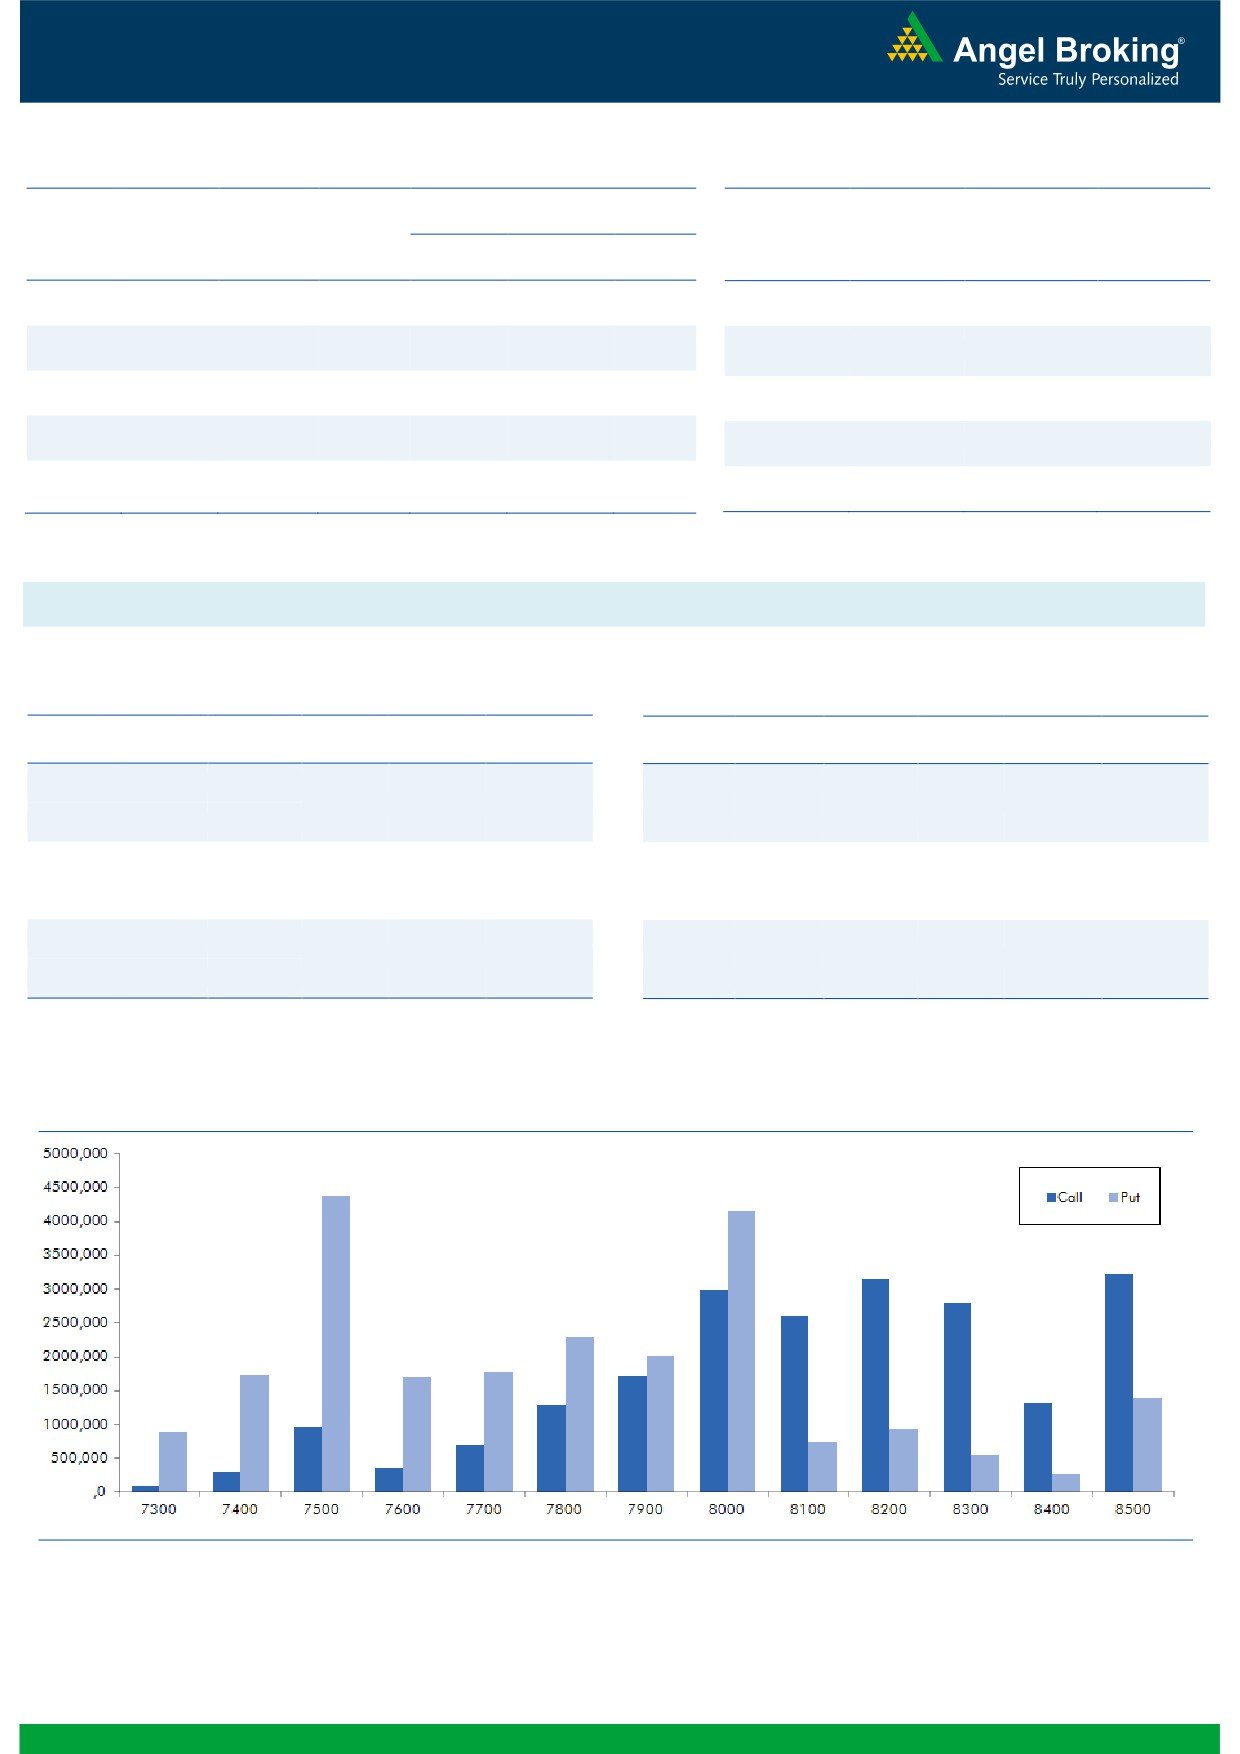
Nifty Vs OI
The Nifty futures open interest has decreased by 26.46%
BankNifty futures open interest has decreased by 28.82%
as market closed at 7883.80 levels.
The Nifty December future closed at a premium of 45.25
points against a premium of 33.15 points. The January
series closed at a premium of 81.55 points.
The Implied Volatility of at the money options has
increased from 13.21% to 15.11%.
The total OI of the market is Rs. 1,63,614/- cr. and the
stock futures OI is Rs. 58,519/- cr.
Few of the liquid counters where we have seen high cost
of carry are UNITECH, NHPC, TV18BRDCST, ADANIENT
and JISLJALEQS.
Views
OI Gainers
OI
PRICE
SCRIP
OI
PRICE
The FIIs continued to sell in cash market segment.
CHG. (%)
CHG. (%)
Yesterday, they sold equities worth Rs. 398 crores. While
CASTROLIND
1994300
17.35
432.05
-1.45
in Index Futures, they sold worth Rs. 307 crores with
significant fall in open interest, which is due to expiry
yesterday.
In Index Options front, FIIs were net buyers of Rs. 1278ng.com
crores with fall in OI. In call options, 8100 and 8300
strikes added some fresh OI. While in put options, 7400
OI Losers
strike was most active. We would suggest avoiding
OI
PRICE
SCRIP
OI
PRICE
forming fresh longs in Nifty; we are hardly seeing any
CHG. (%)
CHG. (%)
buying interest in Nifty.
KSCL
1219500
-40.79
416.40
-1.34
Rollover in NIFTY and BANKNIFTY is on the lower side at
MINDTREE
302800
-37.23
1441.10
-0.75
68.31% and 71.63% respectively.
MARICO
1254500
-36.09
429.80
-0.81
TATAMTRDVR
12602100
-32.84
301.80
2.48
HAVELLS
4492000
-32.59
295.10
1.41
Historical Volatility
Put-Call Ratio
SCRIP
HV
SCRIP
PCR-OI
PCR-VOL
BATAINDIA
53.75
NIFTY
0.83
0.74
RPOWER
51.10
BANKNIFTY
1.15
0.92
IDEA
46.34
DRREDDY
0.63
0.66
DRREDDY
75.67
LT
0.76
0.69
TATAMOTORS
48.43
RELIANCE
0.53
0.44
Strategy Date
Symbol
Strategy
Status
November 02, 2015
RELIANCE
Short Strangle
Profit on expiry
November 09, 2015
ITC
Short Strangle
Did not trigger.
November 16, 2015
TATAMOTORS
Long Put Ladder
Marginal loss on expiry.
November 23, 2015
HEROMOTOCO
Ratio Put Spread
Marginal loss on expiry.
2
Technical & Derivatives Report
November 27, 2015
FII Statistics for 26-November 2015
Turnover on 26-November 2015
Open Interest
No. of
Turnover
Change
Detail
Buy
Sell
Net
Instrument
Value
Change
Contracts
( in Cr. )
(%)
Contracts
(in Cr.)
(%)
INDEX
INDEX
3662.89
3970.13
(307.25)
252300
14671.82
(39.67)
425990
24133.36
12.32
FUTURES
FUTURES
INDEX
INDEX
27563.29
26284.84
1278.45
764793
45001.49
(40.04)
6471453
375925.17
33.44
OPTIONS
OPTIONS
STOCK
13648.49
14393.81
(745.32)
914058
45605.70
(15.59)
STOCK
FUTURES
1541282
77137.84
11.25
FUTURES
STOCK
STOCK
884.03
828.66
55.37
1272
59.83
(98.33)
OPTIONS
417315
21664.06
35.00
OPTIONS
TOTAL
45758.70
45477.44
281.26
1932423
105338.84
(32.26)
TOTAL
8856040
498860.42
28.38
Nifty Spot = 7883.80
Lot Size = 25
Bull-Call Spreads
Bear-Put Spreads
Action
Strike
Price
Risk
Reward
BEP
Action
Strike
Price
Risk
Reward
BEP
Buy
8000
113.70
Buy
7800
96.85
37.85
62.15
8037.85
27.65
72.35
7772.35
Sell
8100
75.85
Sell
7700
69.20
Buy
8000
113.70
Buy
7800
96.85
65.45
134.55
8065.45
48.05
151.95
7751.95
Sell
8200
48.25
Sell
7600
48.80
Buy
8100
75.85
Buy
7700
69.20
27.60
72.40
8127.60
20.40
79.60
7679.60
Sell
8200
48.25
Sell
7600
48.80
Note: Above mentioned Bullish or Bearish Spreads in Nifty (Dec. Series) are given as an information and not as a recommendation.
Nifty Put-Call Analysis
3
Technical & Derivatives Report
November 27, 2015
Daily Pivot Levels for Nifty 50 Stocks
Scrips
S2
S1
PIVOT
R1
R2
ACC
1,316
1,336
1,348
1,368
1,380
ADANIPORTS
264
266
269
271
275
AMBUJACEM
200
201
203
205
206
ASIANPAINT
846
854
860
868
874
AXISBANK
462
464
466
468
470
BAJAJ-AUTO
2,341
2,395
2,459
2,512
2,576
BANKBARODA
165
168
170
172
175
BHARTIARTL
337
340
343
345
348
BHEL
171
172
174
175
177
BOSCHLTD
17,866
18,157
18,403
18,694
18,941
BPCL
893
899
907
913
921
CAIRN
134
136
138
140
142
CIPLA
628
631
637
640
645
COALINDIA
326
331
336
341
346
DRREDDY
3,008
3,055
3,127
3,173
3,246
GAIL
346
357
363
374
381
GRASIM
3,657
3,693
3,717
3,753
3,776
HCLTECH
851
857
863
869
875
HDFC
1,208
1,215
1,224
1,231
1,239
HDFCBANK
1,045
1,054
1,061
1,070
1,077
HEROMOTOCO
2,570
2,629
2,670
2,729
2,770
HINDALCO
73
74
75
76
76
HINDUNILVR
801
807
814
820
827
ICICIBANK
261
262
265
267
269
IDEA
131
139
144
152
158
INDUSINDBK
907
911
918
922
928
INFY
1,031
1,042
1,051
1,061
1,070
ITC
331
337
341
347
351
KOTAKBANK
672
679
683
690
694
LT
1,315
1,324
1,339
1,348
1,363
LUPIN
1,812
1,824
1,844
1,856
1,877
M&M
1,302
1,324
1,339
1,361
1,376
MARUTI
4,533
4,570
4,615
4,652
4,697
NTPC
130
131
132
134
135
ONGC
229
232
235
237
240
PNB
136
138
139
141
142
POWERGRID
130
132
133
135
136
RELIANCE
959
974
983
998
1,007
SBIN
239
241
243
245
247
VEDL
89
90
91
91
92
SUNPHARMA
707
722
731
745
754
TATAMOTORS
396
410
418
433
441
TATAPOWER
66
66
67
67
67
TATASTEEL
222
225
227
231
233
TCS
2,311
2,328
2,355
2,373
2,400
TECHM
517
523
534
540
551
ULTRACEMCO
2,711
2,757
2,786
2,832
2,861
WIPRO
553
561
567
575
581
YESBANK
739
742
748
750
757
ZEEL
391
400
407
416
423
4
Technical & Derivatives Report
November 27, 2015
Research Team Tel: 022 - 39357800
For Technical Queries
For Derivatives Queries
DISCLAIMER
Angel Broking Private Limited (hereinafter referred to as “Angel”) is a registered Member of National Stock Exchange of India Limited,
Bombay Stock Exchange Limited and MCX Stock Exchange Limited. It is also registered as a Depository Participant with CDSL and
Portfolio Manager with SEBI. It also has registration with AMFI as a Mutual Fund Distributor. Angel Broking Private Limited is a
registered entity with SEBI for Research Analyst in terms of SEBI (Research Analyst) Regulations, 2014 vide registration number
INH000000164. Angel or its associates has not been debarred/ suspended by SEBI or any other regulatory authority for accessing
/dealing in securities Market. Angel or its associates including its relatives/analyst do not hold any financial interest/beneficial
ownership of more than 1% in the company covered by Analyst. Angel or its associates/analyst has not received any compensation /
managed or co-managed public offering of securities of the company covered by Analyst during the past twelve months. Angel/analyst
has not served as an officer, director or employee of company covered by Analyst and has not been engaged in market making activity
of the company covered by Analyst.
This document is solely for the personal information of the recipient, and must not be singularly used as the basis of any investment
decision. Nothing in this document should be construed as investment or financial advice. Each recipient of this document should
make such investigations as they deem necessary to arrive at an independent evaluation of an investment in the securities of the
companies referred to in this document (including the merits and risks involved), and should consult their own advisors to determine
the merits and risks of such an investment.
Reports based on technical and derivative analysis center on studying charts of a stock's price movement, outstanding positions and
trading volume, as opposed to focusing on a company's fundamentals and, as such, may not match with a report on a company's
fundamentals.
The information in this document has been printed on the basis of publicly available information, internal data and other reliable
sources believed to be true, but we do not represent that it is accurate or complete and it should not be relied on as such, as this
document is for general guidance only. Angel Broking Pvt. Limited or any of its affiliates/ group companies shall not be in any way
responsible for any loss or damage that may arise to any person from any inadvertent error in the information contained in this report.
Angel Broking Pvt. Limited has not independently verified all the information contained within this document. Accordingly, we cannot
testify, nor make any representation or warranty, express or implied, to the accuracy, contents or data contained within this document.
While Angel Broking Pvt. Limited endeavors to update on a reasonable basis the information discussed in this material, there may be
regulatory, compliance, or other reasons that prevent us from doing so.
This document is being supplied to you solely for your information, and its contents, information or data may not be reproduced,
redistributed or passed on, directly or indirectly.
Neither Angel Broking Pvt. Limited, nor its directors, employees or affiliates shall be liable for any loss or damage that may arise from
or in connection with the use of this information.
Note: Please refer to the important ‘Stock Holding Disclosure' report on the Angel website (Research Section). Also, please refer to the
latest update on respective stocks for the disclosure status in respect of those stocks. Angel Broking Pvt. Limited and its affiliates may
have investment positions in the stocks recommended in this report.
5