Technical & Derivatives Report
September 27, 2016
Sensex (28294) / Nifty (8723)
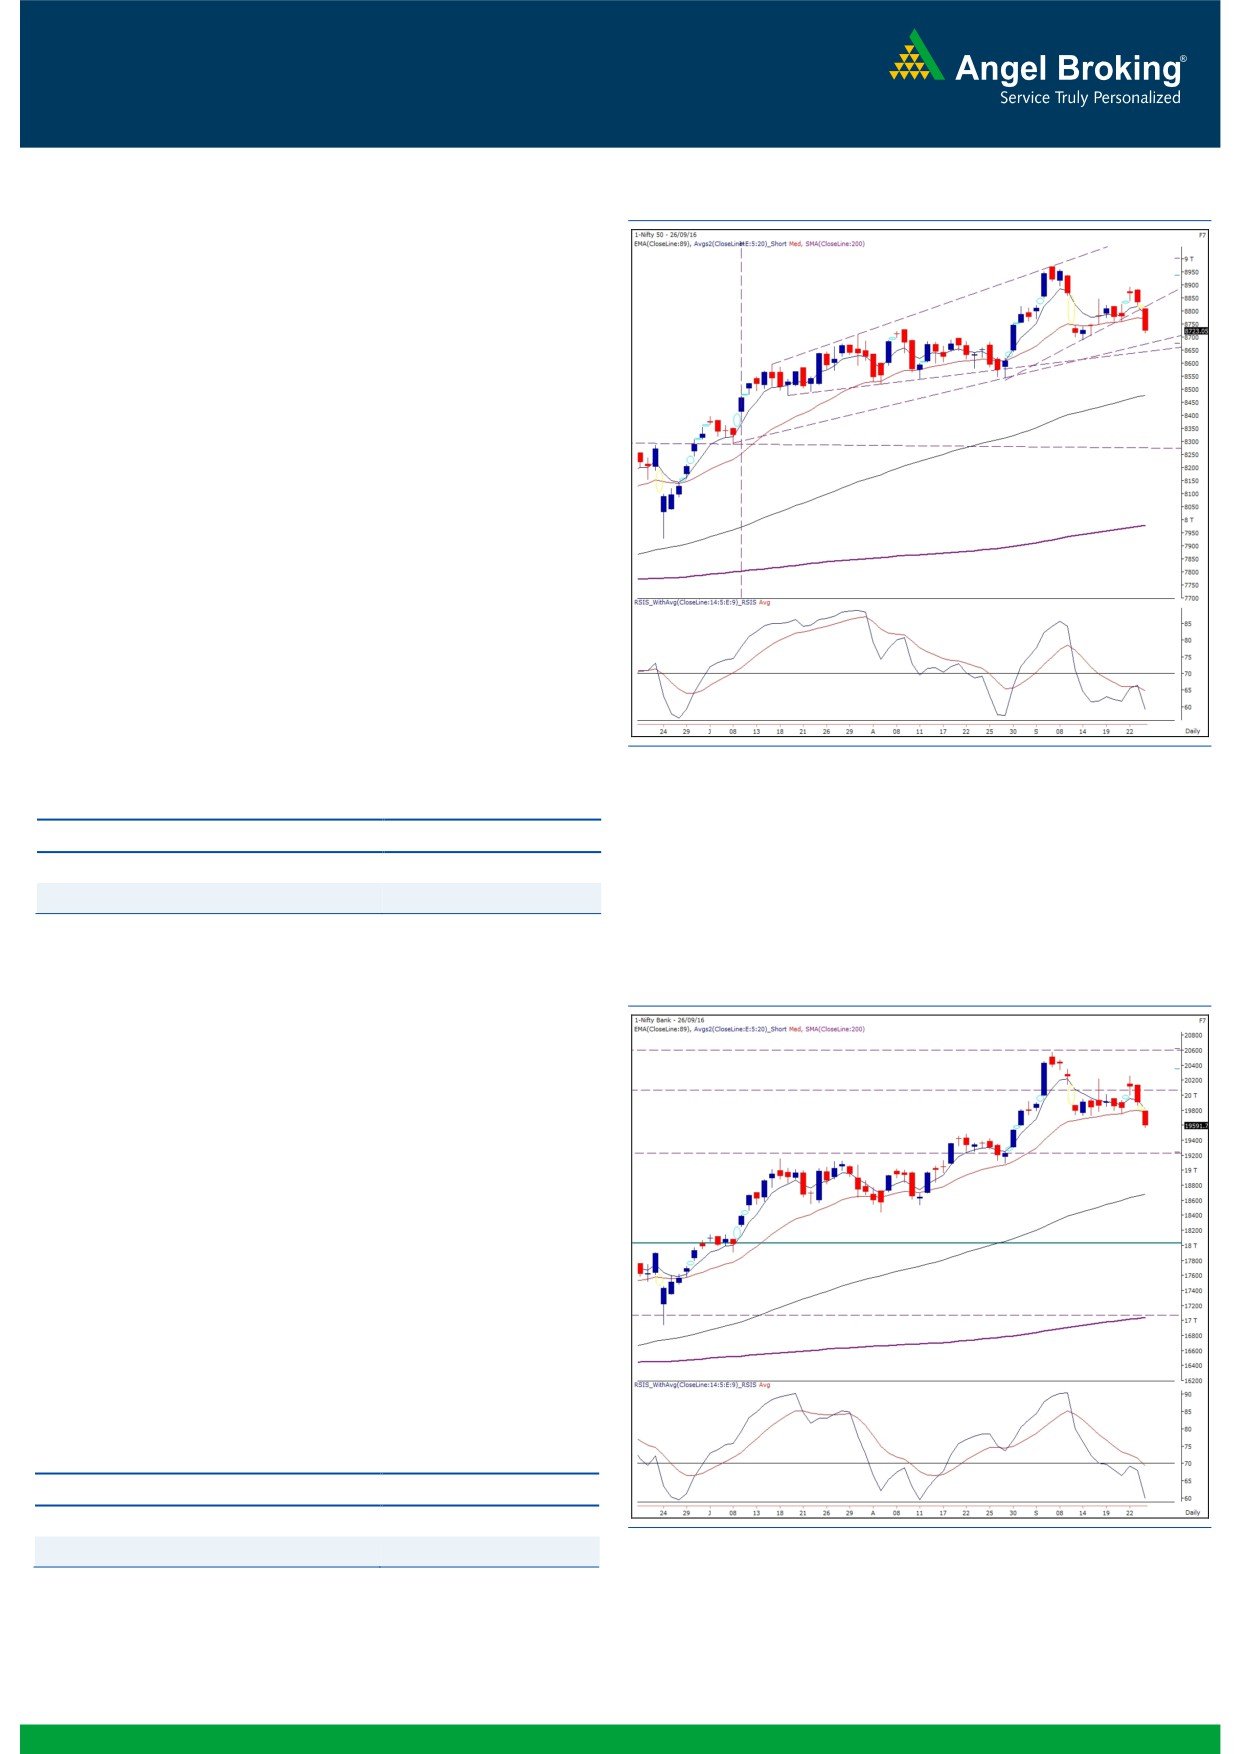
Exhibit 1: Nifty Daily Chart
The beginning of the new trading week was very much on our
expected lines as the Nifty opened lower with a decent downside
gap and there by confirms a yet another bearish development on
chart. In technical terms it can be known as a breakdown from
the 'Upward Sloping Trend Line' with a 'Breakaway Gap'. The
momentum on downside accelerated as the day progressed and
eventually the Nifty went on to close tad above the 8700 mark by
posting nearly 1.50% cut.
Yesterday's move justified our bearish stance on the market which
seemed contradictory after opening higher last Thursday post the
Fed policy. At times, we need to take such contradictory actions,
provided you have an appropriate justification on the same. Now,
its a matter of time that the Nifty would slide below the recent
support level of 8688 to test 8640 - 8600 levels. In fact, we will
not be surprised even if the index slips further; but as of now, for
the coming session, above mentioned levels are quite likely. On
the upside, 8750 - 8790 would be seen as strong resistance
levels.
Key Levels
Support 1 - 8688
Resistance 1 - 8750
Support 2 - 8640
Resistance 2 - 8790
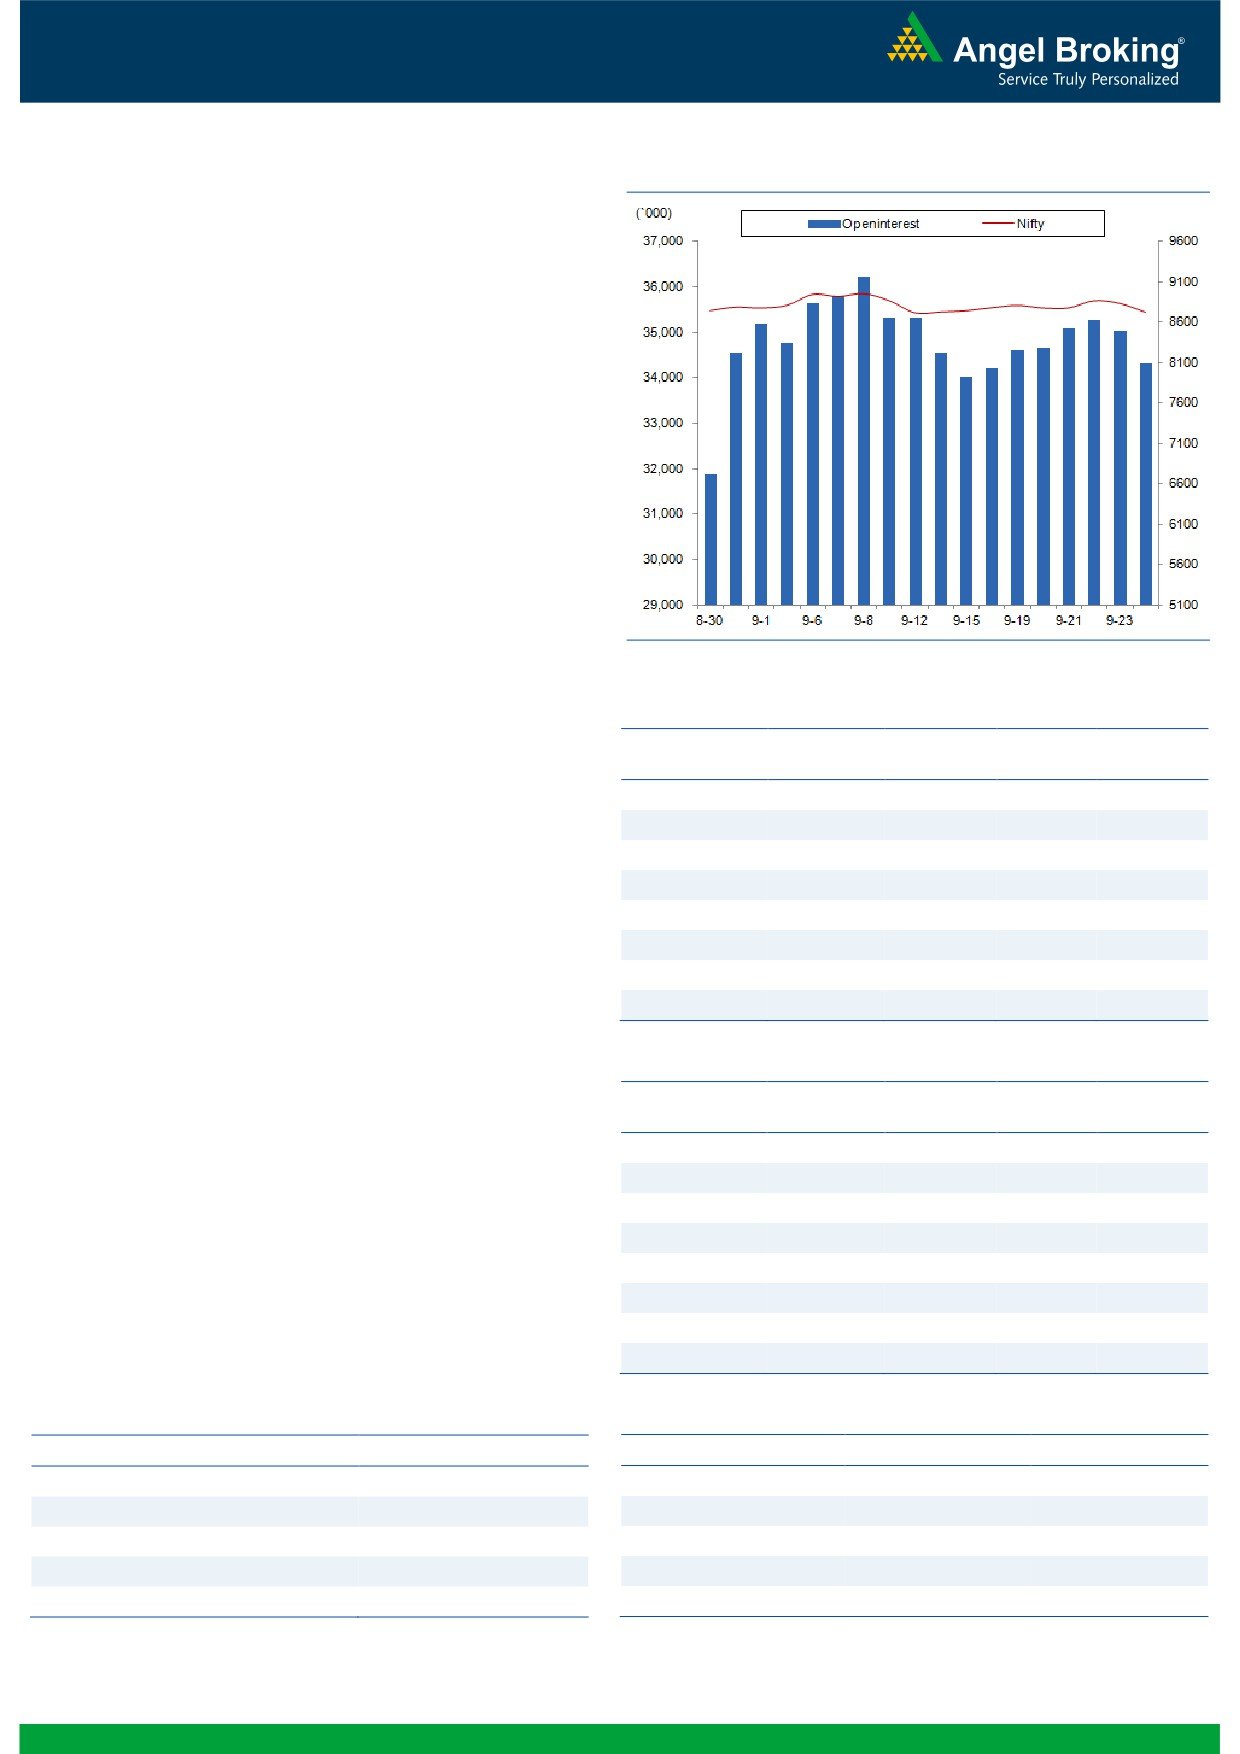
Exhibit 2: Nifty Bank Daily Chart
Nifty Bank Outlook - (19592)
The Nifty Bank index too started the week with a gap down
opening and remained under pressure throughout the session.
The index ended with losses of 1.56 percent over its previous
session's close.
Since last few day's we have been highlighting about the higher
probability of a corrective move in the index in near term. Thus,
yesterday's move was quite on our expected lines as the index
resumed the next leg of corrective move. Although this corrective
move is a part of the broader uptrend in the index, short term
traders can continue with the cautious stance as there is more
room for the correction in near term. The intraday support for the
index is placed around 19410 whereas resistances are seen
around 19725 and 19885.
Key Levels
Support 1 - 19410
Resistance 1 - 19725
Support 2 - 19300
Resistance 2 - 19885
1
Technical & Derivatives Report
September 27, 2016
Comments
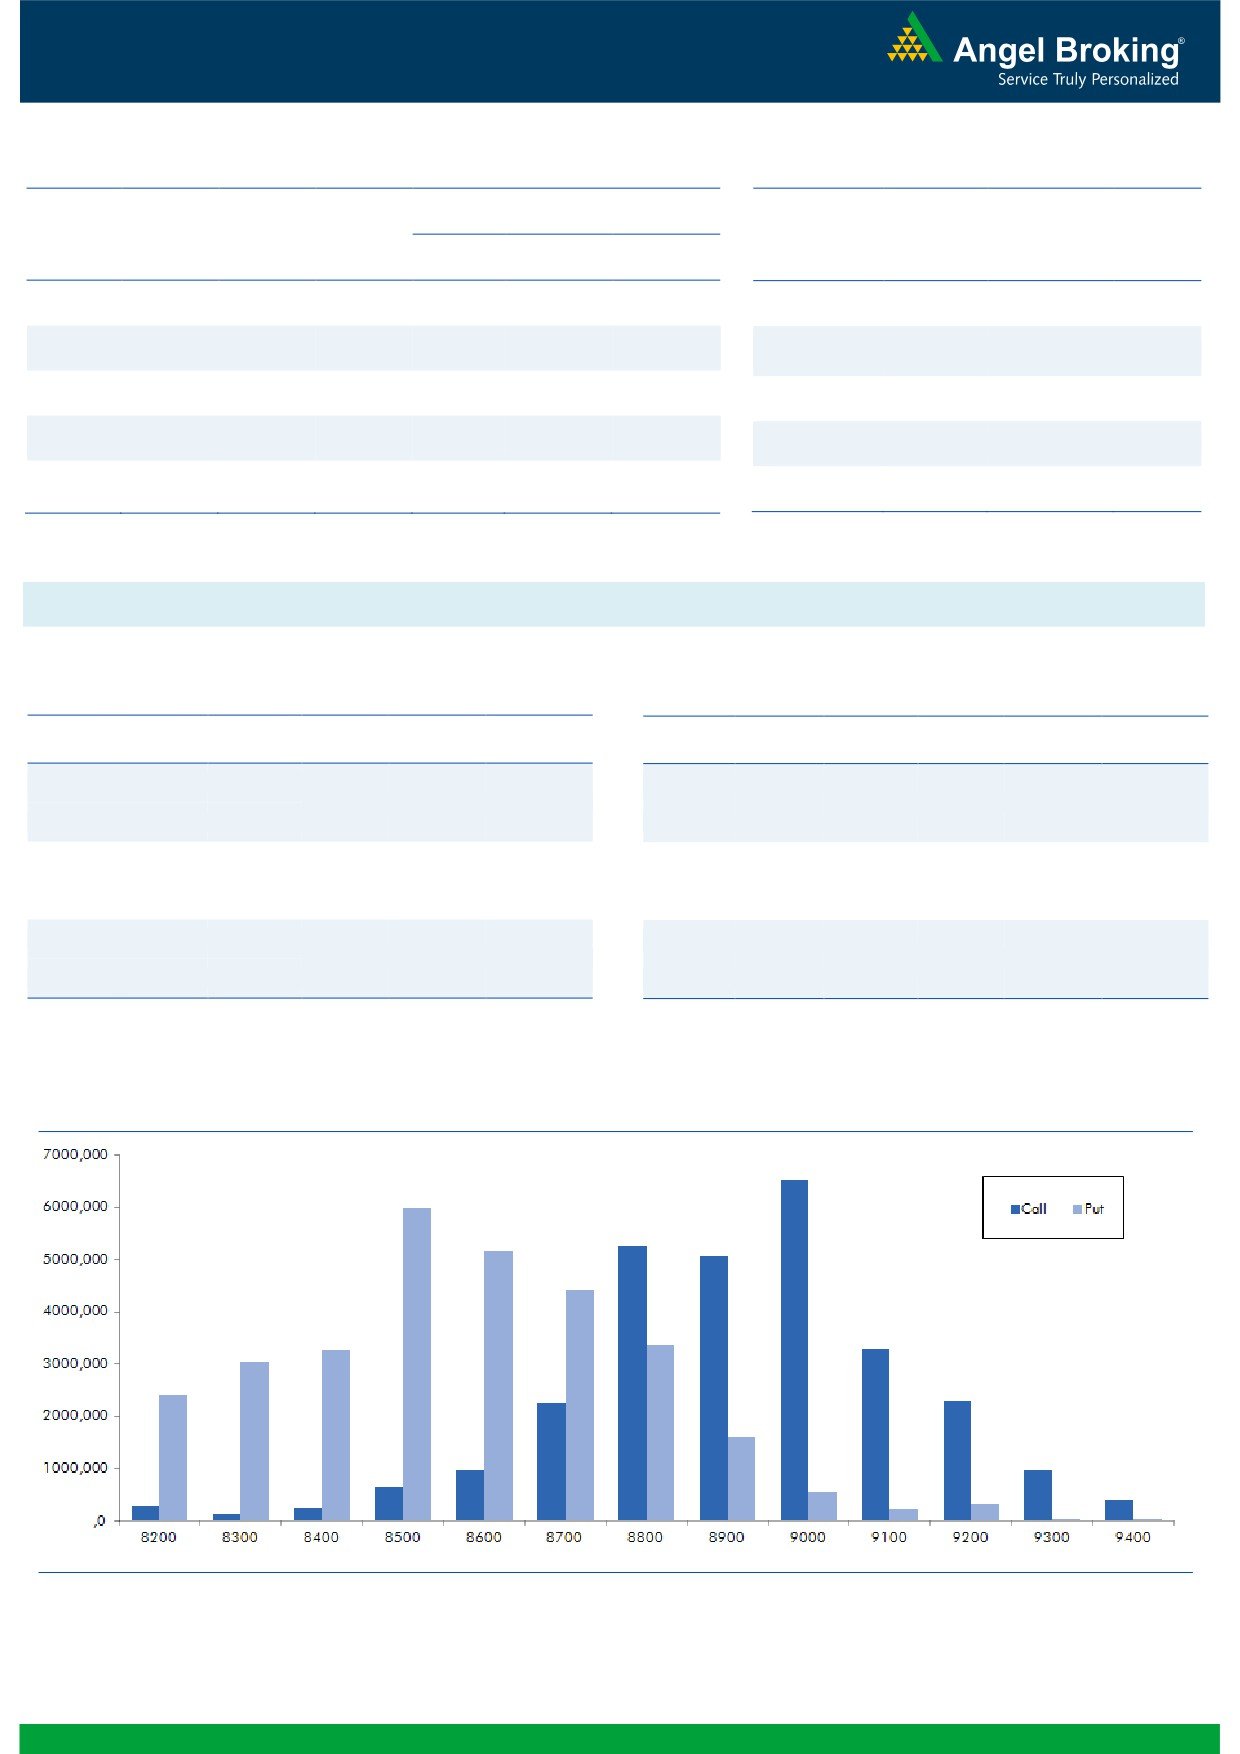
Nifty Vs OI
The Nifty futures open interest has decreased by 2.03%
BankNifty futures open interest has decreased by 0.55%
as market closed at 8723.05 levels.
The Nifty September future closed with a premium of
12.10 points, which is the same in previous session too.
The October series closed at a premium of 58.65 points.
The Implied Volatility of at the money options has
increased from 11.17% to 14.94%. At the same time, the
PCR-OI of Nifty has decreased from 1.15 to 1.07.
The total OI of the market is Rs. 3,22,157/- cr. and the
stock futures OI is Rs. 89,601/- cr.
Few of the liquid counters where we have seen high cost
of carry are JPASSOCIAT, CAIRN, GMRINFRA,
BHARATFORG and TATAMOTORS.
Views
OI Gainers
Yesterday, FIIs were net sellers in both cash segment
OI
PRICE
SCRIP
OI
PRICE
segment and in Index Futures. They sold equities worth
CHG. (%)
CHG. (%)
Rs. 206 crores. While, they were net sellers in a big way
NHPC
30240000
18.77
25.45
-2.49
of Rs. 1121 crores in index futures with decent fall in OI,
UNIONBANK
17500000
13.87
141.65
-2.55
indicating good amount of long unwinding in last trading
JUBLFOOD
3185500
12.82
960.00
-3.47
www.angelbroking.com
session.
CENTURYTEX
7357900
12.78
928.50
2.15
On Index Options front, FIIs bought to the tune of
TITAN
9600000
12.50
404.95
-1.27
Rs. 241 crores with rise in OI. Surprisingly, despite Nifty
GAIL
11292000
11.18
377.85
-2.40
being under pressure 8750 and 8800 call options added
RELINFRA
14072500
10.10
596.35
-2.25
significant build-up and these are retail client’s positions
MOTHERSUMI
14590000
9.74
315.90
-1.08
who are expecting Nifty to bounce in last few days of
September series. On the other hand, in put options,
OI Losers
8650 strike added long positions, followed by good
OI
PRICE
SCRIP
OI
PRICE
amount of unwinding in 8800 and 8900 put options.
CHG. (%)
CHG. (%)
Highest OI in September series is placed at 9000 call
BEL
2096100
-12.36
1267.10
1.40
and 8500 put option.
CEATLTD
1727600
-12.14
1184.80
0.39
Yesterday, we saw profit booking by FIIs in their Index
IGL
1851300
-8.03
772.40
1.16
Futures longs and the quantum was also huge. We
BHARATFIN
7775000
-7.40
851.65
0.60
believe, Nifty may continue to remain under pressure
DLF
44160000
-7.25
153.15
-2.02
and September Series may expire near 8600 - 8650
HINDPETRO
26703600
-7.09
429.85
2.64
levels. Hence, traders can buy 8750 put option of current
HINDZINC
4739200
-7.09
229.55
0.97
expiry.
IDBI
45640000
-6.98
71.75
-2.51
Historical Volatility
Put-Call Ratio
SCRIP
HV
SCRIP
PCR-OI
PCR-VOL
ONGC
32.40
NIFTY
1.07
0.98
NTPC
30.59
BANKNIFTY
0.97
0.79
GAIL
24.62
RELIANCE
0.78
0.53
M&M
21.96
AXISBANK
0.35
0.46
ICICIBANK
34.11
YESBANK
0.63
0.72
2
Technical & Derivatives Report
September 27, 2016
FII Statistics for 26, September 2016
Turnover on 26, September 2016
Open Interest
No. of
Turnover
Change
Detail
Buy
Sell
Net
Instrument
Value
Contracts
( in Cr. )
(%)
Contracts
Change (%)
(in Cr.)
INDEX
INDEX
7792.22
8913.08
(1120.86)
453306
30314.68
(5.52)
401244
27603.54
112.45
FUTURES
FUTURES
INDEX
INDEX
46353.42
46112.40
241.01
1413500
94809.19
2.37
5030712
353243.58
51.66
OPTIONS
OPTIONS
STOCK
19091.82
19778.35
(686.54)
967288
63957.17
3.01
STOCK
FUTURES
1034143
71116.67
31.98
FUTURES
STOCK
STOCK
6527.45
6733.81
(206.37)
125417
8719.60
1.62
OPTIONS
469708
33267.24
-10.51
OPTIONS
TOTAL
79764.89
81537.65
(1772.76)
2959511
197800.65
1.25
TOTAL
6935807
485231.04
44.00
Nifty Spot = 8723.05
Lot Size = 75
Bull-Call Spreads
Bear-Put Spreads
Action
Strike
Price
Risk
Reward
BEP
Action
Strike
Price
Risk
Reward
BEP
Buy
8700
66.50
Buy
8800
84.40
45.20
54.80
8745.20
51.35
48.65
8748.65
Sell
8800
21.30
Sell
8700
33.05
Buy
8700
66.50
Buy
8800
84.40
61.55
138.45
8761.55
72.50
127.50
8727.50
Sell
8900
4.95
Sell
8600
11.90
Buy
8800
21.30
Buy
8700
33.05
16.35
83.65
8816.35
21.15
78.85
8678.85
Sell
8900
4.95
Sell
8600
11.90
Note: Above mentioned Bullish or Bearish Spreads in Nifty (September Series) are given as an information and not as a recommendation.
Nifty Put-Call Analysis
3
Technical & Derivatives Report
September 27, 2016
Daily Pivot Levels for Nifty Constituents
Scrips
S2
S1
PIVOT
R1
R2
ACC
1,583
1,597
1,608
1,622
1,633
ADANIPORTS
266
268
271
274
277
AMBUJACEM
251
253
255
257
260
ASIANPAINT
1,164
1,174
1,184
1,194
1,204
AUROPHARMA
827
833
841
847
855
AXISBANK
536
542
551
557
566
BAJAJ-AUTO
2,846
2,869
2,901
2,924
2,956
BANKBARODA
163
165
167
169
171
BHEL
140
141
144
146
148
BPCL
585
604
614
633
644
BHARTIARTL
313
317
323
326
332
INFRATEL
359
362
367
370
374
BOSCH
22,354
22,599
22,966
23,212
23,579
CIPLA
596
600
608
612
620
COALINDIA
326
329
332
335
338
DRREDDY
3,135
3,167
3,194
3,226
3,253
EICHERMOT
24,375
24,534
24,765
24,924
25,155
GAIL
368
372
380
384
392
GRASIM
4,764
4,805
4,872
4,912
4,979
HCLTECH
779
784
791
795
802
HDFCBANK
1,284
1,290
1,300
1,305
1,315
HDFC
1,392
1,402
1,413
1,423
1,434
HEROMOTOCO
3,400
3,433
3,483
3,516
3,566
HINDALCO
151
152
154
155
157
HINDUNILVR
870
881
898
909
925
ICICIBANK
257
260
264
267
271
IDEA
78
79
81
82
83
INDUSINDBK
1,186
1,194
1,204
1,212
1,222
INFY
1,024
1,030
1,037
1,043
1,050
ITC
244
246
250
252
255
KOTAKBANK
779
783
789
793
799
LT
1,429
1,448
1,480
1,498
1,530
LUPIN
1,450
1,472
1,488
1,510
1,525
M&M
1,355
1,367
1,389
1,402
1,423
MARUTI
5,514
5,541
5,583
5,611
5,653
NTPC
148
150
153
155
159
ONGC
240
245
253
257
265
POWERGRID
173
174
176
178
180
RELIANCE
1,083
1,095
1,112
1,124
1,142
SBIN
248
250
252
254
256
SUNPHARMA
752
759
772
779
791
TCS
2,381
2,391
2,405
2,415
2,429
TATAMTRDVR
335
338
344
348
354
TATAMOTORS
523
529
540
546
556
TATAPOWER
75
75
76
77
77
TATASTEEL
363
367
372
375
380
TECHM
442
445
450
453
458
ULTRACEMCO
3,876
3,900
3,929
3,952
3,981
WIPRO
474
477
479
482
484
YESBANK
1,205
1,220
1,232
1,247
1,258
ZEEL
520
525
529
534
538
4
Technical & Derivatives Report
September 27, 2016
Research Team Tel: 022 - 39357800
For Technical Queries
For Derivatives Queries
DISCLAIMER
Angel Broking Private Limited (hereinafter referred to as “Angel”) is a registered Member of National Stock Exchange of India Limited,
Bombay Stock Exchange Limited and Metropolitan Stock Exchange Limited. It is also registered as a Depository Participant with CDSL
and Portfolio Manager with SEBI. It also has registration with AMFI as a Mutual Fund Distributor. Angel Broking Private Limited is a
registered entity with SEBI for Research Analyst in terms of SEBI (Research Analyst) Regulations, 2014 vide registration number
INH000000164. Angel or its associates has not been debarred/ suspended by SEBI or any other regulatory authority for accessing
/dealing in securities Market. Angel or its associates/analyst has not received any compensation / managed or co-managed public
offering of securities of the company covered by Analyst during the past twelve months.
This document is solely for the personal information of the recipient, and must not be singularly used as the basis of any investment
decision. Nothing in this document should be construed as investment or financial advice. Each recipient of this document should
make such investigations as they deem necessary to arrive at an independent evaluation of an investment in the securities of the
companies referred to in this document (including the merits and risks involved), and should consult their own advisors to determine
the merits and risks of such an investment.
Reports based on technical and derivative analysis center on studying charts of a stock's price movement, outstanding positions and
trading volume, as opposed to focusing on a company's fundamentals and, as such, may not match with a report on a company's
fundamentals. Investors are advised to refer the Fundamental and Technical Research Reports available on our website to evaluate the
contrary view, if any.
The information in this document has been printed on the basis of publicly available information, internal data and other reliable
sources believed to be true, but we do not represent that it is accurate or complete and it should not be relied on as such, as this
document is for general guidance only. Angel Broking Pvt. Limited or any of its affiliates/ group companies shall not be in any way
responsible for any loss or damage that may arise to any person from any inadvertent error in the information contained in this report.
Angel Broking Pvt. Limited has not independently verified all the information contained within this document. Accordingly, we cannot
testify, nor make any representation or warranty, express or implied, to the accuracy, contents or data contained within this document.
While Angel Broking Pvt. Limited endeavors to update on a reasonable basis the information discussed in this material, there may be
regulatory, compliance, or other reasons that prevent us from doing so.
This document is being supplied to you solely for your information, and its contents, information or data may not be reproduced,
redistributed or passed on, directly or indirectly.
Neither Angel Broking Pvt. Limited, nor its directors, employees or affiliates shall be liable for any loss or damage that may arise from
or in connection with the use of this information.
5