Technical & Derivatives Report
June 27, 2016
Sensex (26398) / Nifty (8089)
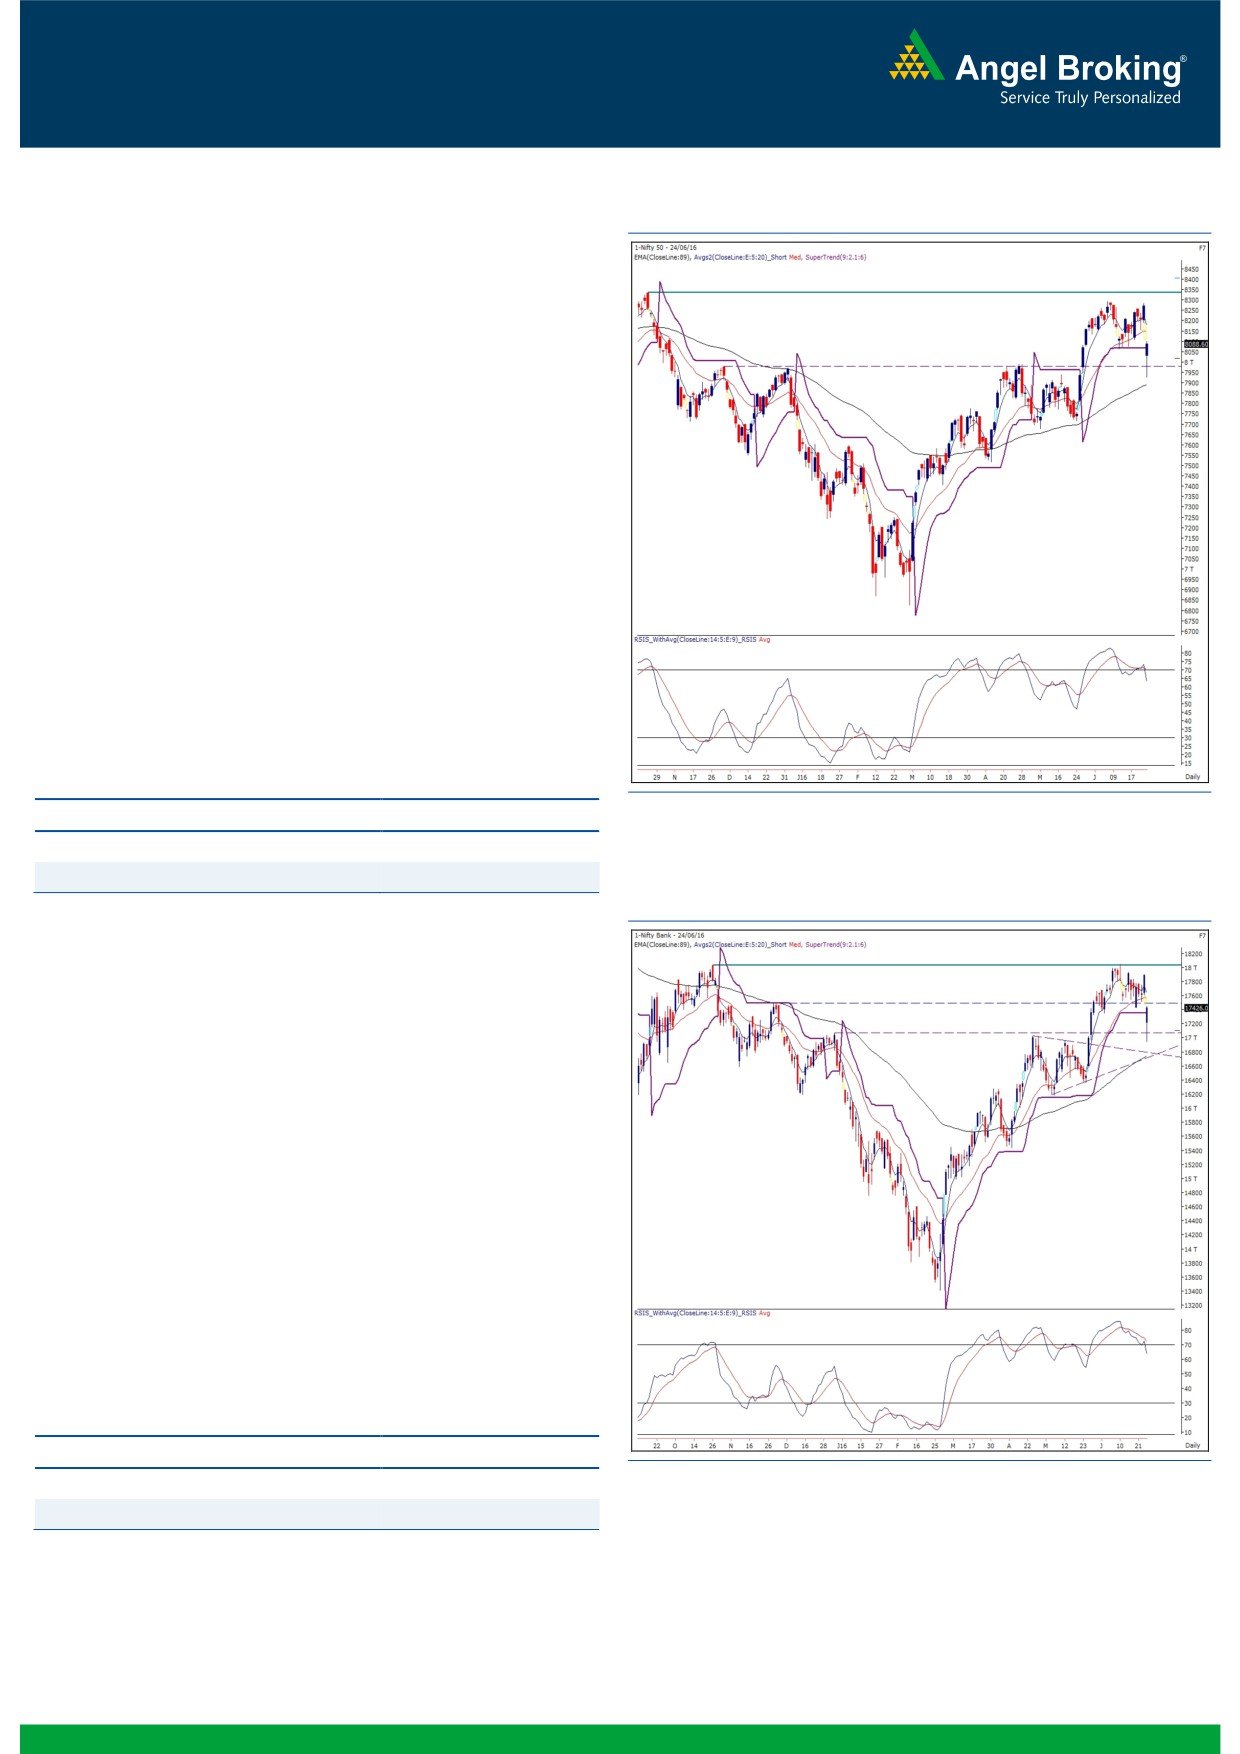
Exhibit 1: Nifty Hourly Chart
The much awaited verdict on ‘BREXIT’ is out and it’s been an
unfavourable one from a global economic perspective; equity
markets across the globe reacted accordingly by undergoing
sharp corrections. The Nifty was no exception either to the
broader sell off and as a kneejerk reaction it breached the
important support level of 8000 in intraday. However, the index
recovered some of the losses and ended Friday’s session with loss
of 2.20% over its previous day’s close. We have been observing a
strong support of the ‘Super Trend’ indicator on the daily chart
placed around 8080 - 8060. This is followed by a major support
at 7900, which is the daily ’89 EMA’ and hence it can be
expected to play the role of a sheet anchor in the near term. We
maintain our positive stance on the market and continue to advise
towards using dips as a buying opportunity as long as the Nifty
manages to hold the 7900 mark on a closing basis. Traders are
advised to trade with a proper exit strategy as the volatility seems
to have increased across global markets. On the higher side,
immediate resistance is seen at 8188 - 8295 levels.
Key Levels
Support 1 - 8060
Resistance 1 - 8188
Support 2 - 7900
Resistance 2 - 8295
Exhibit 2: Nifty Bank Daily Chart
Nifty Bank Outlook - (17426)
Due to an initial cues of poll results in favour of ‘Brexit’ from EU,
the Nifty Bank index opened with deep cut of more than 650
points on Friday. Post the gap down opening, the banking index
continued to fall and breached its crucial support of 17000 mark.
However, due to strident rally of more than 500 points from
intraday low in the later half, the Nifty Bank index ended with the
loss of 2.61 percent over its previous close.
On Friday, the banking index has taken support around the
previous breakout levels and shown tremendous recovery from
lower levels. If Nifty Bank index managed to hold Friday’s low of
16946, then we may see further bounce back in the index.
Meanwhile, stock specific action to continue and traders should
focus more on the same. Going forward, intraday supports for
the index are placed around 17213 and 16946; whereas,
resistances are seen around 17611 and 17780.
Key Levels
Support 1 - 17530
Resistance 1 - 18050
Support 2 - 17350
Resistance 2 - 18220
1
Technical & Derivatives Report
June 27, 2016
Comments
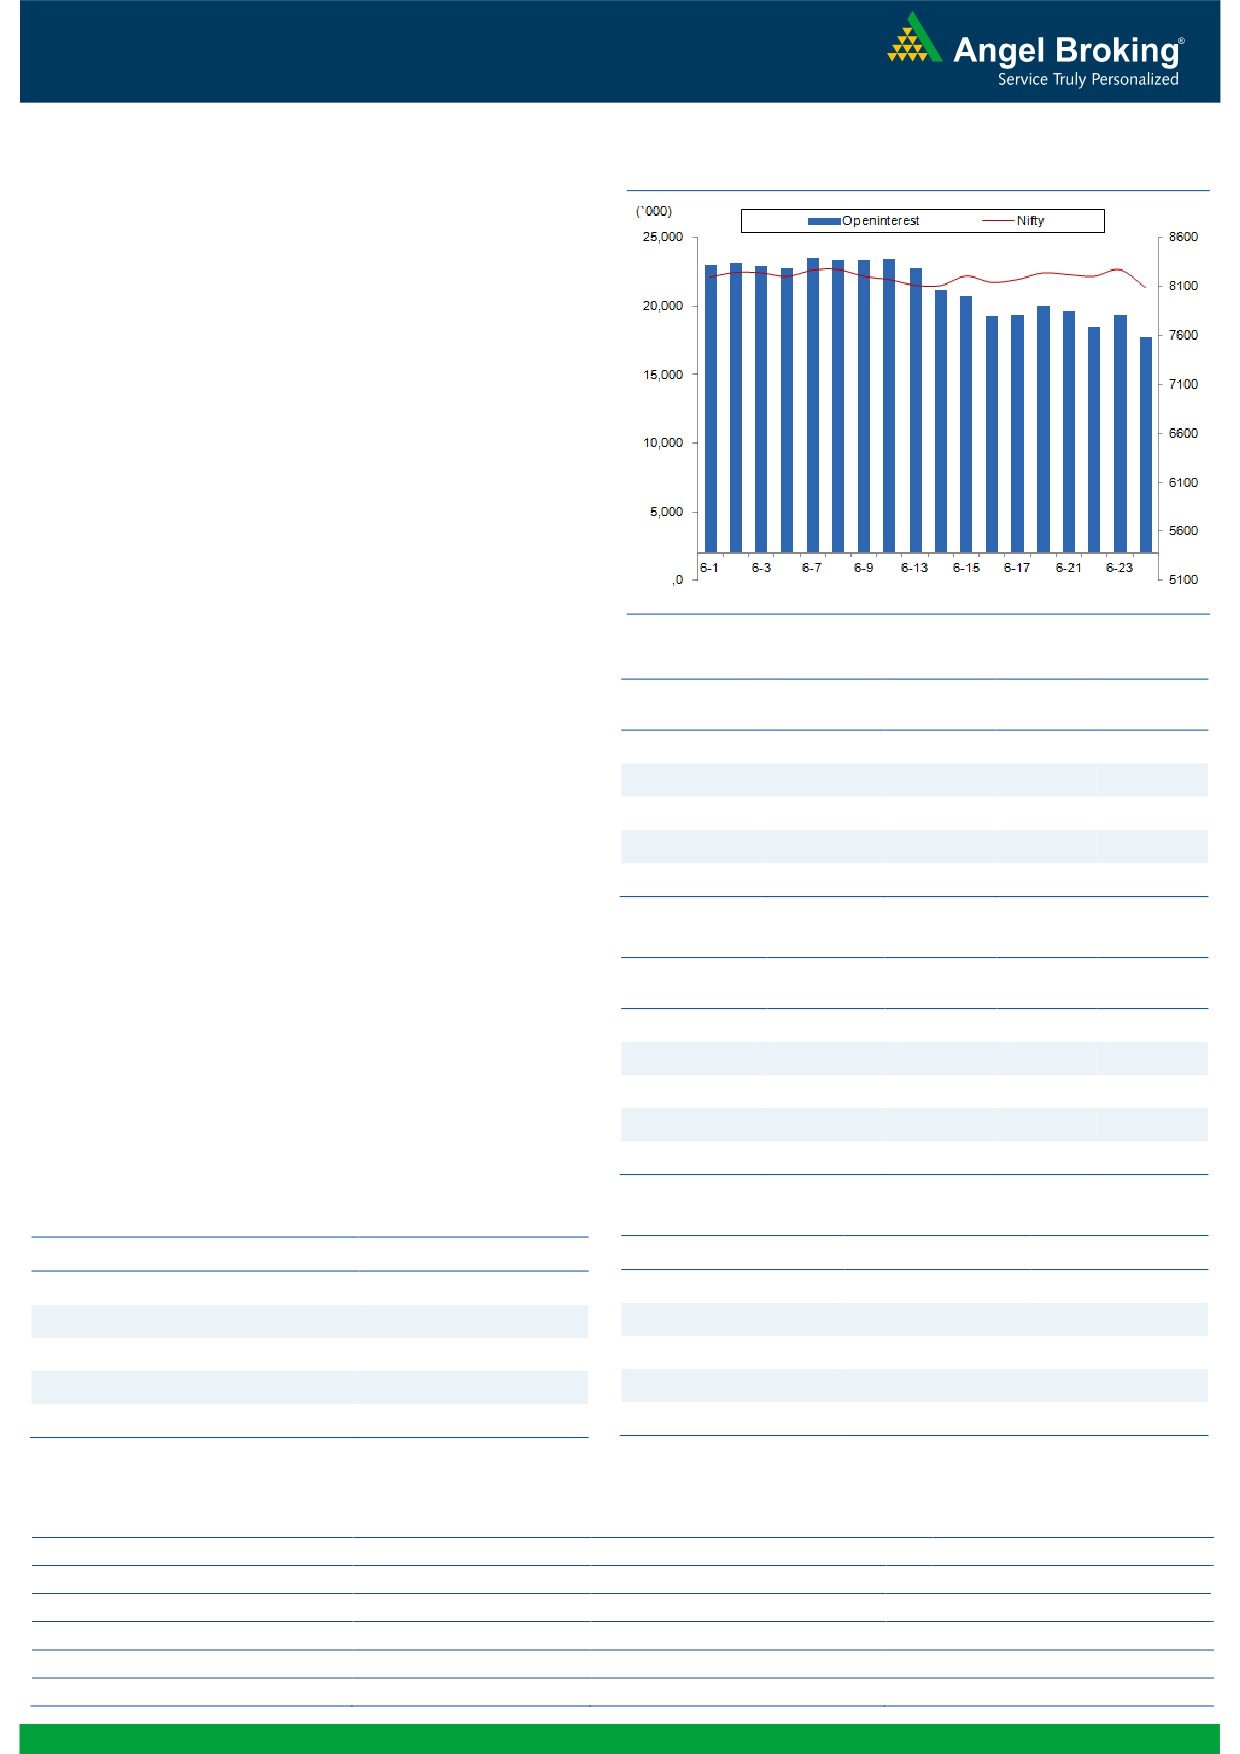
Nifty Vs OI
The Nifty futures open interest has decreased by 8.12%
BankNifty futures open interest has decreased by 0.99%
as market closed at 8088.60 levels.
The Nifty June future closed with a discount of 1.70
points against a premium of 1.35 points in previous
session. The July series closed at a premium of 29.75
points.
The Implied Volatility of at the money options has
decreased from 21.69% to 17.47%.
The total OI of the market is Rs. 2,56,555/- cr. and the
stock futures OI is Rs. 66,524/- cr.
Few of the liquid counters where we have seen high cost
of carry are JPASSOCIAT, GMRINFRA, GODREJIND,
MCLEODRUSS and MOTHERSUMI.
Views
OI Gainers
FIIs were net sellers in both cash market segment and in
OI
PRICE
Index Futures. They sold equities to the tune of Rs. 629
SCRIP
OI
PRICE
CHG. (%)
CHG. (%)
crores. While in Index Futures they sold significantly of
ALBK
15962000
19.67
64.70
2.21
Rs. 1768 crores with good amount of fall in open
ICICIBANK
57332600
12.68
231.40
-4.28
interest, indicating continuation of long unwinding in last
TATASTEEL
25490000
11.07
313.50
-6.33
trading session.
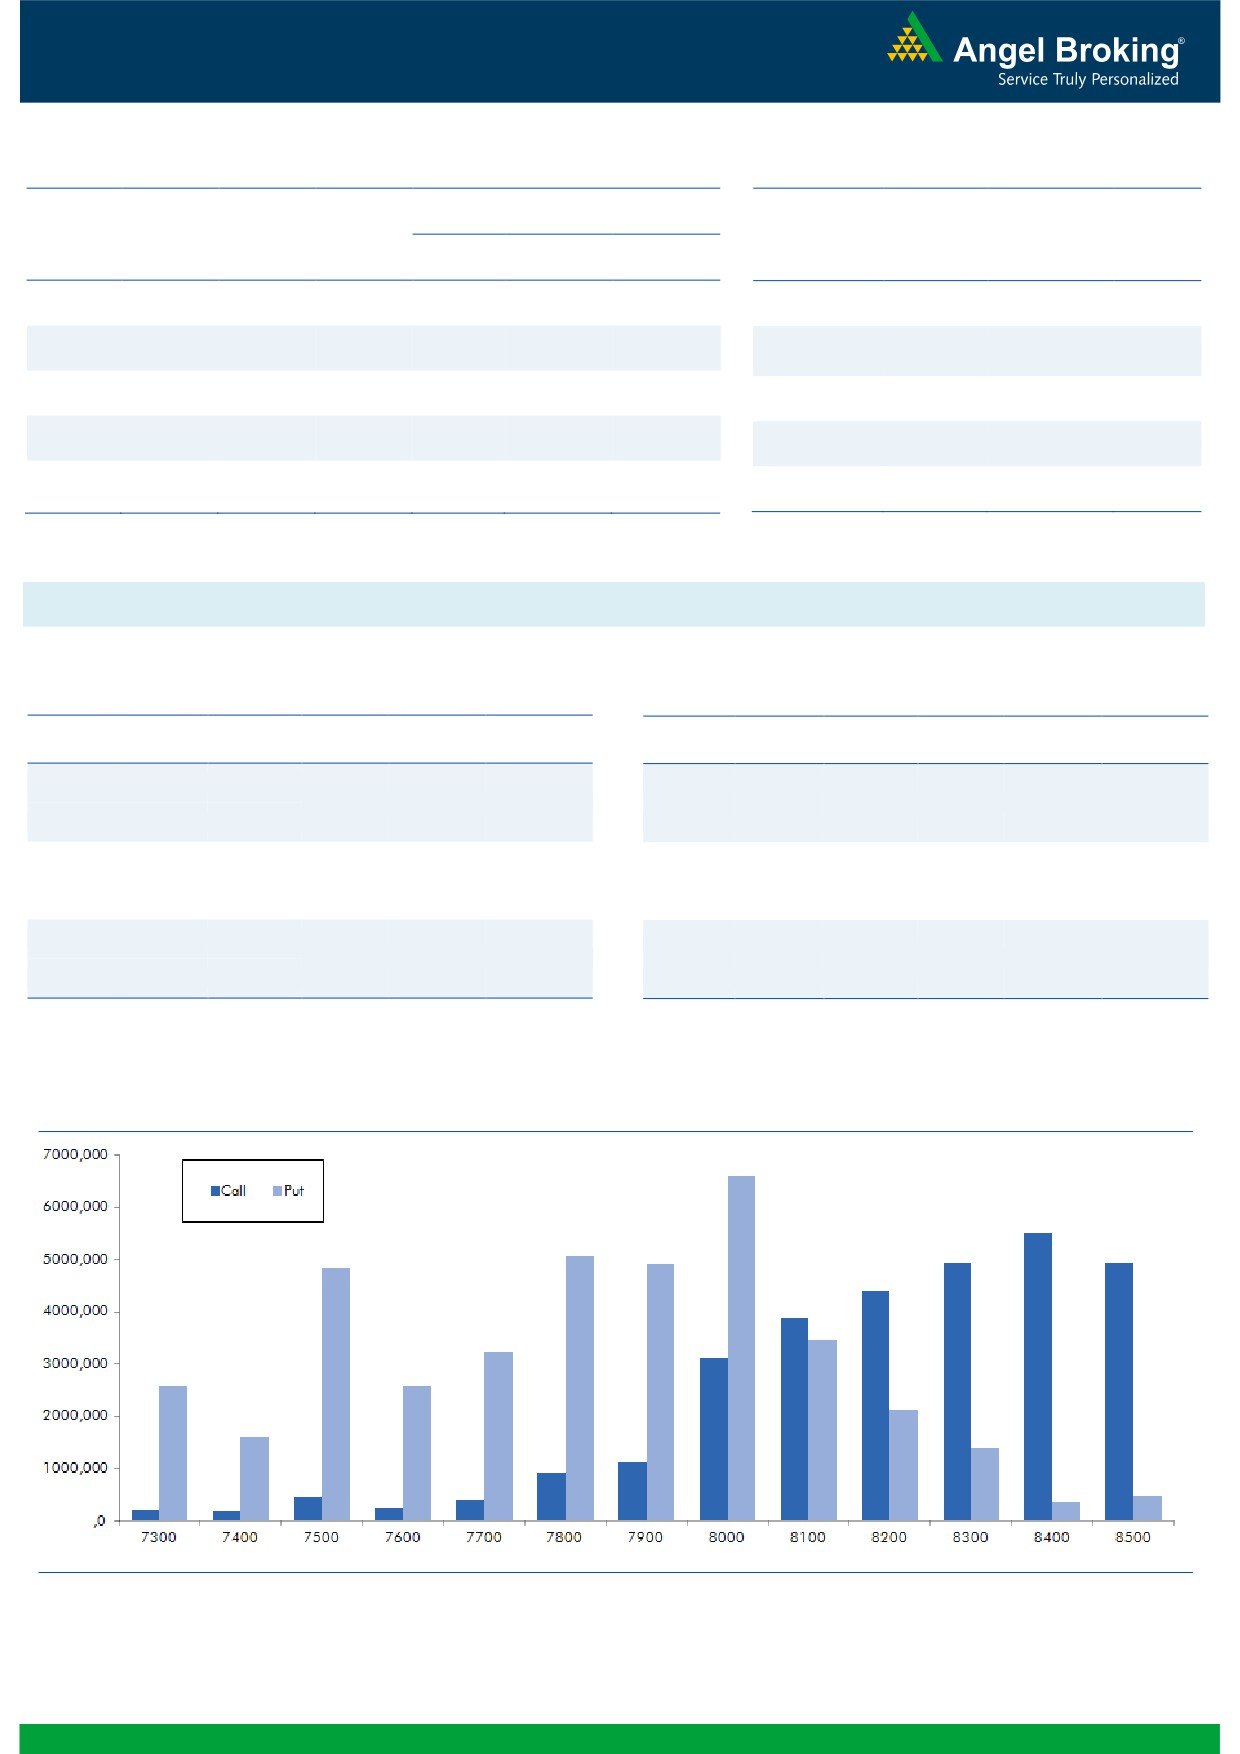
On Index Options front, FIIs bought worth Rs. 2692
IDBI
47352000
10.24
66.25
-5.36
crores with marginal change in open interest. In Call
M&MFIN
11771500
9.49
308.35
-3.61
option, 8000-8200 strikes added good amount of OI
and we believe it’s more of writing. Some unwinding was
OI Losers
also visible in 8400-8500 strike prices. While in Put
OI
PRICE
SCRIP
OI
PRICE
option, OI addition was seen in 7800-7900 strikes; these
CHG. (%)
CHG. (%)
are mostly longs. We also witnessed meaningful
OIL
678400
-16.14
349.60
-2.59
unwinding in 8000-8300 put options, we believe writers
IGL
2145000
-14.51
607.00
-0.13
of these put strikes left hopes on market sustaining at
UCOBANK
7960000
-14.32
38.05
-2.56
these higher levels. Maximum OI in June series is visible
ACC
816700
-11.27
1568.35
-0.57
in 8400 Call and 8000 Put options. We would suggest
AJANTPHARM
372400
-10.39
1476.50
1.81
traders to form any longs as of now.
Historical Volatility
Put-Call Ratio
SCRIP
HV
SCRIP
PCR-OI
PCR-VOL
MOTHERSUMI
57.80
NIFTY
1.07
0.94
TATASTEEL
45.65
BANKNIFTY
1.01
0.62
RELINFRA
42.82
SBIN
0.88
0.69
TATAMOTORS
59.04
TATAMOTORS
0.85
0.80
RELIANCE
23.49
RELIANCE
0.45
0.53
Strategy Date
Symbol
Strategy
Status
May 30, 2016
TCS
Ratio Bull Call Spread
Active
June 06, 2016
NIFTY
Long Call
Exited at Cost
June 13, 2016
ONGC
Ratio Bull Call Spread
Active
June 20, 2016
MARUTI
Long Call Ladder
Active
2
Technical & Derivatives Report
June 27, 2016
FII Statistics for 24-June 2016
Turnover on 24-June 2016
Open Interest
No. of
Turnover
Change
Detail
Buy
Sell
Net
Instrument
Value
Contracts
( in Cr. )
(%)
Contracts
Change (%)
(in Cr.)
INDEX
INDEX
4727.31
6495.24
(1767.93)
203874
12039.52
(13.30)
729962
42167.39
155.57
FUTURES
FUTURES
INDEX
INDEX
63259.09
60566.93
2692.16
1254343
75207.33
0.32
8601875
513843.85
75.75
OPTIONS
OPTIONS
STOCK
10739.92
10725.65
14.27
1076625
53377.41
(0.78)
STOCK
FUTURES
1016870
52628.23
84.67
FUTURES
STOCK
STOCK
9798.41
10170.24
(371.83)
132348
6820.05
6.19
OPTIONS
739134
39560.55
95.16
OPTIONS
TOTAL
88524.72
87958.06
566.67
2667190
147444.31
(1.04)
TOTAL
11087841
648200.02
81.25
Nifty Spot = 8088.60
Lot Size = 75
Bull-Call Spreads
Bear-Put Spreads
Action
Strike
Price
Risk
Reward
BEP
Action
Strike
Price
Risk
Reward
BEP
Buy
8100
67.00
Buy
8100
79.85
38.70
61.30
8138.70
36.55
63.45
8063.45
Sell
8200
28.30
Sell
8000
43.30
Buy
8100
67.00
Buy
8100
79.85
55.90
144.10
8155.90
56.30
143.70
8043.70
Sell
8300
11.10
Sell
7900
23.55
Buy
8200
28.30
Buy
8000
43.30
17.20
82.80
8217.20
19.75
80.25
7980.25
Sell
8300
11.10
Sell
7900
23.55
Note: Above mentioned Bullish or Bearish Spreads in Nifty (June Series) are given as an information and not as a recommendation.
Nifty Put-Call Analysis
3
Technical & Derivatives Report
June 27, 2016
Daily Pivot Levels for Nifty Constituents
Scrips
S2
S1
PIVOT
R1
R2
ACC
1,501
1,535
1,555
1,589
1,609
ADANIPORTS
192
197
200
205
208
AMBUJACEM
234
241
245
252
257
ASIANPAINT
953
971
982
1,001
1,011
AUROPHARMA
652
676
692
716
732
AXISBANK
486
498
505
517
524
BAJAJ-AUTO
2,510
2,594
2,639
2,724
2,769
BANKBARODA
138
143
145
150
152
BHEL
111
115
117
121
123
BPCL
983
998
1,011
1,027
1,040
BHARTIARTL
344
350
355
361
366
INFRATEL
293
309
318
334
343
BOSCH
20,169
20,665
21,327
21,822
22,485
CIPLA
453
465
471
483
490
COALINDIA
302
307
311
316
319
DRREDDY
3,053
3,103
3,135
3,185
3,217
EICHERMOT
17,737
18,199
18,463
18,925
19,189
GAIL
355
366
373
383
390
GRASIM
4,203
4,247
4,284
4,328
4,365
HCLTECH
714
728
737
751
761
HDFCBANK
1,135
1,149
1,160
1,174
1,185
HDFC
1,192
1,207
1,217
1,232
1,241
HEROMOTOCO
2,908
2,983
3,030
3,105
3,152
HINDALCO
109
113
116
121
124
HINDUNILVR
841
850
856
865
871
ICICIBANK
217
224
228
236
240
IDEA
95
97
99
101
102
INDUSINDBK
1,026
1,061
1,081
1,115
1,135
INFY
1,146
1,170
1,185
1,209
1,224
ITC
345
350
355
359
365
KOTAKBANK
700
717
728
744
755
LT
1,366
1,398
1,433
1,465
1,500
LUPIN
1,421
1,442
1,456
1,477
1,492
M&M
1,284
1,337
1,367
1,419
1,450
MARUTI
3,784
3,927
4,010
4,153
4,235
NTPC
141
145
147
152
154
ONGC
203
206
210
213
217
POWERGRID
149
152
154
158
160
RELIANCE
918
935
950
966
981
SBIN
199
205
209
215
219
SUNPHARMA
720
738
751
769
782
TCS
2,481
2,528
2,560
2,607
2,639
TATAMTRDVR
273
286
293
305
312
TATAMOTORS
409
429
441
462
474
TATAPOWER
68
70
72
74
75
TATASTEEL
288
301
308
321
329
TECHM
482
495
506
518
529
ULTRACEMCO
3,141
3,216
3,274
3,349
3,408
WIPRO
543
549
553
560
564
YESBANK
1,025
1,053
1,070
1,097
1,114
ZEEL
429
439
445
455
461
4
Technical & Derivatives Report
June 27, 2016
Research Team Tel: 022 - 39357800
For Technical Queries
For Derivatives Queries
DISCLAIMER
Angel Broking Private Limited (hereinafter referred to as “Angel”) is a registered Member of National Stock Exchange of India Limited,
Bombay Stock Exchange Limited and MCX Stock Exchange Limited. It is also registered as a Depository Participant with CDSL and
Portfolio Manager with SEBI. It also has registration with AMFI as a Mutual Fund Distributor. Angel Broking Private Limited is a
registered entity with SEBI for Research Analyst in terms of SEBI (Research Analyst) Regulations, 2014 vide registration number
INH000000164. Angel or its associates has not been debarred/ suspended by SEBI or any other regulatory authority for accessing
/dealing in securities Market. Angel or its associates including its relatives/analyst do not hold any financial interest/beneficial
ownership of more than 1% in the company covered by Analyst. Angel or its associates/analyst has not received any compensation /
managed or co-managed public offering of securities of the company covered by Analyst during the past twelve months. Angel/analyst
has not served as an officer, director or employee of company covered by Analyst and has not been engaged in market making activity
of the company covered by Analyst.
This document is solely for the personal information of the recipient, and must not be singularly used as the basis of any investment
decision. Nothing in this document should be construed as investment or financial advice. Each recipient of this document should
make such investigations as they deem necessary to arrive at an independent evaluation of an investment in the securities of the
companies referred to in this document (including the merits and risks involved), and should consult their own advisors to determine
the merits and risks of such an investment.
Reports based on technical and derivative analysis center on studying charts of a stock's price movement, outstanding positions and
trading volume, as opposed to focusing on a company's fundamentals and, as such, may not match with a report on a company's
fundamentals.
The information in this document has been printed on the basis of publicly available information, internal data and other reliable
sources believed to be true, but we do not represent that it is accurate or complete and it should not be relied on as such, as this
document is for general guidance only. Angel Broking Pvt. Limited or any of its affiliates/ group companies shall not be in any way
responsible for any loss or damage that may arise to any person from any inadvertent error in the information contained in this report.
Angel Broking Pvt. Limited has not independently verified all the information contained within this document. Accordingly, we cannot
testify, nor make any representation or warranty, express or implied, to the accuracy, contents or data contained within this document.
While Angel Broking Pvt. Limited endeavors to update on a reasonable basis the information discussed in this material, there may be
regulatory, compliance, or other reasons that prevent us from doing so.
This document is being supplied to you solely for your information, and its contents, information or data may not be reproduced,
redistributed or passed on, directly or indirectly.
Neither Angel Broking Pvt. Limited, nor its directors, employees or affiliates shall be liable for any loss or damage that may arise from
or in connection with the use of this information.
Note: Please refer to the important ‘Stock Holding Disclosure' report on the Angel website (Research Section). Also, please refer to the
latest update on respective stocks for the disclosure status in respect of those stocks. Angel Broking Pvt. Limited and its affiliates may
have investment positions in the stocks recommended in this report.
5