Technical & Derivatives Report
December 26, 2016
Sensex (26041) / Nifty (7986)
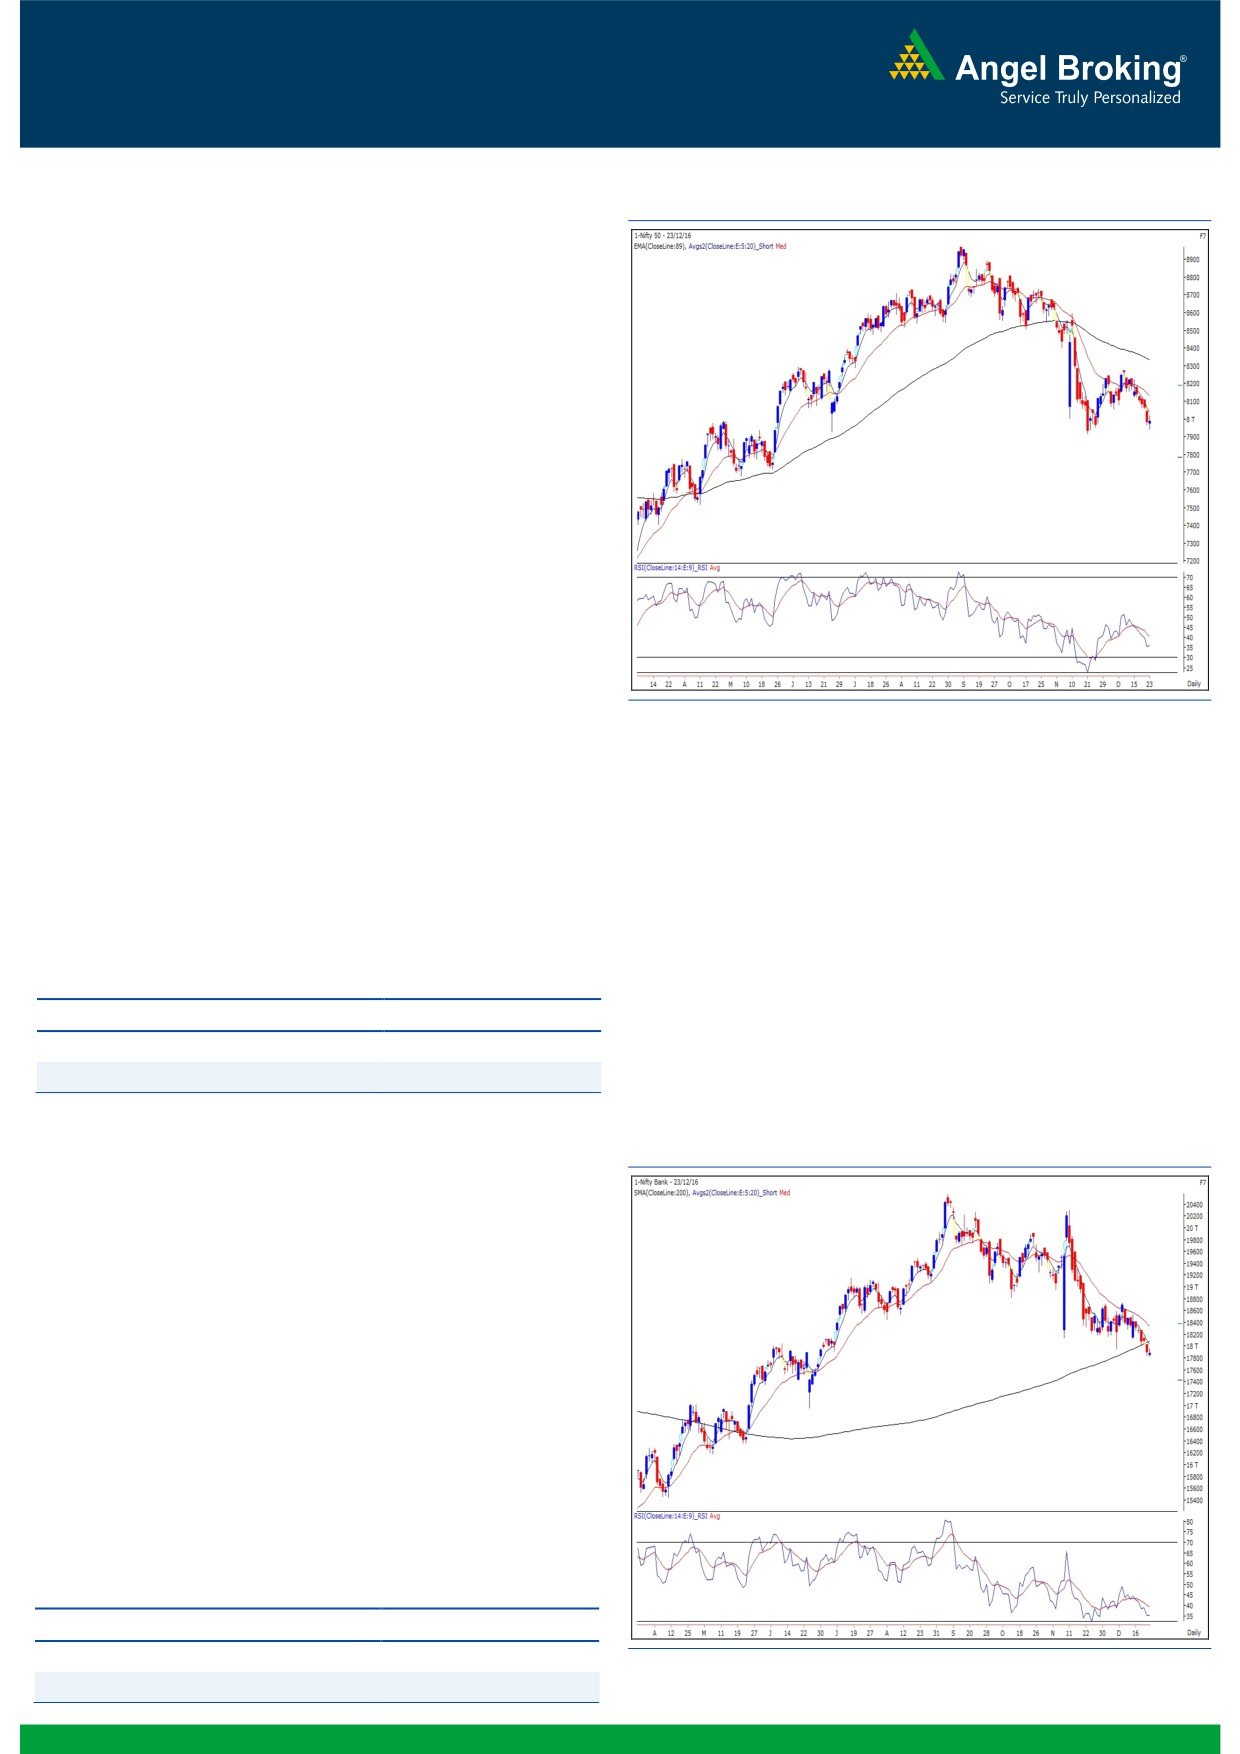
Exhibit 1: Nifty Daily Chart
On Friday, the Nifty traded range-bound and ended the session
on a flat note.
During the week, Nifty sneaked below the crucial support of
8056.85, which was the 'Higher Bottom' on the daily chart
registered on 21st November. The breach of the support indicates
Nifty’s continuation with the corrective/consolidation phase.
However, if we meticulously analyze Nifty's price movement with
the 'RSI Smoothened' index, it is observed that the momentum
oscillator had registered low of
9.19 during the previous
corrective move, when the index registered low of 7917.29 on
21st November. While the index has closed marginally above the
21st November's closing, the 'RSI Smoothened' oscillator is trading
significantly higher at 25.76. In the coming week, the index has
crucial support around 7917 (recent low) and could correct upto
7821 (127% reciprocal retracement of the recent upmove) only
on the breach of this low. Given the placement of the 'RSI
Smoothened' oscillator mentioned above, there is high probability
of a positive divergence formation, which is usually seen during
the tail end of the corrective moves.
Such tail end corrections should be used as opportunities to time
delivery based buying rather than creating short positions. Thus,
we advise traders to look for stock specific opportunities for
delivery based buying at current juncture and wait for fresh signs
to trade in the index. The major resistance for the index in the
coming week is seen around 8130.
Key Levels
Support 1 - 7917
Resistance 1 - 8046
Support 2 - 7821
Resistance 2 - 8130
Nifty Bank Outlook - (17884)
Exhibit 2: Nifty Bank Daily Chart
The Nifty Bank index traded in a narrow range on Friday and
ended the session almost near the previous session's close.
However, on weekly basis, the index has posted a loss of 2.34
percent over its previous week's close.
As we have mentioned last week, the Nifty Bank index has given
closing below the '200 SMA' support post a consolidation. This
does not bode well for the bulls and thus, the index can remain
sideways to negative in near term. We are not expecting any
sharp correction and thus trading in the index for a directional
move should be avoided by short-term traders. Meanwhile,
traders can focus on stock specific move and trade with proper
risk management. The intraday supports for the Nifty Bank index
are placed around 17730 and 17600 whereas resistances are
seen around 18093 and 18170.
Key Levels
Support 1 - 17730
Resistance 1 - 18093
Support 2 - 17600
Resistance 2 - 18170
1
Technical & Derivatives Report
December 26, 2016
Comments
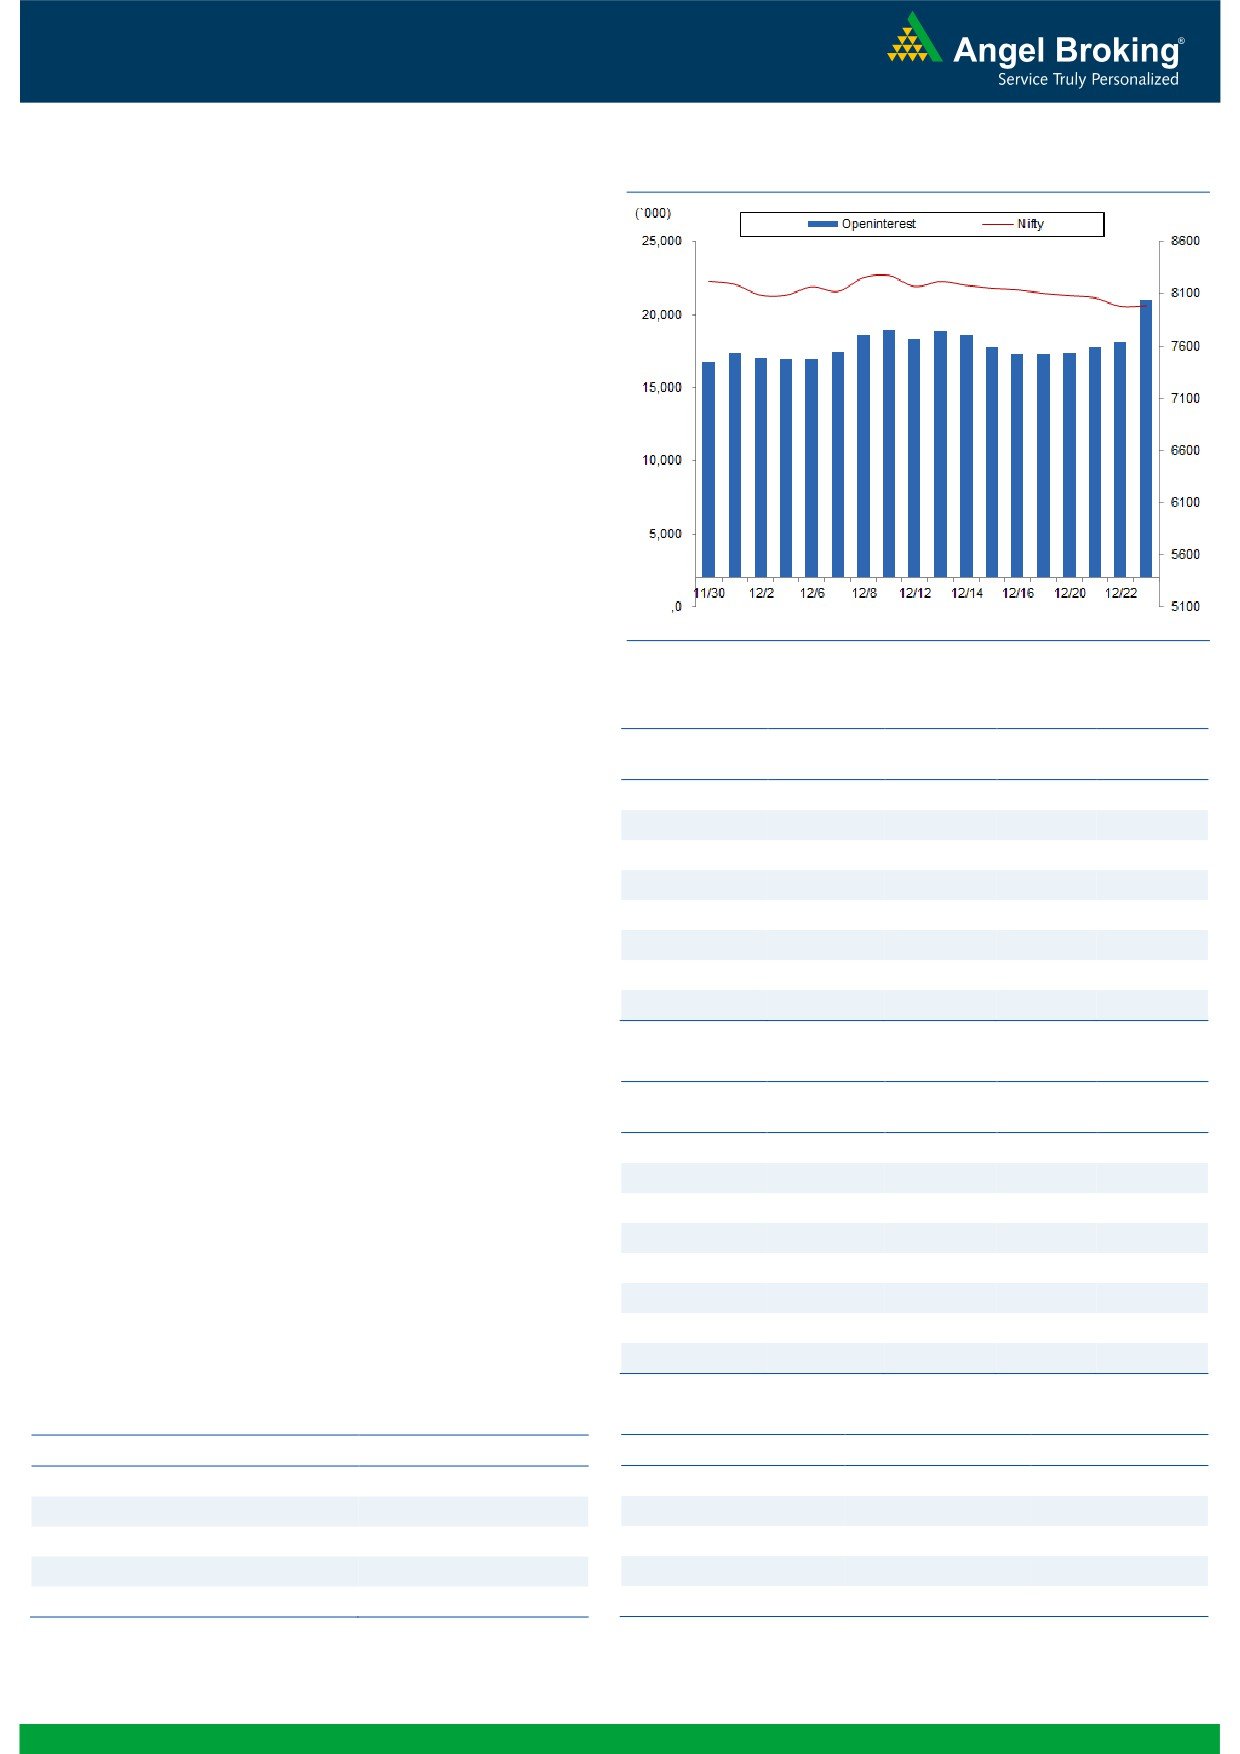
Nifty Vs OI
The Nifty futures open interest has increased by 15.87%
BankNifty futures open interest has decreased by 4.92%
as market closed at 7985.75 levels.
The Nifty December future closed with a premium of
9.25 against the premium of 17.75 points in last trading
session. The January series closed at a premium of
42.20 points.
The Implied Volatility of at the money options has
decreased from 12.78 % to 11.94%. At the same time,
the PCR-OI of Nifty has remained unchanged at 0.92
levels.
The total OI of the market is Rs. 2,72,159/- cr. and the
stock futures OI is Rs. 72,752/- cr.
Few of the liquid counters where we have seen high cost
of carry are SOUTHBANK, GMRINFRA, SYNDIBANK,
SAIL and IFCI.
Views
OI Gainers
FIIs continued their selling streak in cash segment as they
OI
PRICE
SCRIP
OI
PRICE
sold equities worth Rs. 1463 crores on Friday. While in
CHG. (%)
CHG. (%)
index futures, they were net seller to the tune of Rs. 654
DIVISLAB
2187600
66.86
863.25
-22.27
crores with significant rise in open interest, indicating
CIPLA
6713000
22.66
583.75
3.95
formation of huge short positions alongwith some long
TATAPOWER
27288000
20.99
73.95
-1.40
ng.com
long build-up in previous trading session.
NTPC
17404000
19.47
161.20
0.25
In index option segment, FIIs sold worth Rs. 698 crores
ENGINERSIN
7861000
18.52
321.15
1.71
with negligible change in open interest. In call options,
BHARATFIN
15280000
16.61
520.85
-6.30
except some build-up in 7950 strike, we hardly saw any
ORIENTBANK
15342000
14.77
108.25
-0.05
meaningful activity in any strikes. While in put options,
HCLTECH
6812400
14.68
795.75
-2.84
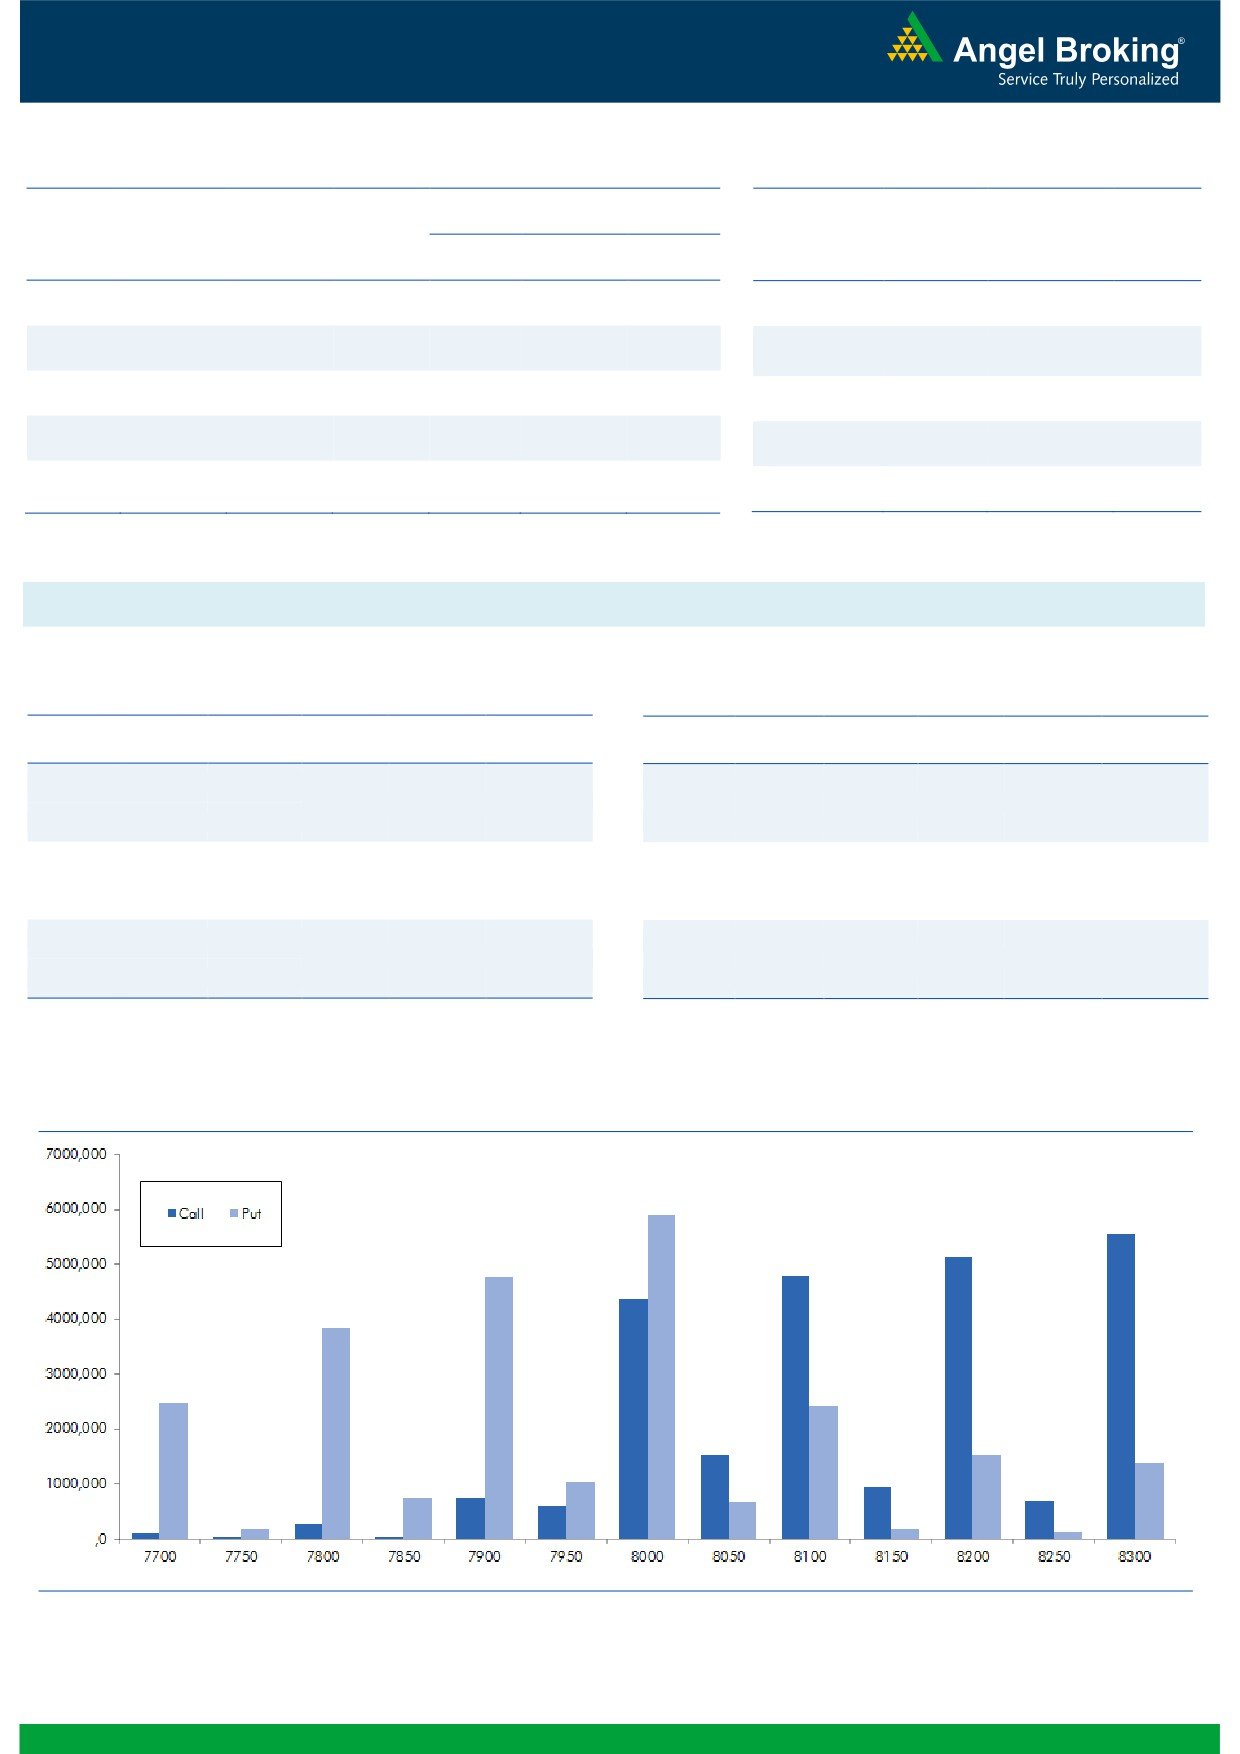
7950,
7850 and
7800 strikes added some fresh
positions; followed by unwinding in 8100 and 8000
OI Losers
strikes. Highest OI in current series is placed at 8300 call
OI
PRICE
SCRIP
OI
PRICE
and 8000 put option.
CHG. (%)
CHG. (%)
Last week, Nifty plunged below its strong support of
CEATLTD
1762600
-11.18
1146.95
1.17
8050-8100 and FIIs too actively participated in this
SRF
487000
-4.60
1498.05
1.01
move. They formed mixed positions in Index Futures,
APOLLOTYRE
7719000
-4.49
189.95
-0.11
however, majority of their positions formed were on short
CESC
2082300
-4.01
620.15
0.64
side. At present, we would like to wait for their follow-up
BIOCON
3304400
-3.99
932.15
-1.09
activity before forming any shorts at current levels. Thus,
FEDERALBNK
53394000
-3.27
65.20
-1.06
traders are suggested to remain light in Index and prefer
SRTRANSFIN
3572400
-3.05
805.60
1.56
stock specific approach to trade as of now.
GODREJIND
1900500
-2.46
404.00
-1.86
Historical Volatility
Put-Call Ratio
SCRIP
HV
SCRIP
PCR-OI
PCR-VOL
DIVISLAB
121.20
NIFTY
0.92
0.82
CIPLA
30.22
BANKNIFTY
1.04
0.88
CADILAHC
47.43
SUNPHARMA
0.42
0.39
HCLTECH
28.31
SBIN
0.49
0.38
PFC
42.07
RELIANCE
1.02
0.86
2
Technical & Derivatives Report
December 26, 2016
FII Statistics for December 23, 2016
Turnover on December 23, 2016
Open Interest
No. of
Turnover
Change
Detail
Buy
Sell
Net
Instrument
Value
Change
Contracts
( in Cr. )
(%)
Contracts
(in Cr.)
(%)
INDEX
INDEX
2522.09
3175.67
(653.58)
215747
13340.49
17.44
275195
16098.05
-8.32
FUTURES
FUTURES
INDEX
INDEX
33147.43
33845.23
(697.80)
1161237
70812.11
(0.02)
7496361
266725.77
-47.06
OPTIONS
OPTIONS
STOCK
10110.96
10100.81
10.15
937656
55060.30
2.72
STOCK
FUTURES
543401
43541.90
28.42
FUTURES
STOCK
STOCK
3970.78
4002.63
(31.85)
93377
5788.21
0.92
OPTIONS
325774
24389.92
11.15
OPTIONS
TOTAL
49751.26
51124.34
(1373.07)
2408017
145001.12
2.44
TOTAL
8640731
350755.63
-39.24
Nifty Spot = 7985.75
Lot Size = 75
Bull-Call Spreads
Bear-Put Spreads
Action
Strike
Price
Risk
Reward
BEP
Action
Strike
Price
Risk
Reward
BEP
Buy
8000
41.70
Buy
8000
46.35
30.15
69.85
8030.15
30.15
69.85
7969.85
Sell
8100
11.55
Sell
7900
16.20
Buy
8000
41.70
Buy
8000
46.35
38.10
161.90
8038.10
41.35
158.65
7958.65
Sell
8200
3.60
Sell
7800
5.00
Buy
8100
11.55
Buy
7900
16.20
7.95
92.05
8107.95
11.20
88.80
7888.80
Sell
8200
3.60
Sell
7800
5.00
Note: Above mentioned Bullish or Bearish Spreads in Nifty (December Series) are given as an information and not as a recommendation.
Nifty Put-Call Analysis
3
Technical & Derivatives Report
December 26, 2016
Daily Pivot Levels for Nifty Constituents
Scrips
S2
S1
PIVOT
R1
R2
ACC
1,276
1,286
1,296
1,306
1,315
ADANIPORTS
254
258
263
268
273
AMBUJACEM
197
198
200
202
204
ASIANPAINT
850
862
874
886
897
AUROPHARMA
632
640
653
661
675
AXISBANK
428
433
441
446
455
BAJAJ-AUTO
2,523
2,571
2,602
2,650
2,681
BANKBARODA
150
152
154
155
158
BHEL
117
118
119
120
122
BPCL
602
607
611
616
620
BHARTIARTL
289
292
295
298
301
INFRATEL
329
332
336
340
343
BOSCH
18,952
19,334
19,607
19,989
20,262
CIPLA
537
560
574
597
612
COALINDIA
285
286
288
289
291
DRREDDY
2,946
2,972
3,006
3,033
3,067
EICHERMOT
20,399
20,661
21,049
21,310
21,699
GAIL
412
422
428
438
444
GRASIM
805
817
825
836
844
HCLTECH
775
785
800
810
825
HDFCBANK
1,162
1,174
1,182
1,194
1,202
HDFC
1,198
1,211
1,222
1,235
1,246
HEROMOTOCO
2,964
3,002
3,028
3,066
3,092
HINDALCO
157
158
160
161
163
HINDUNILVR
773
781
790
799
808
ICICIBANK
248
250
252
254
257
IDEA
70
70
71
72
73
INDUSINDBK
1,024
1,043
1,056
1,075
1,089
INFY
957
973
990
1,006
1,023
ITC
222
223
225
227
229
KOTAKBANK
700
706
710
716
720
LT
1,288
1,313
1,327
1,352
1,367
LUPIN
1,429
1,437
1,449
1,457
1,469
M&M
1,143
1,157
1,169
1,184
1,196
MARUTI
4,978
5,087
5,151
5,260
5,324
NTPC
156
159
160
163
164
ONGC
189
191
194
196
199
POWERGRID
178
180
181
184
185
RELIANCE
1,042
1,050
1,059
1,067
1,076
SBIN
246
247
250
251
254
SUNPHARMA
603
613
621
632
640
TCS
2,256
2,272
2,295
2,311
2,334
TATAMTRDVR
288
291
293
296
299
TATAMOTORS
456
461
465
469
473
TATAPOWER
71
73
74
75
77
TATASTEEL
383
387
391
395
400
TECHM
458
462
470
475
482
ULTRACEMCO
3,021
3,064
3,111
3,155
3,202
WIPRO
450
454
460
464
469
YESBANK
1,112
1,118
1,129
1,136
1,146
ZEEL
421
432
438
449
456
4
Technical & Derivatives Report
December 26, 2016
Research Team Tel: 022 - 39357800
For Technical Queries
For Derivatives Queries
DISCLAIMER
Angel Broking Private Limited (hereinafter referred to as “Angel”) is a registered Member of National Stock Exchange of India Limited,
Bombay Stock Exchange Limited and Metropolitan Stock Exchange Limited. It is also registered as a Depository Participant with CDSL
and Portfolio Manager with SEBI. It also has registration with AMFI as a Mutual Fund Distributor. Angel Broking Private Limited is a
registered entity with SEBI for Research Analyst in terms of SEBI (Research Analyst) Regulations, 2014 vide registration number
INH000000164. Angel or its associates has not been debarred/ suspended by SEBI or any other regulatory authority for accessing
/dealing in securities Market. Angel or its associates/analyst has not received any compensation / managed or co-managed public
offering of securities of the company covered by Analyst during the past twelve months.
This document is solely for the personal information of the recipient, and must not be singularly used as the basis of any investment
decision. Nothing in this document should be construed as investment or financial advice. Each recipient of this document should
make such investigations as they deem necessary to arrive at an independent evaluation of an investment in the securities of the
companies referred to in this document (including the merits and risks involved), and should consult their own advisors to determine
the merits and risks of such an investment.
Reports based on technical and derivative analysis center on studying charts of a stock's price movement, outstanding positions and
trading volume, as opposed to focusing on a company's fundamentals and, as such, may not match with a report on a company's
fundamentals. Investors are advised to refer the Fundamental and Technical Research Reports available on our website to evaluate the
contrary view, if any.
The information in this document has been printed on the basis of publicly available information, internal data and other reliable
sources believed to be true, but we do not represent that it is accurate or complete and it should not be relied on as such, as this
document is for general guidance only. Angel Broking Pvt. Limited or any of its affiliates/ group companies shall not be in any way
responsible for any loss or damage that may arise to any person from any inadvertent error in the information contained in this report.
Angel Broking Pvt. Limited has not independently verified all the information contained within this document. Accordingly, we cannot
testify, nor make any representation or warranty, express or implied, to the accuracy, contents or data contained within this document.
While Angel Broking Pvt. Limited endeavors to update on a reasonable basis the information discussed in this material, there may be
regulatory, compliance, or other reasons that prevent us from doing so.
This document is being supplied to you solely for your information, and its contents, information or data may not be reproduced,
redistributed or passed on, directly or indirectly.
Neither Angel Broking Pvt. Limited, nor its directors, employees or affiliates shall be liable for any loss or damage that may arise from
or in connection with the use of this information.
5