Technical & Derivatives Report
September 26, 2016
Sensex (28668) / Nifty (8832)
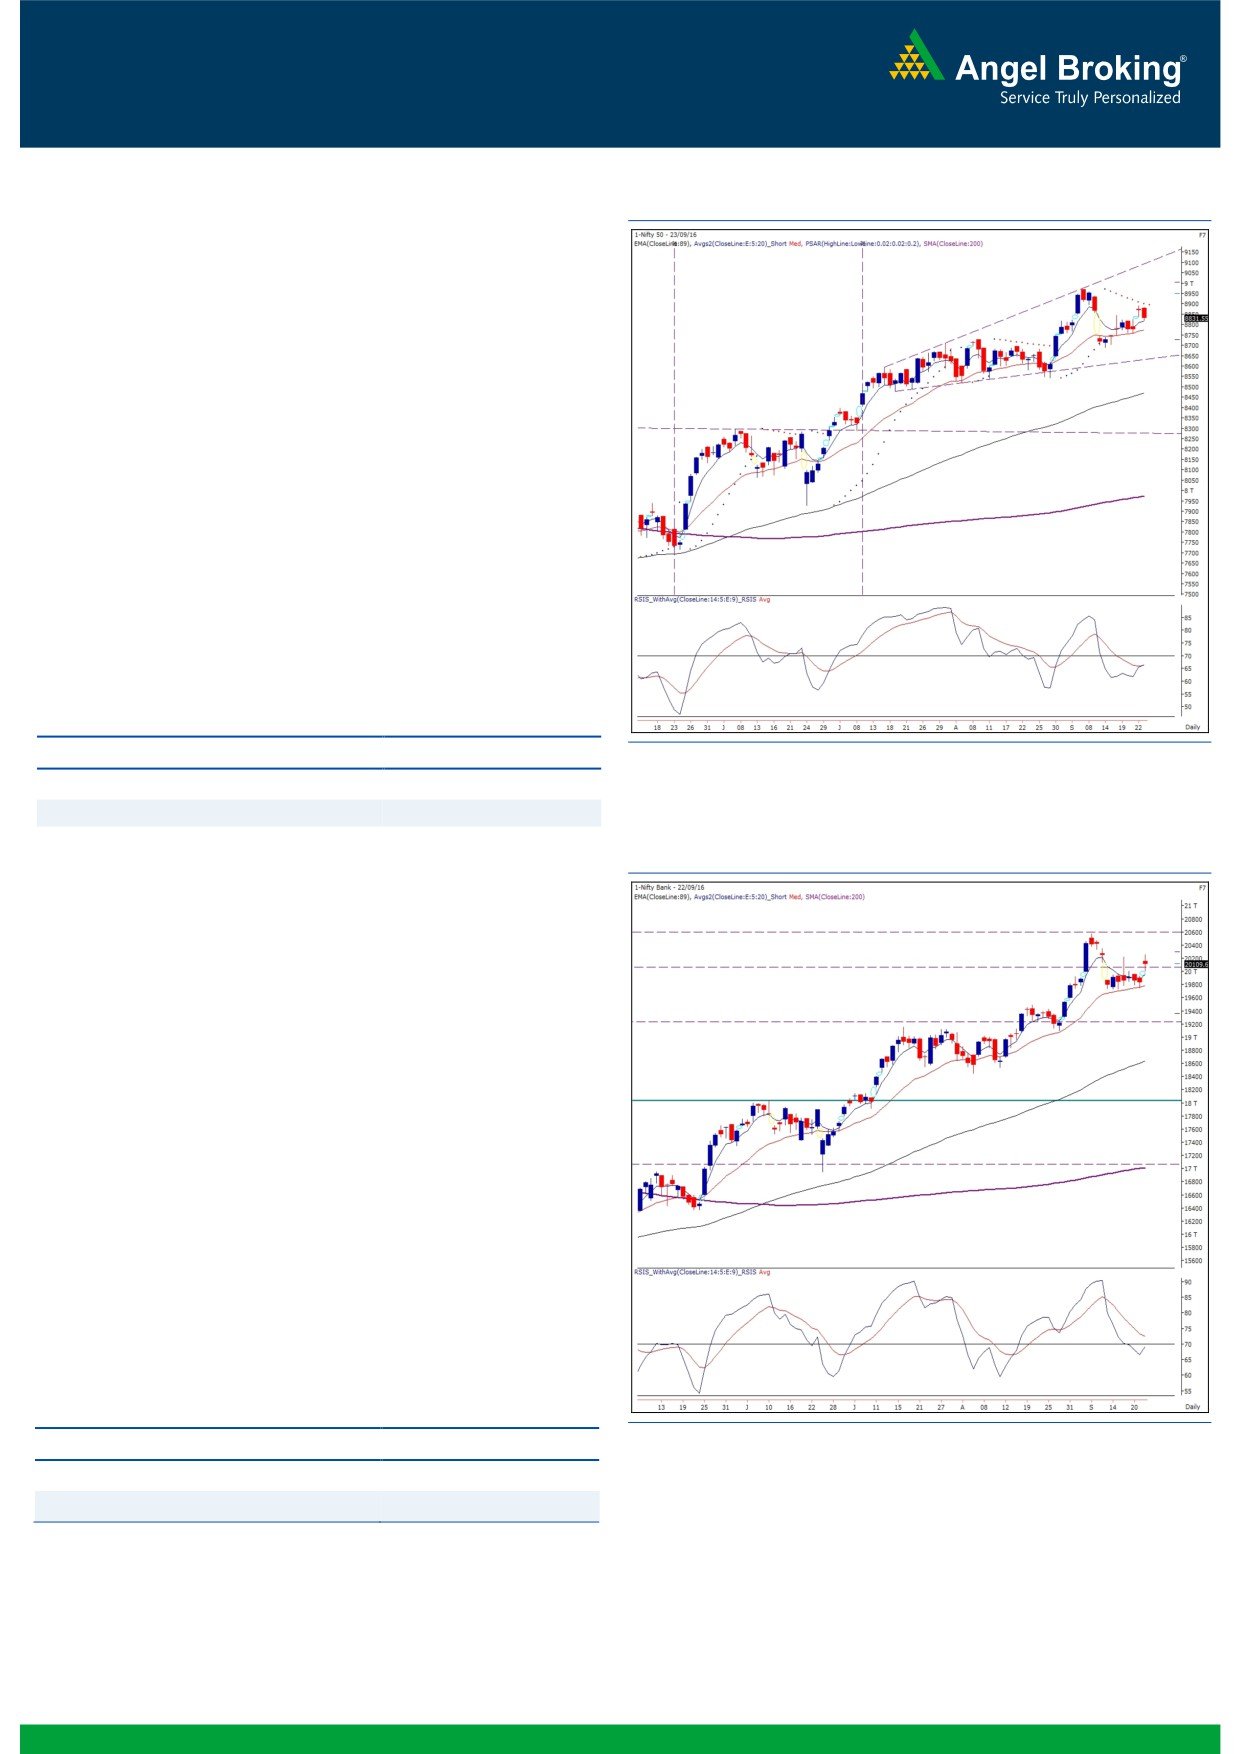
Exhibit 1: Nifty Daily Chart
Despite strong opening on Thursday, we maintained a cautious
stance on the market not only for the last couple of sessions of the
week but also for the forthcoming week. The reason being the
‘Shooting Star’ pattern formed on weekly chart during the
antepenultimate week. Secondly, we can observe a strong
resistance around the 61.8% Fibonacci retracement (8880) of the
recent down move; coinciding with the ‘Downward Gap Area’ as
well as the ‘Parabolic SAR’ indicator on daily chart. Thus, we are
a bit sceptical on the last week’s bounce and expect a near term
corrective move towards 8688 - 8622 levels, as long as Nifty
manages to stay below the 8910 mark on a closing basis. In case
of a sustained move beyond this level, we could see this bounce
extending towards the recent high of 8968.70 and then probably
allowing us to reassess the situation. Till then, it is advisable for
traders to stay light on positions, follow strict stop losses and
avoid taking undue risks.
Key Levels
Support 1 - 8750
Resistance 1 - 8880
Support 2 - 8688
Resistance 2 - 8910
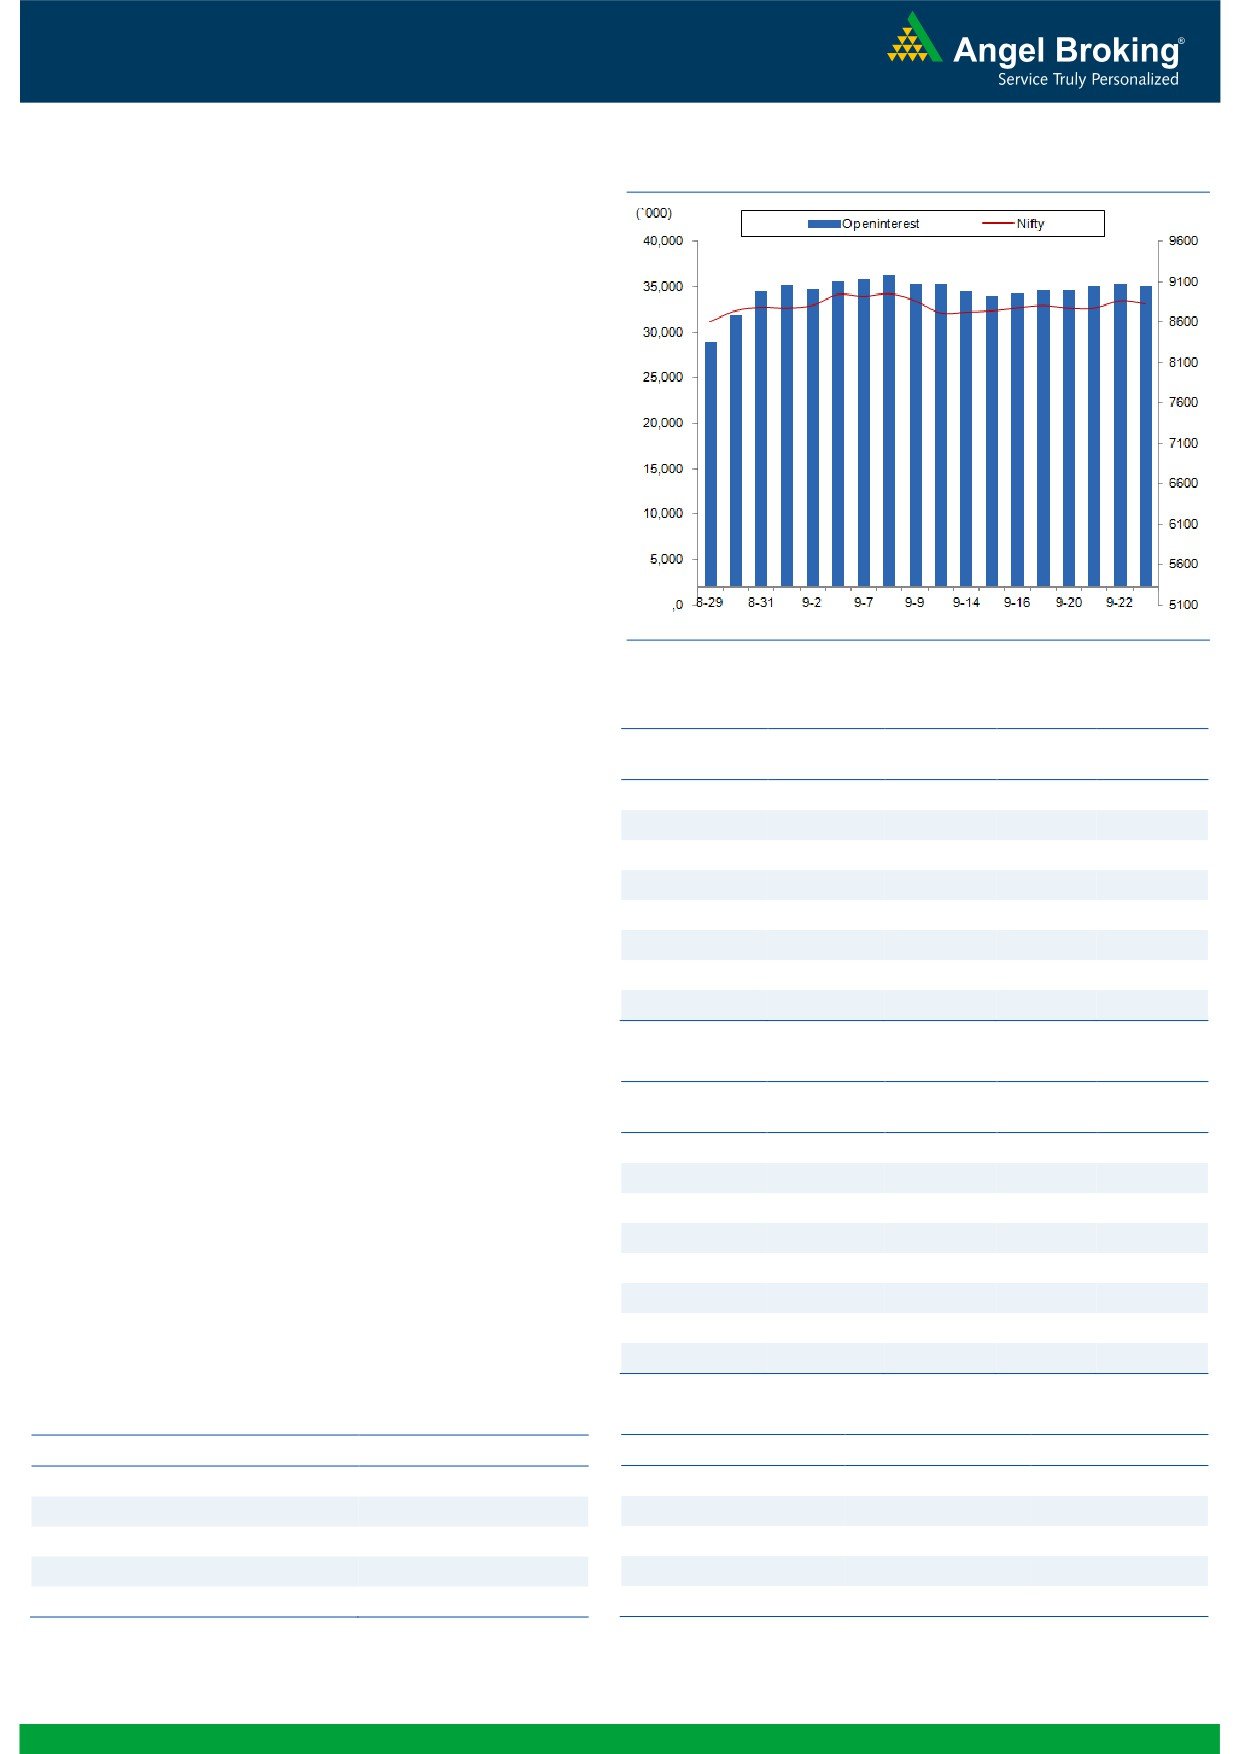
Exhibit 2: Nifty Bank Daily Chart
Nifty Bank Outlook - (19902)
In Friday's trading session, the Nifty Bank index corrected post
opening and ended the session with loss of 1.03 percent over its
previous session's close. Amongst index heavyweights, 'Axis Bank'
led to the bearish momentum as the stock corrected by 5.80% on
Friday.
The price action during last couple of weeks has led to formation
of two 'Doji' candles on weekly charts. The mentioned candlestick
pattern indicates 'indecision' as neither the bulls of the bears were
able to gain control. Thus, the directional momentum in the Nifty
Bank index could only be seen post breakout of last couple of
weeks range i.e. 19730 - 20265. However, since last few days,
we have been advising trades to stay cautious and we continue
with the view as there is higher probability of a corrective move in
near term. The intraday support for the Nifty Bank index are
placed around 19800 and 19730 whereas resistances are seen
around 20060 and 20150.
Key Levels
Support 1 - 19800
Resistance 1 - 20060
Support 2 - 19730
Resistance 2 - 20150
1
Technical & Derivatives Report
September 26, 2016
Comments
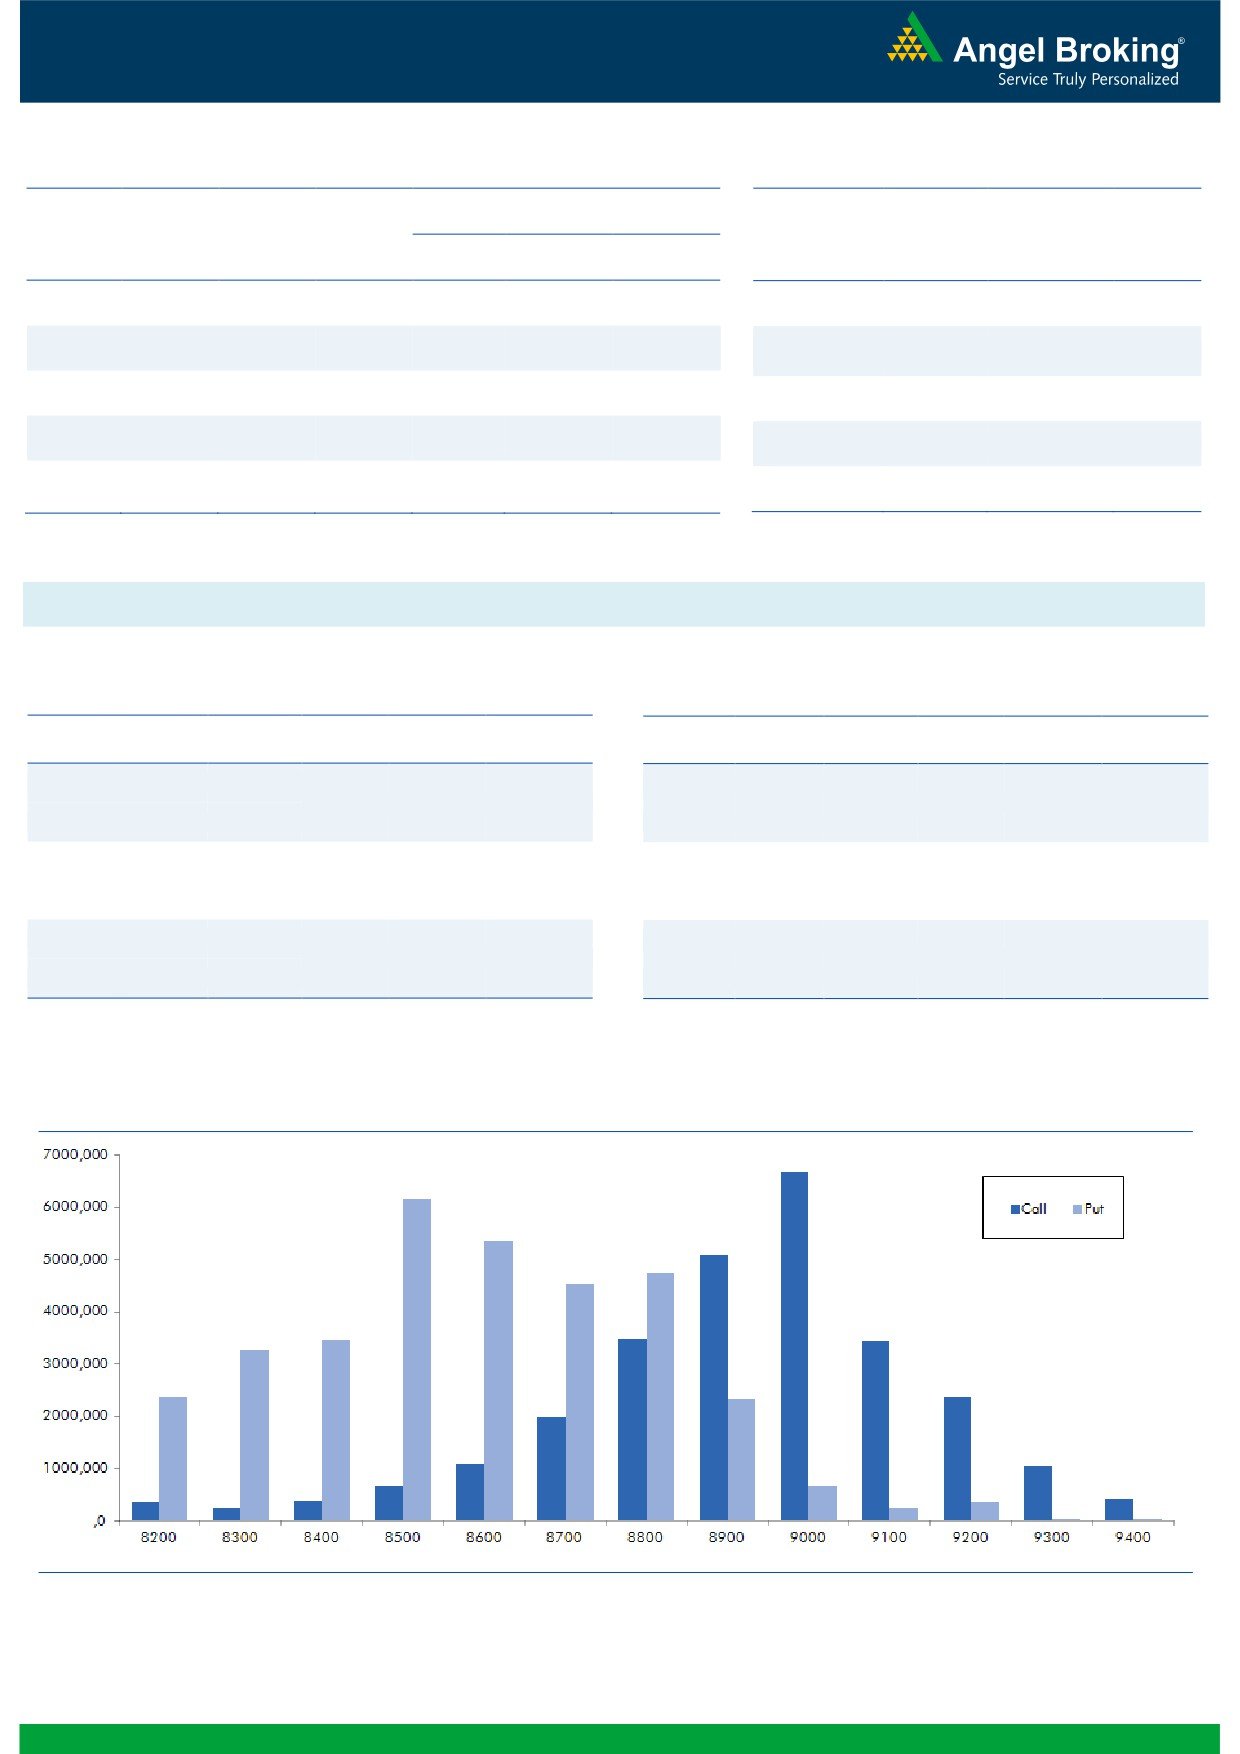
Nifty Vs OI
The Nifty futures open interest has decreased by 0.68%
BankNifty futures open interest has increased by 5.93%
as market closed at 8831.55 levels.
The Nifty September future closed with a premium of
12.10 points against a premium of 17.00 points in
previous session. The October series closed at a
premium of 55.85 points.
The Implied Volatility of at the money options has
increased from 11.17% to 11.33%. At the same time, the
PCR-OI of Nifty has decreased from 1.16 to 1.15.
The total OI of the market is Rs. 3,14,660/- cr. and the
stock futures OI is Rs. 88,477/- cr.
Few of the liquid counters where we have seen high cost
of carry are JPASSOCIAT, MINDTREE, SOUTHBANK,
RCOM and HDIL.
Views
OI Gainers
On Friday, FIIs were net sellers in cash segment; they
OI
PRICE
SCRIP
OI
PRICE
sold equities worth Rs. 300 crores. While, they were net
CHG. (%)
CHG. (%)
buyers of Rs. 386 crores in index futures with some rise in
SRF
521500
51.82
1789.90
9.74
OI, indicating long formation in last trading session.
RELCAPITAL
12430500
14.37
583.40
1.28
On Index Options front, FIIs sold to the tune of Rs. 634
BATAINDIA
4292200
13.30
507.70
-1.18
www.angelbroking.com
crores with marginal change in OI. On Friday, we didn’t
AXISBANK
41094000
12.97
559.20
-5.88
find any strike of both call and put options adding
SINTEX
40220625
12.43
86.70
2.06
relevant build-up. Some unwinding was witness in 8800
LUPIN
6856500
12.05
1492.10
-2.70
call and 8500 put options. Highest OI in September
JUBLFOOD
2823500
11.76
994.55
1.61
series is placed at 9000 call and 8500 put option.
NHPC
25461000
9.78
26.10
-2.79
Global market indicates we may start today’s session in
red. From last two weeks, we are hardly witnessing any
OI Losers
meaningful fresh directional positions in Index Futures.
OI
PRICE
SCRIP
OI
PRICE
While, large cap stock added decent short last week.
CHG. (%)
CHG. (%)
Thus, traders are suggested to avoid longs as we expect
GLENMARK
2576700
-12.86
944.85
1.37
Nifty to test 8650-8700 levels in near term.
AJANTPHARM
478800
-8.77
2044.55
-0.27
Friday, large cap counters like AXISBANK, LUPIN,
SRTRANSFIN
3262800
-6.60
1189.75
0.15
INFRATEL and AMBUJACEM have seen decent short
SIEMENS
976000
-5.79
1275.20
0.79
formation. While, most of the stock that closed in green
TORNTPHARM
336000
-5.62
1641.05
-0.69
were due to short covering.
NTPC
23820000
-5.58
156.80
-0.16
PETRONET
6840000
-5.16
343.75
0.51
MCLEODRUSS
4584000
-5.09
184.35
1.37
Historical Volatility
Put-Call Ratio
SCRIP
HV
SCRIP
PCR-OI
PCR-VOL
SRF
53.56
NIFTY
1.15
1.10
NIITTECH
32.52
BANKNIFTY
1.10
0.98
AXISBANK
44.09
RELIANCE
0.76
0.52
IRB
47.79
YESBANK
0.62
0.74
LUPIN
29.45
AXISBANK
0.43
0.57
2
Technical & Derivatives Report
September 26, 2016
FII Statistics for 23, September 2016
Turnover on 23, September 2016
Open Interest
No. of
Turnover
Change
Detail
Buy
Sell
Net
Instrument
Value
Contracts
( in Cr. )
(%)
Contracts
Change (%)
(in Cr.)
INDEX
INDEX
2120.35
1734.69
385.66
479775
32490.21
0.92
181496
12992.98
-33.86
FUTURES
FUTURES
INDEX
INDEX
34371.40
35005.47
(634.07)
1380752
93829.32
(0.03)
3279454
232914.47
-55.22
OPTIONS
OPTIONS
STOCK
9521.88
9871.27
(349.39)
939039
62910.17
0.01
STOCK
FUTURES
756163
53883.21
15.06
FUTURES
STOCK
STOCK
7186.81
7372.05
(185.25)
123415
8680.77
0.83
OPTIONS
510987
37173.35
14.19
OPTIONS
TOTAL
53200.44
53983.48
(783.04)
2922981
197910.48
0.17
TOTAL
4728100
336964.02
-45.58
Nifty Spot = 8831.55
Lot Size = 75
Bull-Call Spreads
Bear-Put Spreads
Action
Strike
Price
Risk
Reward
BEP
Action
Strike
Price
Risk
Reward
BEP
Buy
8800
74.05
Buy
8900
79.50
49.45
50.55
8849.45
47.00
53.00
8853.00
Sell
8900
24.60
Sell
8800
32.50
Buy
8800
74.05
Buy
8900
79.50
68.50
131.50
8868.50
66.55
133.45
8833.45
Sell
9000
5.55
Sell
8700
12.95
Buy
8900
24.60
Buy
8800
32.50
19.05
80.95
8919.05
19.55
80.45
8780.45
Sell
9000
5.55
Sell
8700
12.95
Note: Above mentioned Bullish or Bearish Spreads in Nifty (September Series) are given as an information and not as a recommendation.
Nifty Put-Call Analysis
3
Technical & Derivatives Report
September 26, 2016
Daily Pivot Levels for Nifty Constituents
Scrips
S2
S1
PIVOT
R1
R2
ACC
1,572
1,594
1,633
1,656
1,695
ADANIPORTS
271
273
275
277
280
AMBUJACEM
253
256
261
264
269
ASIANPAINT
1,175
1,183
1,193
1,201
1,212
AUROPHARMA
815
828
845
859
876
AXISBANK
529
543
570
584
610
BAJAJ-AUTO
2,891
2,910
2,932
2,952
2,974
BANKBARODA
166
167
170
172
174
BHEL
142
144
147
149
153
BPCL
597
601
604
608
612
BHARTIARTL
321
324
327
330
333
INFRATEL
360
365
374
380
388
BOSCH
23,082
23,211
23,356
23,485
23,630
CIPLA
598
605
611
618
624
COALINDIA
326
327
329
330
331
DRREDDY
3,137
3,159
3,173
3,196
3,210
EICHERMOT
24,351
24,602
24,801
25,052
25,251
GAIL
380
383
388
391
396
GRASIM
4,827
4,863
4,920
4,956
5,012
HCLTECH
786
792
798
803
809
HDFCBANK
1,294
1,303
1,311
1,320
1,328
HDFC
1,406
1,416
1,421
1,431
1,437
HEROMOTOCO
3,494
3,513
3,534
3,553
3,574
HINDALCO
151
153
155
157
159
HINDUNILVR
897
904
908
915
920
ICICIBANK
266
269
272
275
278
IDEA
81
82
83
83
84
INDUSINDBK
1,199
1,210
1,220
1,231
1,242
INFY
1,028
1,035
1,047
1,054
1,066
ITC
249
251
254
256
259
KOTAKBANK
787
792
798
802
808
LT
1,475
1,486
1,502
1,513
1,529
LUPIN
1,455
1,472
1,501
1,518
1,547
M&M
1,395
1,402
1,415
1,422
1,435
MARUTI
5,535
5,568
5,599
5,633
5,664
NTPC
155
156
157
158
159
ONGC
256
258
261
263
266
POWERGRID
173
175
177
178
181
RELIANCE
1,080
1,091
1,100
1,112
1,121
SBIN
251
253
256
258
261
SUNPHARMA
770
775
783
788
796
TCS
2,358
2,378
2,391
2,411
2,424
TATAMTRDVR
343
347
353
357
362
TATAMOTORS
547
550
554
557
562
TATAPOWER
75
75
76
76
77
TATASTEEL
366
369
374
377
381
TECHM
450
452
455
457
460
ULTRACEMCO
3,913
3,939
3,976
4,002
4,039
WIPRO
476
478
481
483
486
YESBANK
1,216
1,225
1,237
1,245
1,258
ZEEL
519
522
526
529
533
4
Technical & Derivatives Report
September 26, 2016
Research Team Tel: 022 - 39357800
For Technical Queries
For Derivatives Queries
DISCLAIMER
Angel Broking Private Limited (hereinafter referred to as “Angel”) is a registered Member of National Stock Exchange of India Limited,
Bombay Stock Exchange Limited and Metropolitan Stock Exchange Limited. It is also registered as a Depository Participant with CDSL
and Portfolio Manager with SEBI. It also has registration with AMFI as a Mutual Fund Distributor. Angel Broking Private Limited is a
registered entity with SEBI for Research Analyst in terms of SEBI (Research Analyst) Regulations, 2014 vide registration number
INH000000164. Angel or its associates has not been debarred/ suspended by SEBI or any other regulatory authority for accessing
/dealing in securities Market. Angel or its associates/analyst has not received any compensation / managed or co-managed public
offering of securities of the company covered by Analyst during the past twelve months.
This document is solely for the personal information of the recipient, and must not be singularly used as the basis of any investment
decision. Nothing in this document should be construed as investment or financial advice. Each recipient of this document should
make such investigations as they deem necessary to arrive at an independent evaluation of an investment in the securities of the
companies referred to in this document (including the merits and risks involved), and should consult their own advisors to determine
the merits and risks of such an investment.
Reports based on technical and derivative analysis center on studying charts of a stock's price movement, outstanding positions and
trading volume, as opposed to focusing on a company's fundamentals and, as such, may not match with a report on a company's
fundamentals. Investors are advised to refer the Fundamental and Technical Research Reports available on our website to evaluate the
contrary view, if any.
The information in this document has been printed on the basis of publicly available information, internal data and other reliable
sources believed to be true, but we do not represent that it is accurate or complete and it should not be relied on as such, as this
document is for general guidance only. Angel Broking Pvt. Limited or any of its affiliates/ group companies shall not be in any way
responsible for any loss or damage that may arise to any person from any inadvertent error in the information contained in this report.
Angel Broking Pvt. Limited has not independently verified all the information contained within this document. Accordingly, we cannot
testify, nor make any representation or warranty, express or implied, to the accuracy, contents or data contained within this document.
While Angel Broking Pvt. Limited endeavors to update on a reasonable basis the information discussed in this material, there may be
regulatory, compliance, or other reasons that prevent us from doing so.
This document is being supplied to you solely for your information, and its contents, information or data may not be reproduced,
redistributed or passed on, directly or indirectly.
Neither Angel Broking Pvt. Limited, nor its directors, employees or affiliates shall be liable for any loss or damage that may arise from
or in connection with the use of this information.
5