Technical & Derivatives Report
August 26, 2016
Sensex (27836) / Nifty (8592)
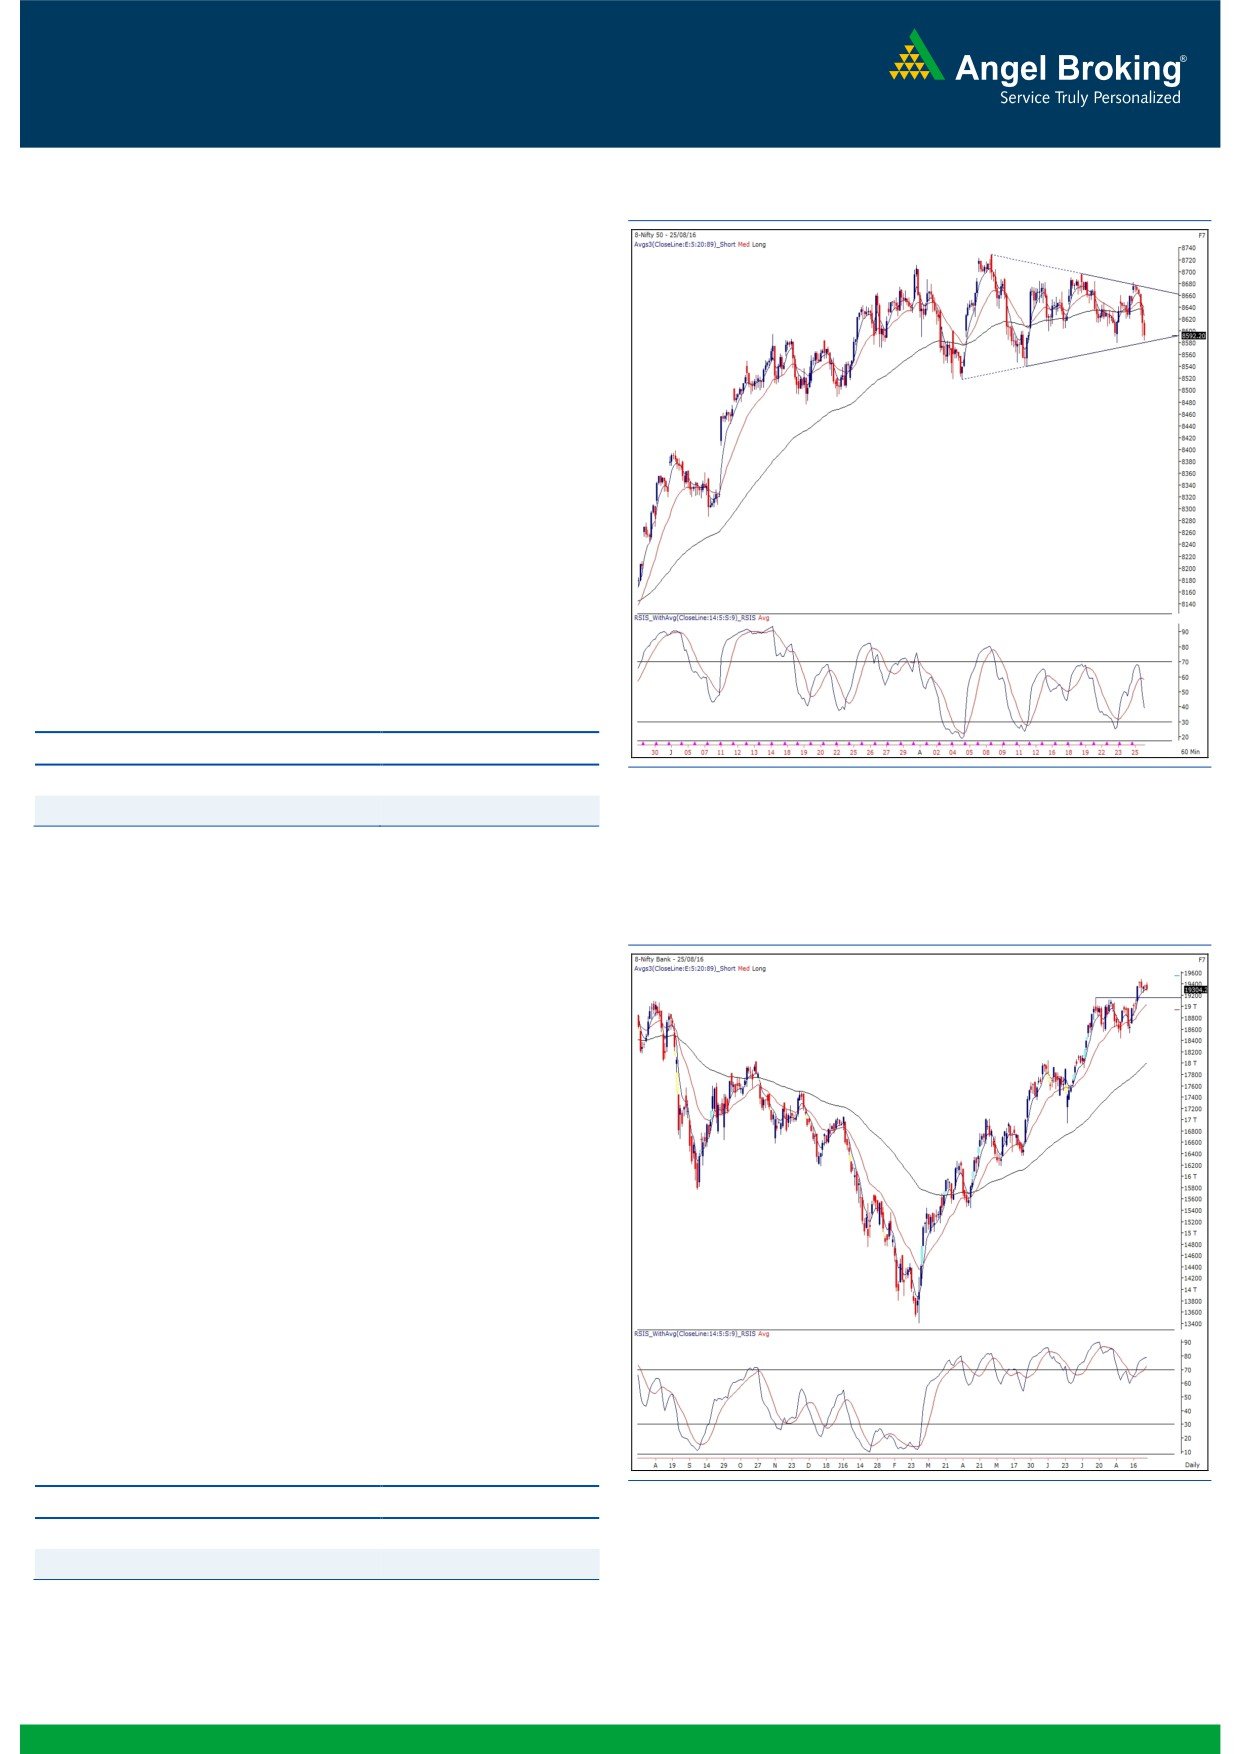
Exhibit 1: Nifty Hourly Chart
Yesterday, once again we witnessed a gap opening with marginal
gains despite unfavourable cues from the Asian bourses.
Subsequently, the index slipped into a consolidation mode and
post the mid session, a sharp cut in the market pulled the index
below 8600 on a closing basis.
The Nifty has now breached the psychological level of 8600 on a
closing basis and is now nearing the lower end of the recent
range i.e. 8560 - 8540. Going forward, traders need to keep a
close eye on 8620 - 8630, which would be seen as intraday
resistance zone. In case of a sustainable move above this zone,
we may see the index moving towards 8670 - 8695 levels.
However, a failure to do so may result into some weakness in the
market. Considering this mixed picture, we would advise traders
to stick to a stock centric approach, which may offer better trading
opportunities.
Key Levels
Support 1 - 8560
Resistance 1 - 8630
Support 2 - 8540
Resistance 2 - 8670
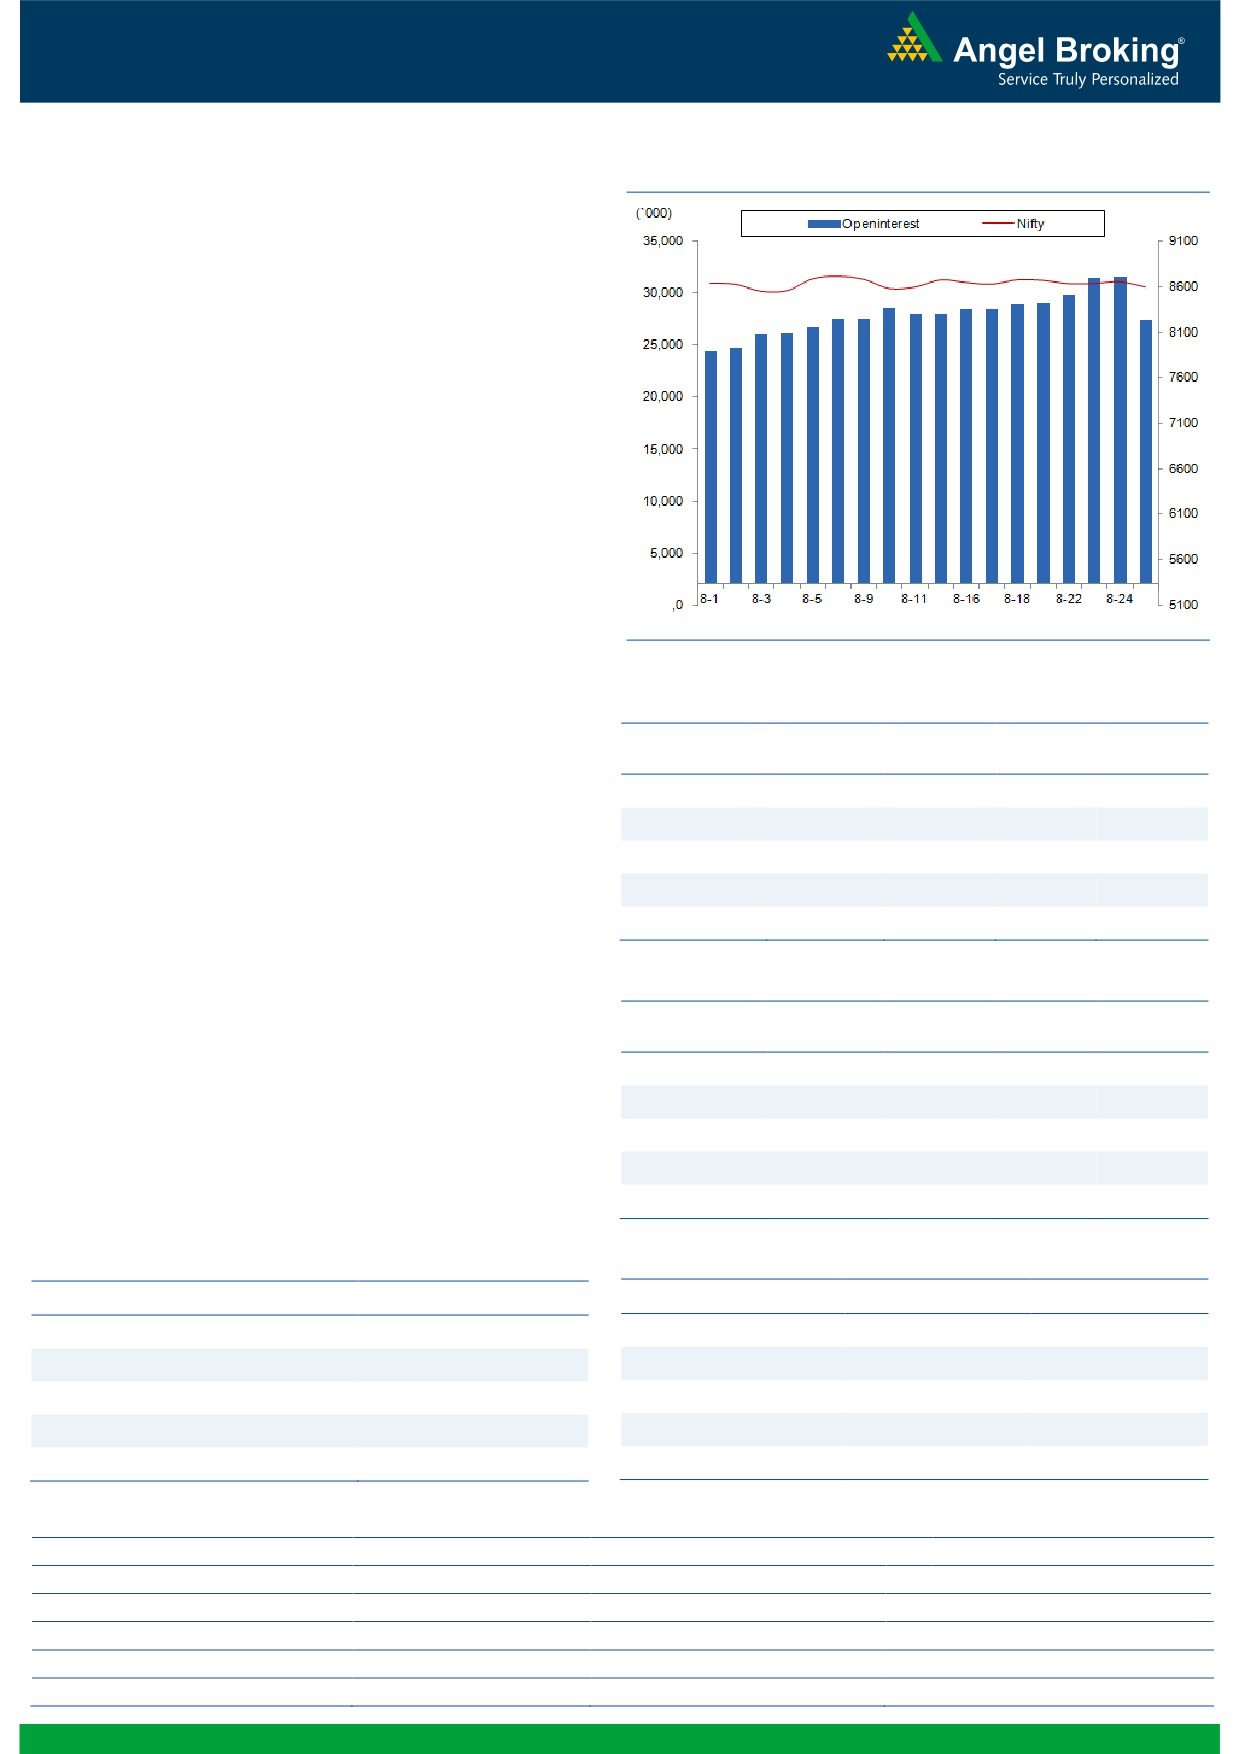
Nifty Bank Outlook - (19304)
Exhibit 2: Nifty Bank Daily Chart
In yesterday's trading session, the Nifty Bank index opened on a
flat note and traded in a narrow range to end the session with
minor loss of 0.27 percent over its previous session's close. The
last hour of trading, however, saw some corrective move in the
PSU Banking space and as the result, the Nifty PSU bank index
ended yesterday's session with loss of 1.26 percent.
In our last few reports, we have been highlighting about the
monthly 'SuperTrend' resistance of 19485 in the Nifty Bank index.
Since last five trading sessions, the index has consolidated and
has been unable to surpass the mentioned resistance. Thus, we
continue to advise traders to book profits on long positions in the
index and re-initate longs only above 19485 or on any corrective
decline. Meanwhile, traders can focus on stock specific trades
with proper risk management. The intraday support for the index
are placed around 19250 and 19127 whereas resistances are
seen around 19428 and 19485.
Key Levels
Support 1 - 19250
Resistance 1 - 19428
Support 2 - 19127
Resistance 2 - 19485
1
Technical & Derivatives Report
August 26, 2016
Comments
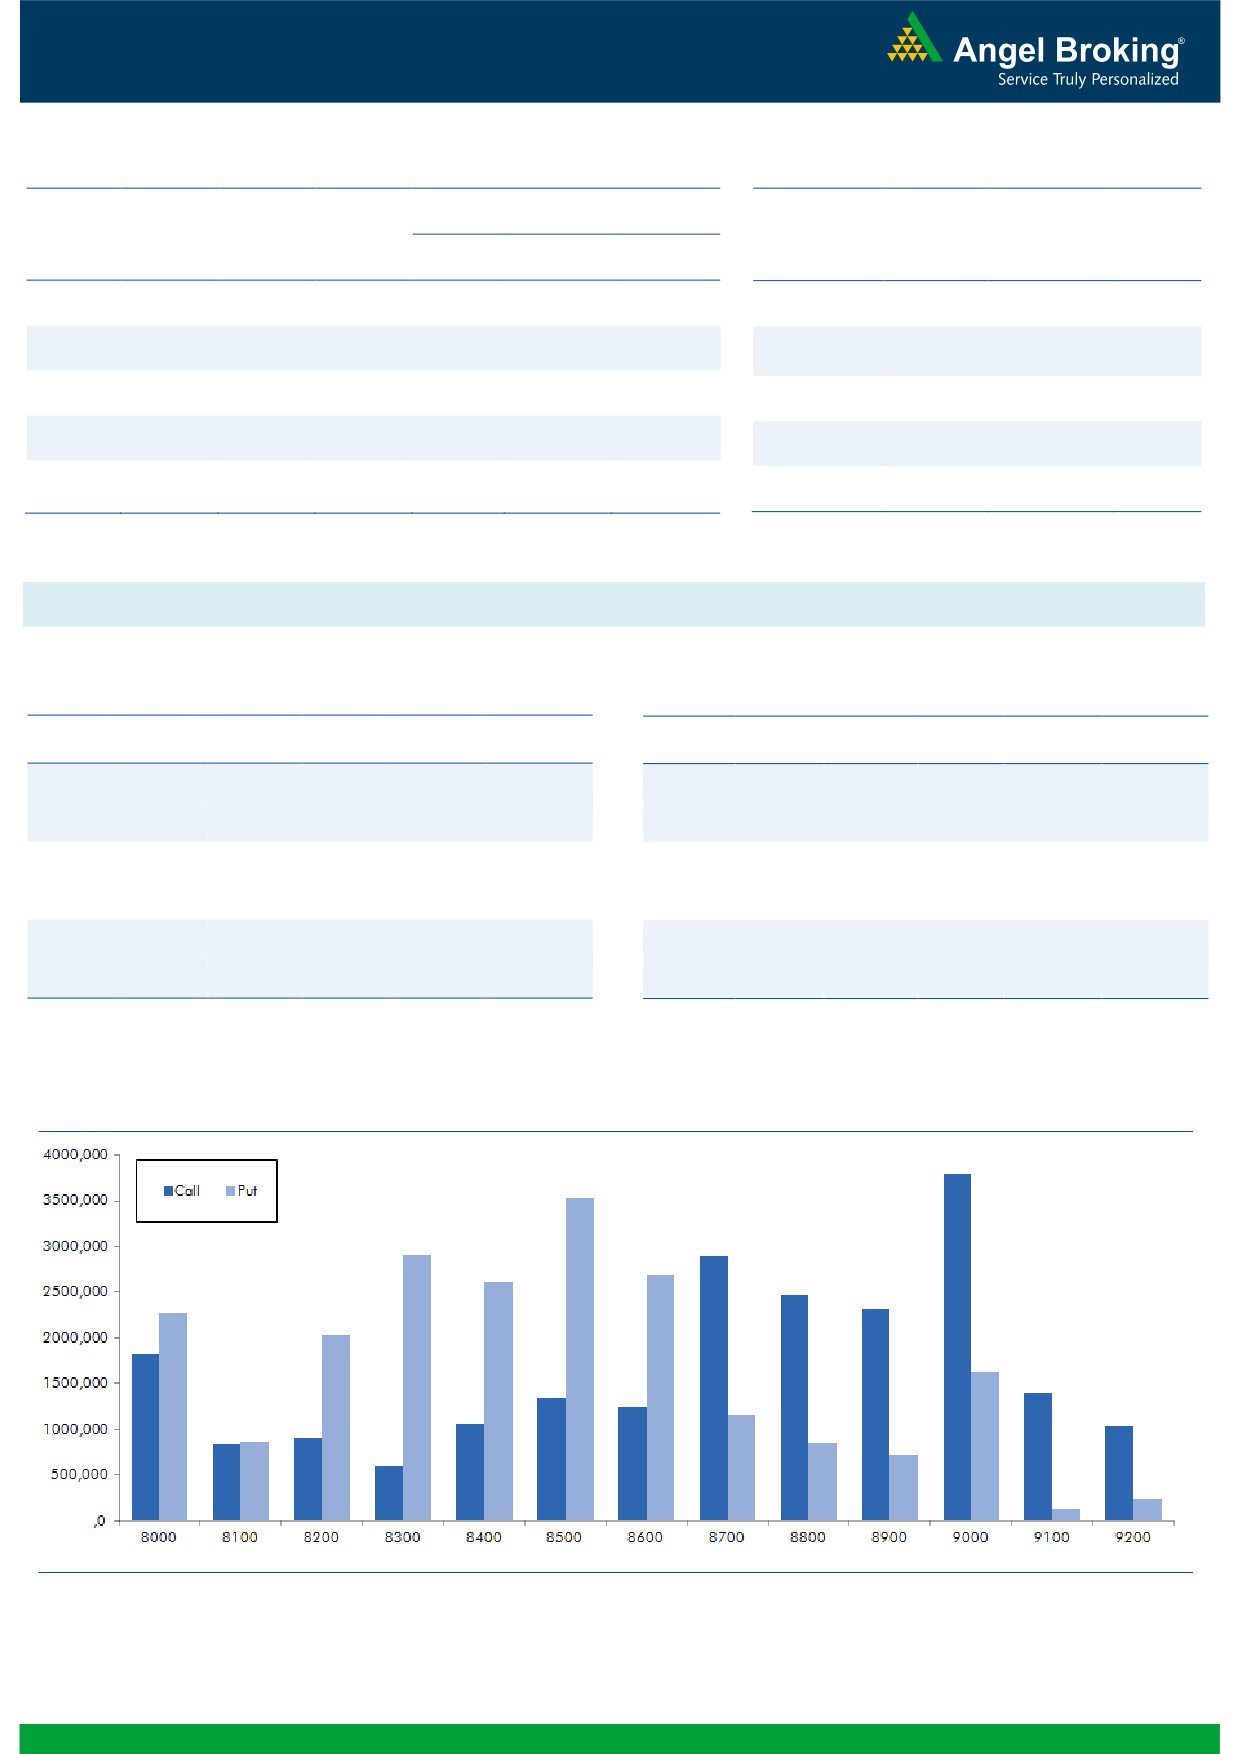
Nifty Vs OI
The Nifty futures open interest has decreased by 13.14%
BankNifty futures open interest has decreased by 28.32%
as market closed at 8592.20 levels.
The Nifty September future closed with a premium of
52.75 points against a premium of 52.45 points in
previous session. The October series closed at a
premium of 92.35 points.
The Implied Volatility of at the money options has
decreased from 13.20% to 12.03%.
The total OI of the market is Rs. 2,06,489/- cr. and the
stock futures OI is Rs. 73,200/- cr.
Few of the liquid counters where we have seen high cost
of carry are JPASSOCIAT, ADANIPOWER, JINDALSTEL,
IBREALEST and ULTRACEMCO.
Views
Yesterday, FIIs were net sellers in cash market segment to
the tune of Rs. 372 crores. While, in Index Futures they
OI Gainers
were net buyers worth Rs. 942 crores with significant fall
OI
PRICE
SCRIP
OI
PRICE
CHG. (%)
CHG. (%)
in OI, due to F&O expiry of August series.
TORNTPHARM
276000
17.15
1626.45
-4.89
On Index Options front, FIIs were net buyers of Rs. 107
PFC
12213000
11.38
239.30
-1.12
crores with fall in OI. In call options, 8700, 8900 and
9000 strikes added good amount of
fresh positions.
WOCKPHARMA
2940600
5.72
837.35
3.27
While in put options, OI addition was seen in 8300,
STAR
2444500
2.82
967.55
-0.38
8400 and 8600 strikes. Highest OI in September series is
TATAGLOBAL
29709000
1.99
141.75
0.07
visible in 9000 call and 8500 put options.
Yesterday, FIIs have squared off most of their short
OI Losers
positions in index future segment, which they formed in
OI
PRICE
SCRIP
OI
PRICE
last six sessions. Rollovers in Nifty and BankNifty are on
CHG. (%)
CHG. (%)
the higher side at 84.01% & 73.16% respectively. We
GODREJIND
1227000
-45.76
427.15
0.90
believe longs formed in last series are still intact.
VOLTAS
3334000
-39.80
381.65
-2.02
Currently, 8500-8550 will remain a crucial support for
CANBK
11994000
-39.39
266.20
-0.52
index. Since, derivative data and FIIs activity are showing
IDBI
36488000
-38.61
69.30
-2.74
strength in the market; traders are advised to trade with
MOTHERSUMI
7402500
-36.30
325.45
-0.55
positive bias and focus more on stock specific moves.
Historical Volatility
Put-Call Ratio
SCRIP
HV
SCRIP
PCR-OI
PCR-VOL
WIPRO
23.51
NIFTY
1.00
1.05
IDBI
38.22
BANKNIFTY
0.95
1.18
TORNTPHARM
52.05
SBIN
0.62
0.44
HEXAWARE
30.44
INFY
0.53
0.69
SINTEX
32.94
RELIANCE
0.61
0.50
Strategy Date
Symbol
Strategy
Status
01-08-2016
RELIANCE
Ratio Bear Put Spread
Active
08-08-2016
SBIN
Bull Call Spread
Active
2
Technical & Derivatives Report
August 26, 2016
FII Statistics for 25-August 2016
Turnover on 25-August 2016
Open Interest
No. of
Turnover
Change
Detail
Buy
Sell
Net
Instrument
Value
Contracts
( in Cr. )
(%)
Contracts
Change (%)
(in Cr.)
INDEX
INDEX
7135.85
6193.54
942.31
343897
22720.99
(19.31)
485228
33057.31
52.23
FUTURES
FUTURES
INDEX
INDEX
47416.84
47524.16
(107.32)
751220
48615.18
(34.54)
8423625
574158.02
64.97
OPTIONS
OPTIONS
STOCK
22084.09
23647.89
(1563.81)
799991
52381.40
(18.90)
STOCK
FUTURES
1543846
103248.98
28.40
FUTURES
STOCK
STOCK
2602.07
2497.24
104.82
2842
180.89
(97.22)
OPTIONS
468928
33026.46
7.98
OPTIONS
TOTAL
79238.84
79862.83
(623.99)
1897950
123898.46
(28.72)
TOTAL
10921627
743490.77
54.66
Nifty Spot = 8592.20
Lot Size = 75
Bull-Call Spreads
Bear-Put Spreads
Action
Strike
Price
Risk
Reward
BEP
Action
Strike
Price
Risk
Reward
BEP
Buy
8700
100.85
Buy
8600
108.05
40.85
59.15
8740.85
33.30
66.70
8566.70
Sell
8800
60.00
Sell
8500
74.75
Buy
8700
100.85
Buy
8600
108.05
68.20
131.80
8768.20
57.50
142.50
8542.50
Sell
8900
32.65
Sell
8400
50.55
Buy
8800
60.00
Buy
8500
74.75
27.35
72.65
8827.35
24.20
75.80
8475.80
Sell
8900
32.65
Sell
8400
50.55
Note: Above mentioned Bullish or Bearish Spreads in Nifty (September Series) are given as an information and not as a recommendation.
Nifty Put-Call Analysis
3
Technical & Derivatives Report
August 26, 2016
Daily Pivot Levels for Nifty Constituents
Scrips
S2
S1
PIVOT
R1
R2
ACC
1,626
1,636
1,651
1,661
1,676
ADANIPORTS
253
257
264
269
276
AMBUJACEM
258
262
266
269
274
ASIANPAINT
1,088
1,097
1,112
1,121
1,135
AUROPHARMA
777
784
794
800
811
AXISBANK
580
583
589
592
598
BAJAJ-AUTO
2,817
2,840
2,872
2,895
2,927
BANKBARODA
159
161
163
164
166
BHEL
134
137
140
143
145
BPCL
574
586
593
605
612
BHARTIARTL
338
342
348
352
358
INFRATEL
332
335
342
346
352
BOSCH
23,272
23,522
23,811
24,061
24,350
CIPLA
551
557
566
572
580
COALINDIA
325
328
332
336
340
DRREDDY
3,019
3,035
3,056
3,072
3,093
EICHERMOT
21,756
21,923
22,138
22,306
22,521
GAIL
360
367
371
377
381
GRASIM
4,447
4,488
4,556
4,597
4,666
HCLTECH
788
793
799
804
810
HDFCBANK
1,247
1,253
1,260
1,265
1,272
HDFC
1,329
1,343
1,367
1,381
1,404
HEROMOTOCO
3,264
3,284
3,307
3,328
3,351
HINDALCO
151
153
155
157
159
HINDUNILVR
899
905
913
919
928
ICICIBANK
244
245
248
249
252
IDEA
93
94
96
98
100
INDUSINDBK
1,166
1,174
1,186
1,195
1,207
INFY
1,016
1,026
1,042
1,052
1,067
ITC
248
251
253
256
258
KOTAKBANK
767
774
779
786
791
LT
1,430
1,442
1,463
1,475
1,496
LUPIN
1,494
1,508
1,521
1,535
1,549
M&M
1,385
1,400
1,422
1,437
1,459
MARUTI
4,864
4,899
4,941
4,976
5,017
NTPC
156
157
159
161
163
ONGC
233
236
239
241
245
POWERGRID
178
180
183
185
187
RELIANCE
997
1,005
1,017
1,025
1,037
SBIN
244
247
251
254
258
SUNPHARMA
753
759
768
774
783
TCS
2,492
2,521
2,556
2,585
2,619
TATAMTRDVR
314
316
321
323
328
TATAMOTORS
484
489
496
501
508
TATAPOWER
75
75
76
77
78
TATASTEEL
363
368
375
380
387
TECHM
447
452
462
467
477
ULTRACEMCO
3,708
3,749
3,797
3,837
3,885
WIPRO
490
497
509
516
528
YESBANK
1,331
1,337
1,343
1,350
1,356
ZEEL
496
504
515
522
533
4
Technical & Derivatives Report
August 26, 2016
Research Team Tel: 022 - 39357800
For Technical Queries
For Derivatives Queries
DISCLAIMER
Angel Broking Private Limited (hereinafter referred to as “Angel”) is a registered Member of National Stock Exchange of India Limited,
Bombay Stock Exchange Limited and Metropolitan Stock Exchange Limited. It is also registered as a Depository Participant with CDSL
and Portfolio Manager with SEBI. It also has registration with AMFI as a Mutual Fund Distributor. Angel Broking Private Limited is a
registered entity with SEBI for Research Analyst in terms of SEBI (Research Analyst) Regulations, 2014 vide registration number
INH000000164. Angel or its associates has not been debarred/ suspended by SEBI or any other regulatory authority for accessing
/dealing in securities Market. Angel or its associates/analyst has not received any compensation / managed or co-managed public
offering of securities of the company covered by Analyst during the past twelve months.
This document is solely for the personal information of the recipient, and must not be singularly used as the basis of any investment
decision. Nothing in this document should be construed as investment or financial advice. Each recipient of this document should
make such investigations as they deem necessary to arrive at an independent evaluation of an investment in the securities of the
companies referred to in this document (including the merits and risks involved), and should consult their own advisors to determine
the merits and risks of such an investment.
Reports based on technical and derivative analysis center on studying charts of a stock's price movement, outstanding positions and
trading volume, as opposed to focusing on a company's fundamentals and, as such, may not match with a report on a company's
fundamentals. Investors are advised to refer the Fundamental and Technical Research Reports available on our website to evaluate the
contrary view, if any.
The information in this document has been printed on the basis of publicly available information, internal data and other reliable
sources believed to be true, but we do not represent that it is accurate or complete and it should not be relied on as such, as this
document is for general guidance only. Angel Broking Pvt. Limited or any of its affiliates/ group companies shall not be in any way
responsible for any loss or damage that may arise to any person from any inadvertent error in the information contained in this report.
Angel Broking Pvt. Limited has not independently verified all the information contained within this document. Accordingly, we cannot
testify, nor make any representation or warranty, express or implied, to the accuracy, contents or data contained within this document.
While Angel Broking Pvt. Limited endeavors to update on a reasonable basis the information discussed in this material, there may be
regulatory, compliance, or other reasons that prevent us from doing so.
This document is being supplied to you solely for your information, and its contents, information or data may not be reproduced,
redistributed or passed on, directly or indirectly.
Neither Angel Broking Pvt. Limited, nor its directors, employees or affiliates shall be liable for any loss or damage that may arise from
or in connection with the use of this information.
5