Technical & Derivatives Report
October 25, 2016
Sensex (28179) / Nifty (8709)
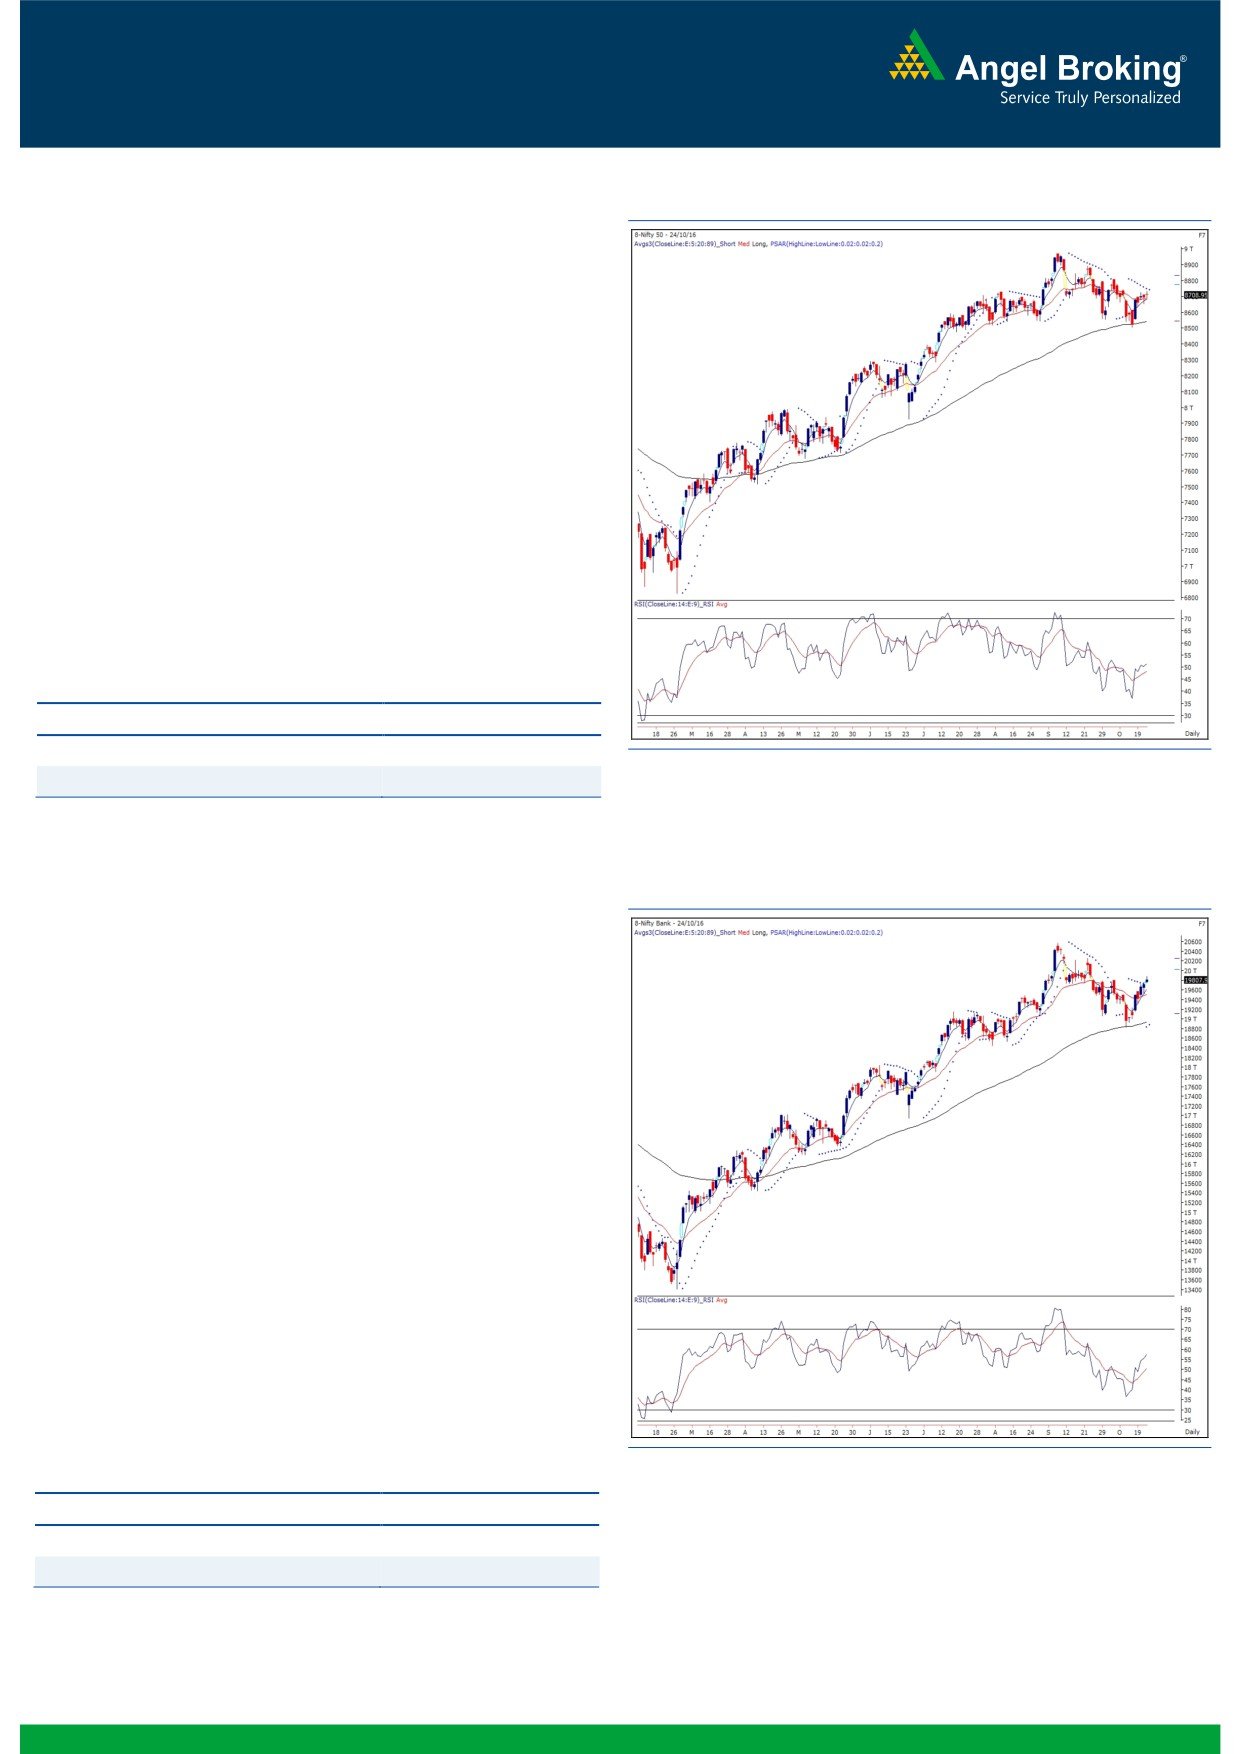
Exhibit 1: Nifty Daily Chart
Yesterday, our benchmark index opened with a marginal upside
gap owing to positive cues from the Asian cues. Subsequently, we
witnessed a small extension of this up move in the first half.
However, post the mid session, we witnessed a lack of activity
from the bulls which eventually resulted in a minor correction to
close with negligible gains.
Due to very narrow trading range, the chart structure remains the
same and so as our view. Hence, unless the index closes above
8745, we would continue to advise traders to stay on sidelines. In
case of a failure to cross the resistance, we can expect another leg
of corrective move towards 8630 and 8540. However, a firm
close above 8745 would negate our recent cautious stance on the
market and then it would compel us to reassess the situation in
order to provide a near term outlook.
Key Levels
Support 1 - 8668
Resistance 1 - 8745
Support 2 - 8630
Resistance 2 - 8785
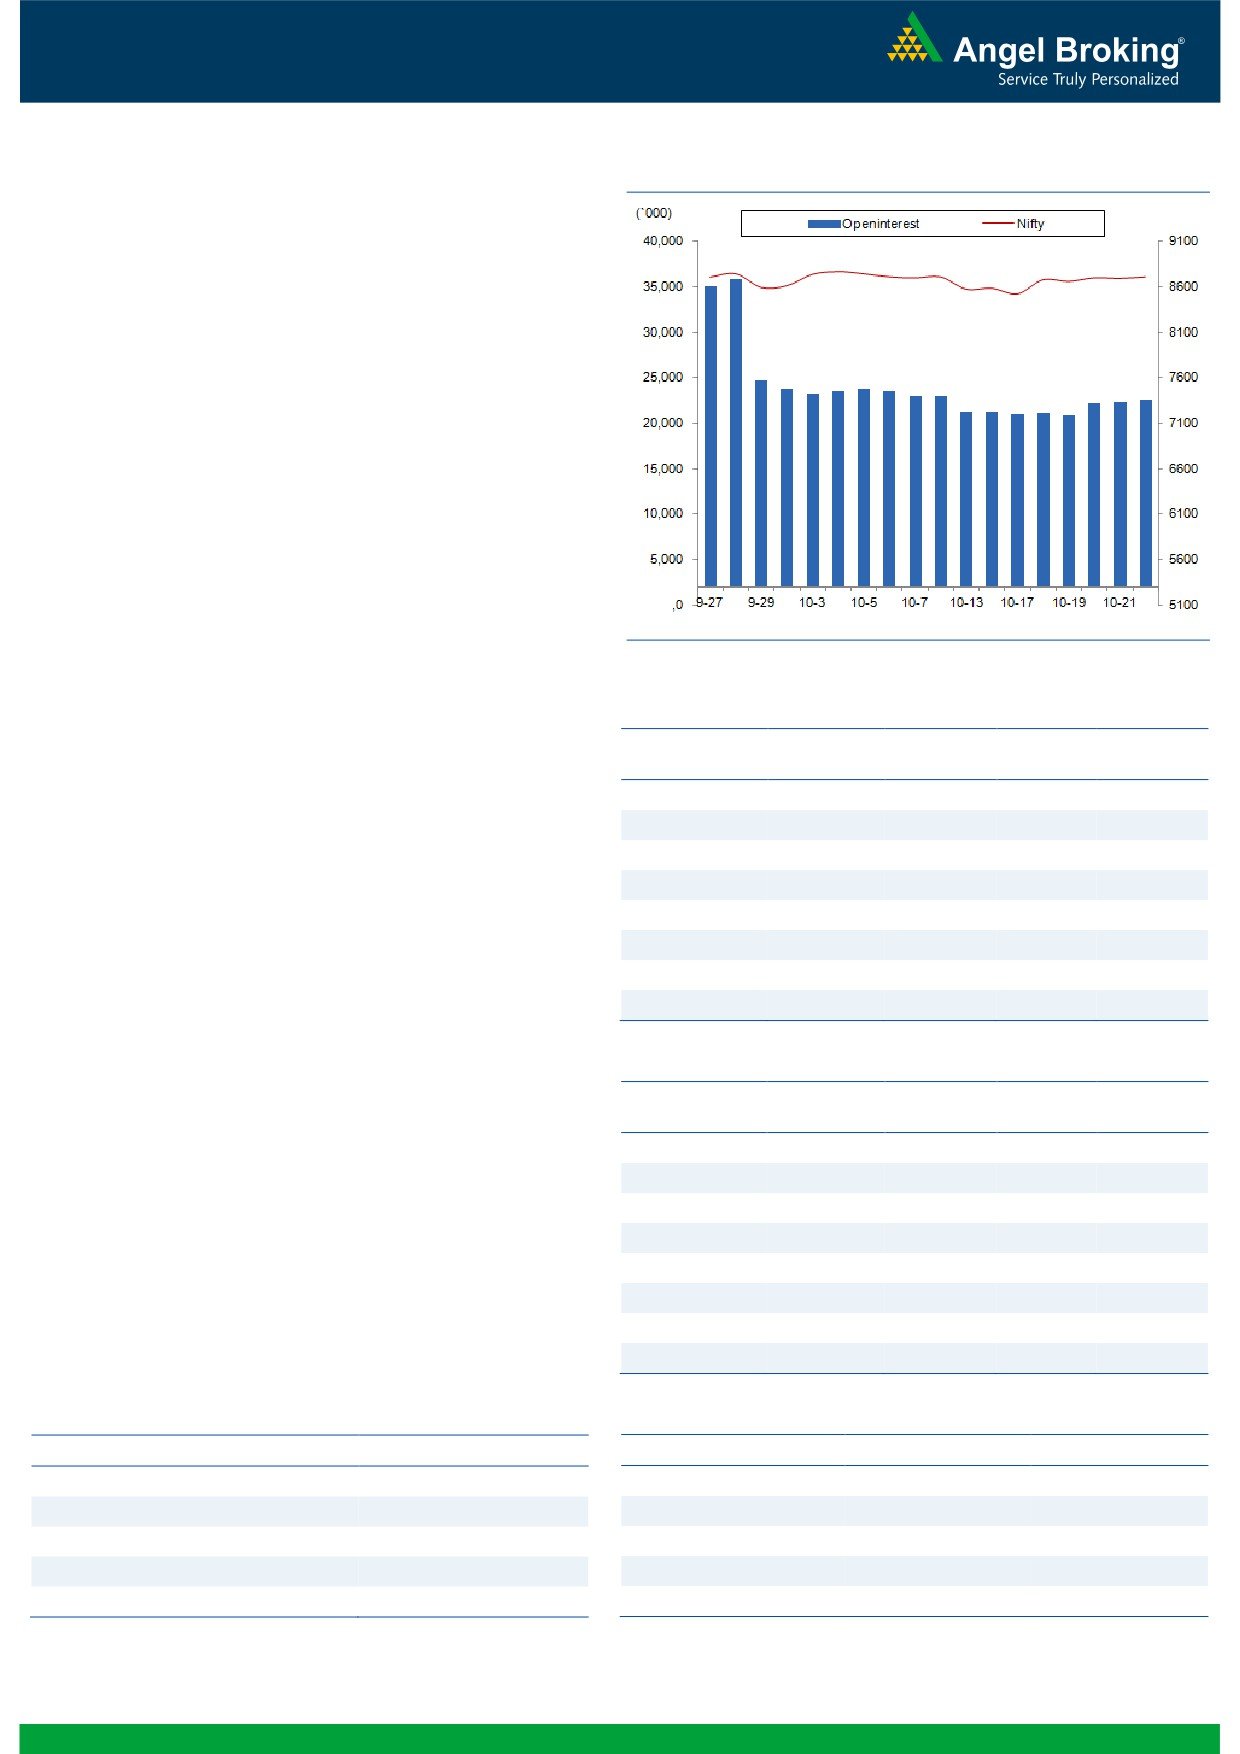
Exhibit 2: Nifty Bank Daily Chart
Nifty Bank Outlook - (19808)
The Nifty Bank index opened gap up yesterday and rallied higher
to test the resistance zone around
19900 which is
61.8%
retracement resistance of the recent corrective move. Post testing
the mentioned resistance, the index retraced back marginally,
however, managed to close the session with gains of
0.49
percent.
As highlighted above, the Nifty Bank index has retraced 61.8
percent of the recent corrective move from 20573 to 18821.
However, the index has managed to cross the previous swing
high of 19817 and the broader market remains to be positive.
Thus, a sustained move above 19900 will indicate a continuation
of the up move. However, we would advise traders to take a
stock-specific approach here within the index as there is no
favorable trade set up in the index at the current juncture. The
intraday supports for the Nifty index are placed around 19744
and 19632 whereas resistances are seen around 19905 and
20140.
Key Levels
Support 1 - 19744
Resistance 1 - 19905
Support 2 - 19632
Resistance 2 - 20140
1
Technical & Derivatives Report
October 25, 2016
Comments
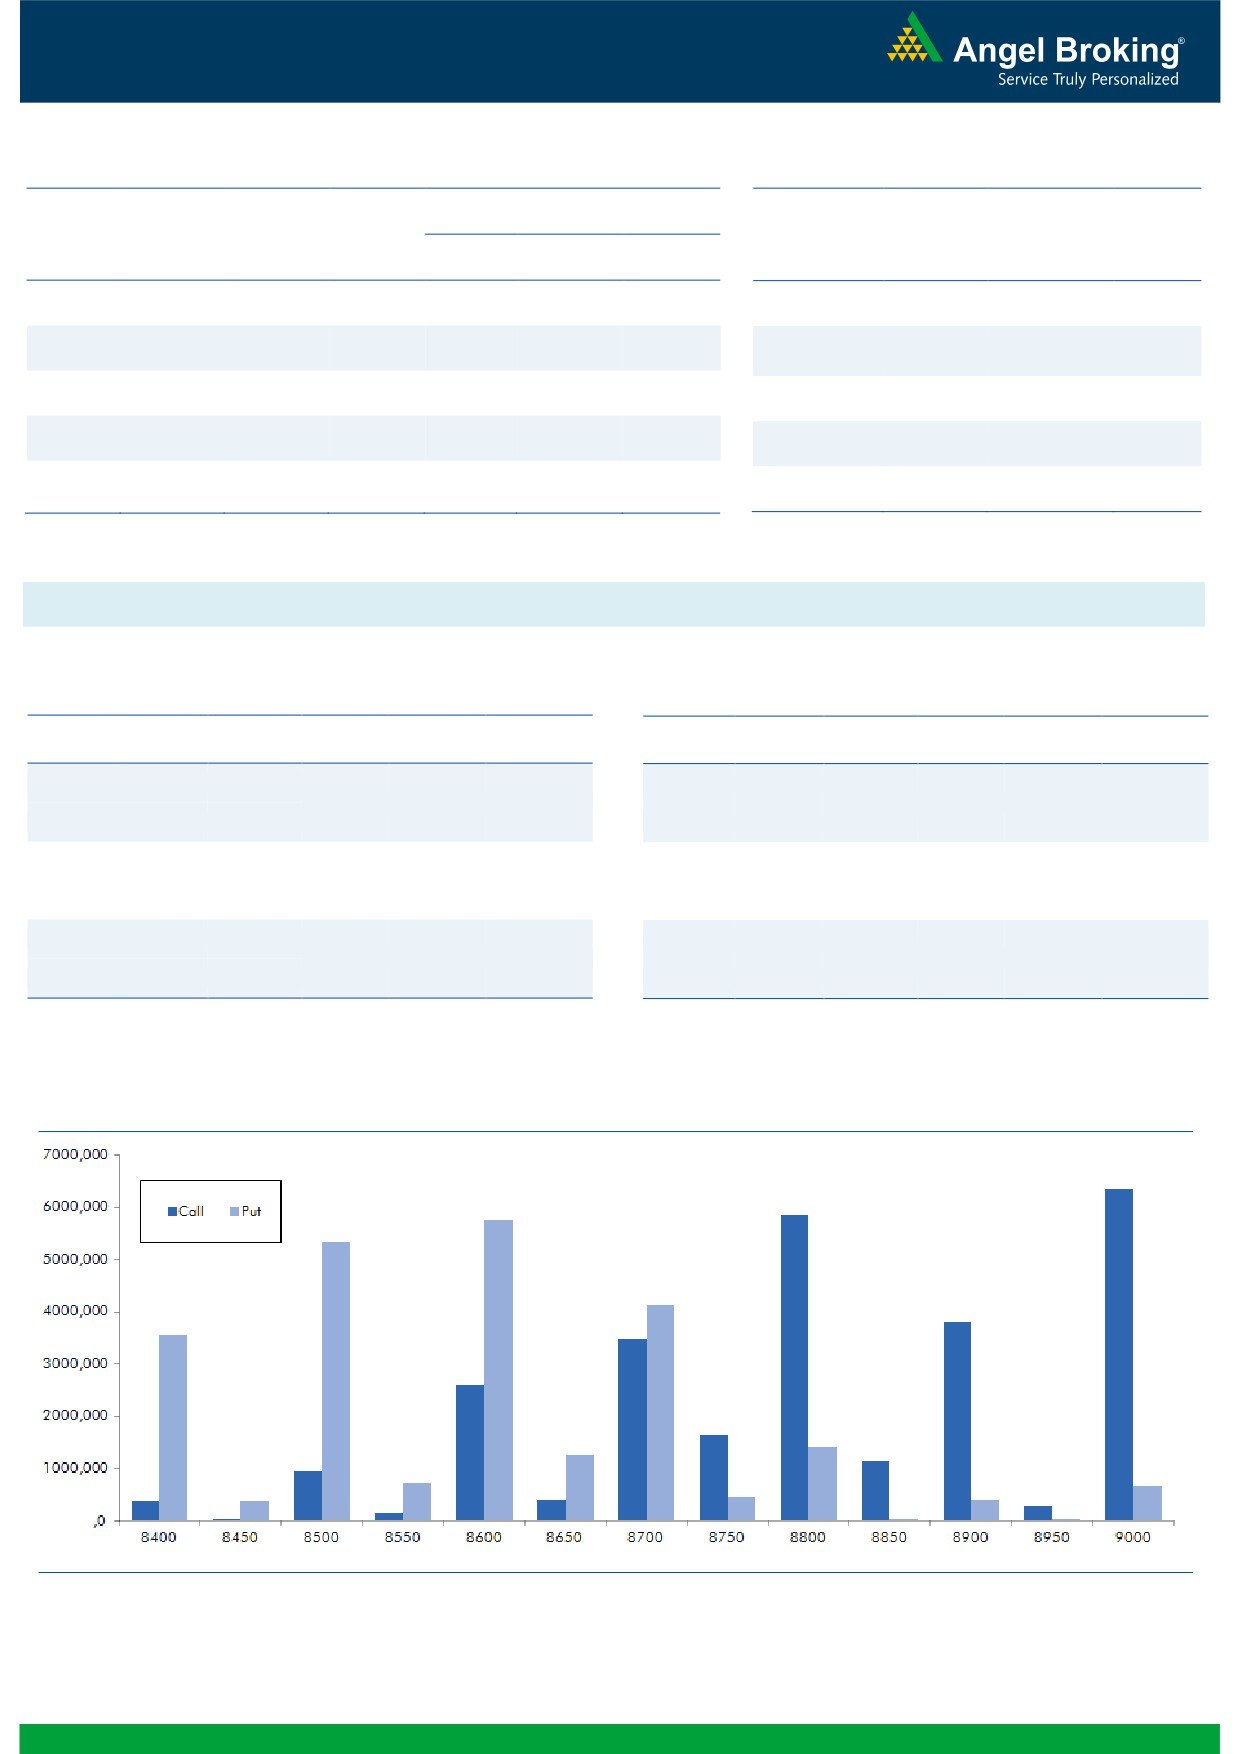
Nifty Vs OI
The Nifty futures open interest has increased by 1.62%
BankNifty futures open interest has increased by 5.94%
as market closed at 8708.95 levels.
The Nifty October future closed with a premium of 11.30
against the premium of 7.30 points in last trading
session. The November series closed at a premium of
53.75 points.
The Implied Volatility of at the money options has
increased from 12.28% to 14.15%. At the same time, the
PCR-OI of Nifty has remained unchanged 1.00 levels.
The total OI of the market is Rs. 2,94,723/- cr. and the
stock futures OI is Rs. 85,336/- cr.
Few of the liquid counters where we have seen high cost
of carry are JINDALSTEl, IDEA, SYNDIBANK,
JPASSOCIAT and CEATLTD.
Views
OI Gainers
Yesterday, FIIs were net sellers in cash market segment to
OI
PRICE
SCRIP
OI
PRICE
CHG. (%)
CHG. (%)
the tune of Rs. 325 crores. While, in index futures, they
KTKBANK
19735500
25.45
128.65
2.27
bought worth Rs. 155 crores with significant rise in open
JSWSTEEL
6994800
20.50
1710.85
-1.41
interest, indicating formation of both long and short
CEATLTD
1601600
17.03
1273.40
-3.46
positions in previous trading session. www.angelbroking.com
UNIONBANK
15816000
15.89
148.40
0.64
On Index Options front, FIIs bought of worth
OIL
1776500
15.73
418.75
0.81
Rs. 804 crores with some rise in OI. In call options, 8750
ORIENTBANK
16026000
15.18
138.25
4.58
- 8800 strikes were active and added good amount of
ONGC
23460000
14.29
292.60
4.31
fresh positions; followed by some unwinding 8600 and
ASIANPAINT
4888800
14.09
1131.30
-2.20
8700 strikes. On the other hand, in put options, except
OI addition in 8700 strike, none of other strikes added
meaningful positions. Maximum OI in October series is
OI Losers
placed at 9000 call and 8600 put option.
OI
PRICE
SCRIP
OI
PRICE
CHG. (%)
CHG. (%)
Despite the long liquidation and fresh shorting seen in
HINDZINC
8515200
-8.56
252.95
1.10
index future by FIIs in last week, Nifty has shown some
TORNTPHARM
370400
-7.77
1611.45
1.63
sign of strength. But, overall data doesn’t support the
COLPAL
1838200
-5.51
965.95
0.88
ongoing up move. Before forming any directional view in
CROMPGREAV
12660000
-5.38
76.75
0.00
the index, we would like to wait for any significant
AMARAJABAT
625200
-5.27
1040.95
1.18
directional positions by FIIs. Thus, at current juncture, we
BANKINDIA
29226000
-4.53
114.60
1.28
advise traders to avoid forming any aggressive
directional trade in Nifty for October expiry.
KSCL
2646000
-4.34
442.00
0.83
TVSMOTOR
6876000
-4.29
394.50
-0.39
Historical Volatility
Put-Call Ratio
SCRIP
HV
SCRIP
PCR-OI
PCR-VOL
WIPRO
26.46
NIFTY
1.00
0.96
MINDTREE
38.81
BANKNIFTY
1.14
1.03
COALINDIA
20.56
RELIANCE
0.33
0.35
ONGC
37.07
INFY
0.53
0.50
APOLLOHOSP
29.88
ICICIBANK
1.12
0.64
2
Technical & Derivatives Report
October 25, 2016
FII Statistics for 24, October 2016
Turnover on 24, October 2016
Open Interest
No. of
Turnover
Change
Detail
Buy
Sell
Net
Instrument
Value
Change
Contracts
( in Cr. )
(%)
Contracts
(in Cr.)
(%)
INDEX
INDEX
3132.96
2978.23
154.73
273803
18500.38
5.89
226563
15761.91
22.35
FUTURES
FUTURES
INDEX
INDEX
32146.67
31343.15
803.52
1154365
77242.37
1.28
3837474
266997.38
13.51
OPTIONS
OPTIONS
STOCK
17558.47
17893.18
(334.71)
920537
62005.97
2.92
STOCK
FUTURES
897467
63650.50
42.31
FUTURES
STOCK
STOCK
4812.97
4857.96
(44.98)
124127
8509.16
0.61
OPTIONS
411533
30094.03
-10.58
OPTIONS
TOTAL
57651.07
57072.51
578.56
2472832
166257.88
2.35
TOTAL
5373037
376503.82
15.32
Nifty Spot = 8708.95
Lot Size = 75
Bull-Call Spreads
Bear-Put Spreads
Action
Strike
Price
Risk
Reward
BEP
Action
Strike
Price
Risk
Reward
BEP
Buy
8700
57.15
Buy
8700
38.40
40.95
59.05
8740.95
24.25
75.75
8675.75
Sell
8800
16.20
Sell
8600
14.15
Buy
8700
57.15
Buy
8700
38.40
53.80
146.20
8753.80
32.90
167.10
8667.10
Sell
8900
3.35
Sell
8500
5.50
Buy
8800
16.20
Buy
8600
14.15
12.85
87.15
8812.85
8.65
91.35
8591.35
Sell
8900
3.35
Sell
8500
5.50
Note: Above mentioned Bullish or Bearish Spreads in Nifty (October Series) are given as an information and not as a recommendation.
Nifty Put-Call Analysis
3
Technical & Derivatives Report
October 25, 2016
Daily Pivot Levels for Nifty Constituents
Scrips
S2
S1
PIVOT
R1
R2
ACC
1,533
1,549
1,568
1,585
1,603
ADANIPORTS
276
281
288
293
300
AMBUJACEM
244
246
248
249
251
ASIANPAINT
1,100
1,114
1,138
1,152
1,176
AUROPHARMA
808
813
820
825
831
AXISBANK
511
516
523
529
535
BAJAJ-AUTO
2,767
2,779
2,797
2,808
2,826
BANKBARODA
154
156
158
160
162
BHEL
140
141
142
142
143
BPCL
660
673
680
694
701
BHARTIARTL
302
304
306
309
310
INFRATEL
357
363
370
376
382
BOSCH
22,253
22,594
22,847
23,189
23,441
CIPLA
575
580
587
592
599
COALINDIA
309
315
319
325
329
DRREDDY
3,038
3,063
3,098
3,124
3,158
EICHERMOT
24,530
24,722
25,022
25,215
25,515
GAIL
436
440
446
449
455
GRASIM
959
966
971
978
984
HCLTECH
790
801
819
829
847
HDFCBANK
1,251
1,257
1,267
1,273
1,283
HDFC
1,325
1,335
1,342
1,352
1,359
HEROMOTOCO
3,304
3,319
3,346
3,361
3,387
HINDALCO
149
150
151
153
154
HINDUNILVR
838
843
849
854
860
ICICIBANK
276
280
283
288
291
IDEA
74
76
77
79
81
INDUSINDBK
1,206
1,211
1,218
1,223
1,229
INFY
1,015
1,021
1,032
1,038
1,049
ITC
239
240
241
242
243
KOTAKBANK
773
780
785
792
797
LT
1,467
1,480
1,500
1,513
1,533
LUPIN
1,482
1,505
1,522
1,546
1,563
M&M
1,311
1,325
1,334
1,348
1,357
MARUTI
5,627
5,671
5,709
5,753
5,791
NTPC
149
150
151
152
153
ONGC
273
283
288
298
303
POWERGRID
173
175
177
178
180
RELIANCE
1,053
1,058
1,066
1,071
1,079
SBIN
257
260
262
265
268
SUNPHARMA
740
744
749
752
757
TCS
2,389
2,409
2,422
2,441
2,454
TATAMTRDVR
354
359
362
366
369
TATAMOTORS
535
548
556
568
576
TATAPOWER
83
83
84
84
85
TATASTEEL
421
424
427
430
434
TECHM
421
425
432
436
443
ULTRACEMCO
3,927
3,949
3,983
4,006
4,040
WIPRO
471
478
484
490
496
YESBANK
1,293
1,302
1,315
1,324
1,337
ZEEL
501
507
516
521
531
4
Technical & Derivatives Report
October 25, 2016
Research Team Tel: 022 - 39357800
For Technical Queries
For Derivatives Queries
DISCLAIMER
Angel Broking Private Limited (hereinafter referred to as “Angel”) is a registered Member of National Stock Exchange of India Limited,
Bombay Stock Exchange Limited and Metropolitan Stock Exchange Limited. It is also registered as a Depository Participant with CDSL
and Portfolio Manager with SEBI. It also has registration with AMFI as a Mutual Fund Distributor. Angel Broking Private Limited is a
registered entity with SEBI for Research Analyst in terms of SEBI (Research Analyst) Regulations, 2014 vide registration number
INH000000164. Angel or its associates has not been debarred/ suspended by SEBI or any other regulatory authority for accessing
/dealing in securities Market. Angel or its associates/analyst has not received any compensation / managed or co-managed public
offering of securities of the company covered by Analyst during the past twelve months.
This document is solely for the personal information of the recipient, and must not be singularly used as the basis of any investment
decision. Nothing in this document should be construed as investment or financial advice. Each recipient of this document should
make such investigations as they deem necessary to arrive at an independent evaluation of an investment in the securities of the
companies referred to in this document (including the merits and risks involved), and should consult their own advisors to determine
the merits and risks of such an investment.
Reports based on technical and derivative analysis center on studying charts of a stock's price movement, outstanding positions and
trading volume, as opposed to focusing on a company's fundamentals and, as such, may not match with a report on a company's
fundamentals. Investors are advised to refer the Fundamental and Technical Research Reports available on our website to evaluate the
contrary view, if any.
The information in this document has been printed on the basis of publicly available information, internal data and other reliable
sources believed to be true, but we do not represent that it is accurate or complete and it should not be relied on as such, as this
document is for general guidance only. Angel Broking Pvt. Limited or any of its affiliates/ group companies shall not be in any way
responsible for any loss or damage that may arise to any person from any inadvertent error in the information contained in this report.
Angel Broking Pvt. Limited has not independently verified all the information contained within this document. Accordingly, we cannot
testify, nor make any representation or warranty, express or implied, to the accuracy, contents or data contained within this document.
While Angel Broking Pvt. Limited endeavors to update on a reasonable basis the information discussed in this material, there may be
regulatory, compliance, or other reasons that prevent us from doing so.
This document is being supplied to you solely for your information, and its contents, information or data may not be reproduced,
redistributed or passed on, directly or indirectly.
Neither Angel Broking Pvt. Limited, nor its directors, employees or affiliates shall be liable for any loss or damage that may arise from
or in connection with the use of this information.
5