Technical & Derivatives Report
December 24, 2015
Sensex (25850) / Nifty (7866)
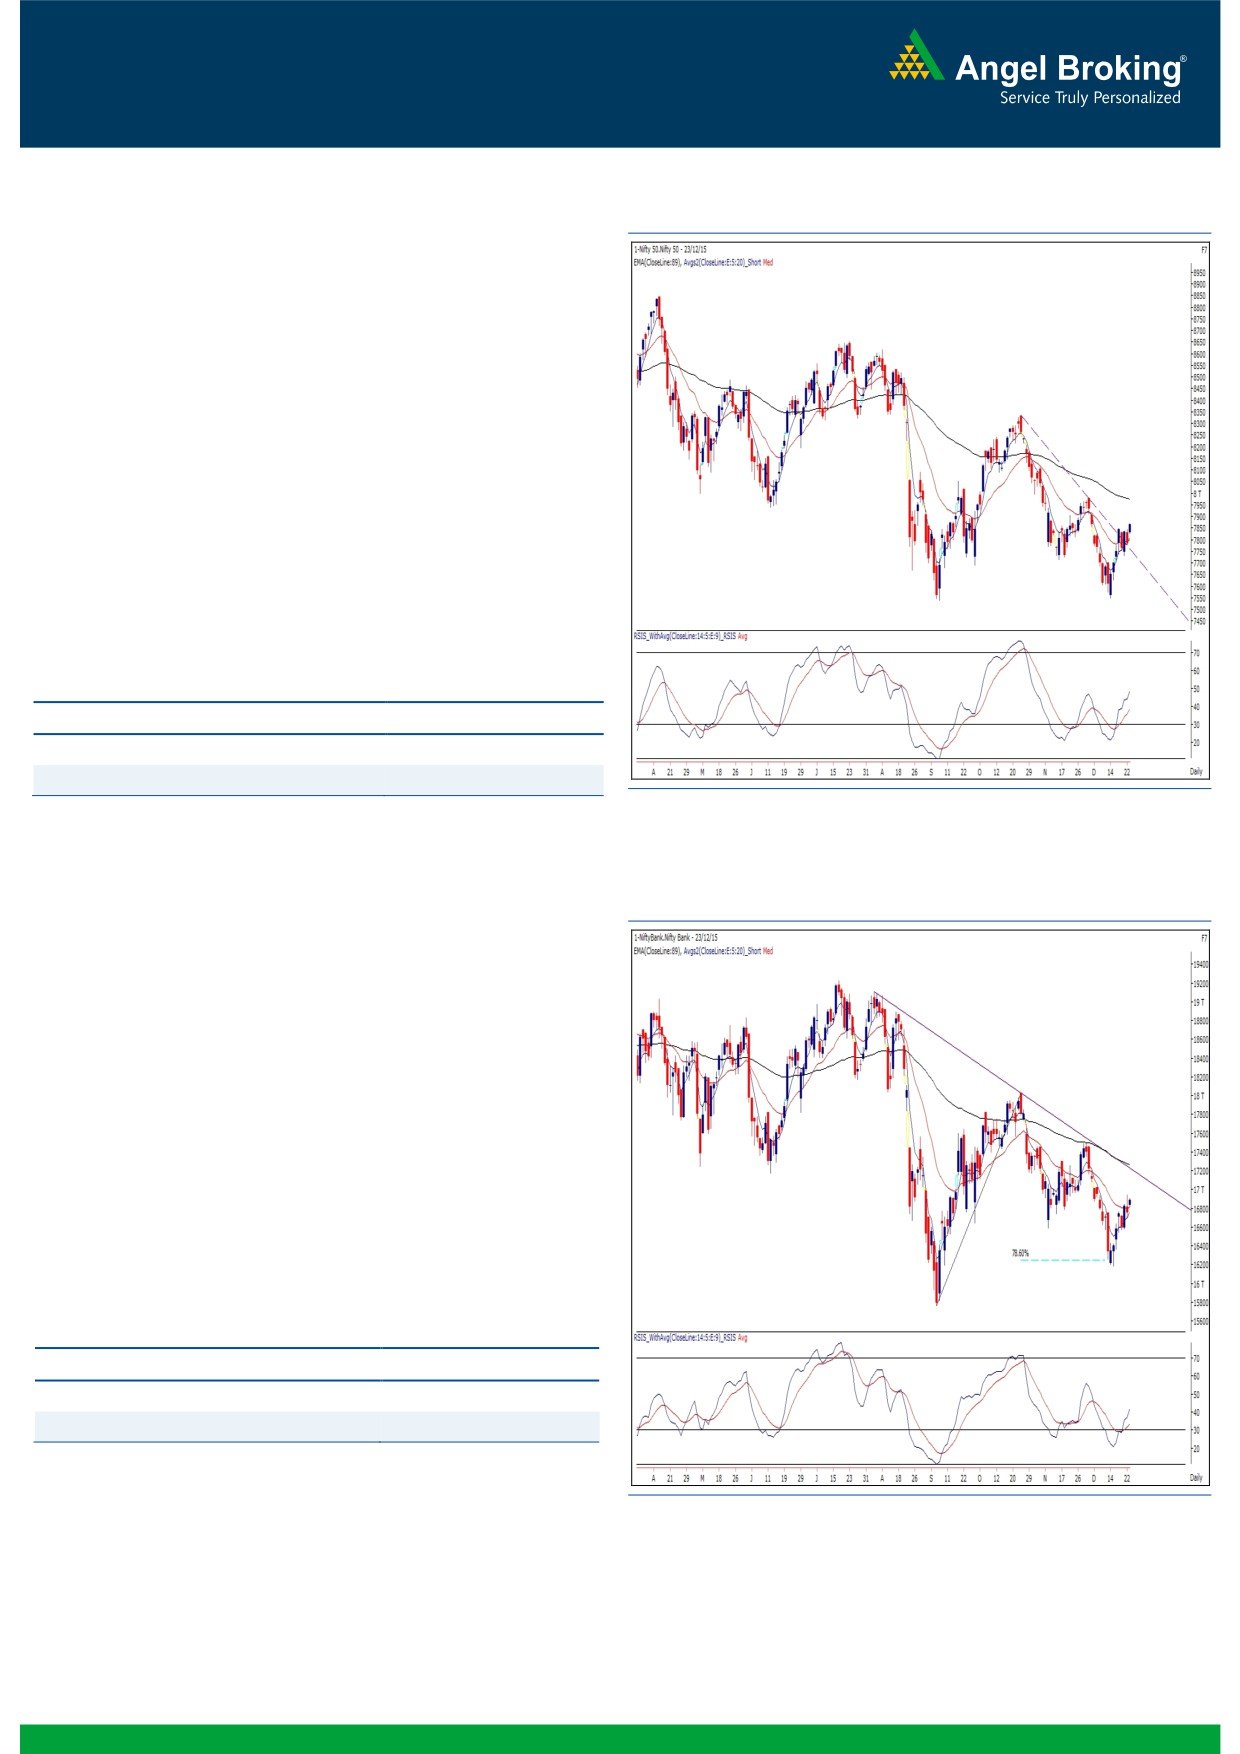
Exhibit 1: Nifty Daily Chart
Yesterday, our markets opened with a decent upside gap
owing to positive cues from the global bourses. The index then
went on to break the recent hurdle of 7852.90 in the initial
hour. Ideally, such price development should have followed by
a good upward momentum; which was clearly missing
throughout the remaining part of the day. Despite this the
bulls managed to hold the 7850 mark on a closing basis by
posting a percent gains.
The hourly chart now depicts a ‘Higher Top Higher Bottom’
formation; indicating strength. Considering yesterday’s close
well inside the positive territory, we are expecting Nifty to
continue its upmove towards next resistance zone of 7920 -
7970. On the flipside, 7776 - 7733 levels are now likely to
provide a strong support for our market.
Key Levels
Support 1 - 7776
Resistance 1 - 7920
Support 2 - 7733
Resistance 2 - 7970
Exhibit 2: Bank Nifty Daily Chart
Bank Nifty Outlook - (16883)
Yesterday, the Bank Nifty too opened with the upside gap of
around half a percent and started moving higher in the first
half of the session. However, the momentum was clearly
missing in the latter half as the banking index traded in the
sideways direction after mid-session. Unlike benchmark
indices, the Bank Nifty failed to move above Tuesday’s high
and ended the session with the gains of 0.80 percent. The
overall trading remained in the narrow range of 100 points.
Going forward, the short term base for Bank Nifty is intact at
16580 - 16540 levels; while, the resistance is also intact at
17030 - 17100 zone. Traders are advised to trade with the
trend and avoid prem-empting tops at current juncture.
Key Levels
Support 1 - 16700
Resistance 1 - 17030
Support 2 - 16580
Resistance 2 - 17100
1
Technical & Derivatives Report
December 24, 2015
Comments
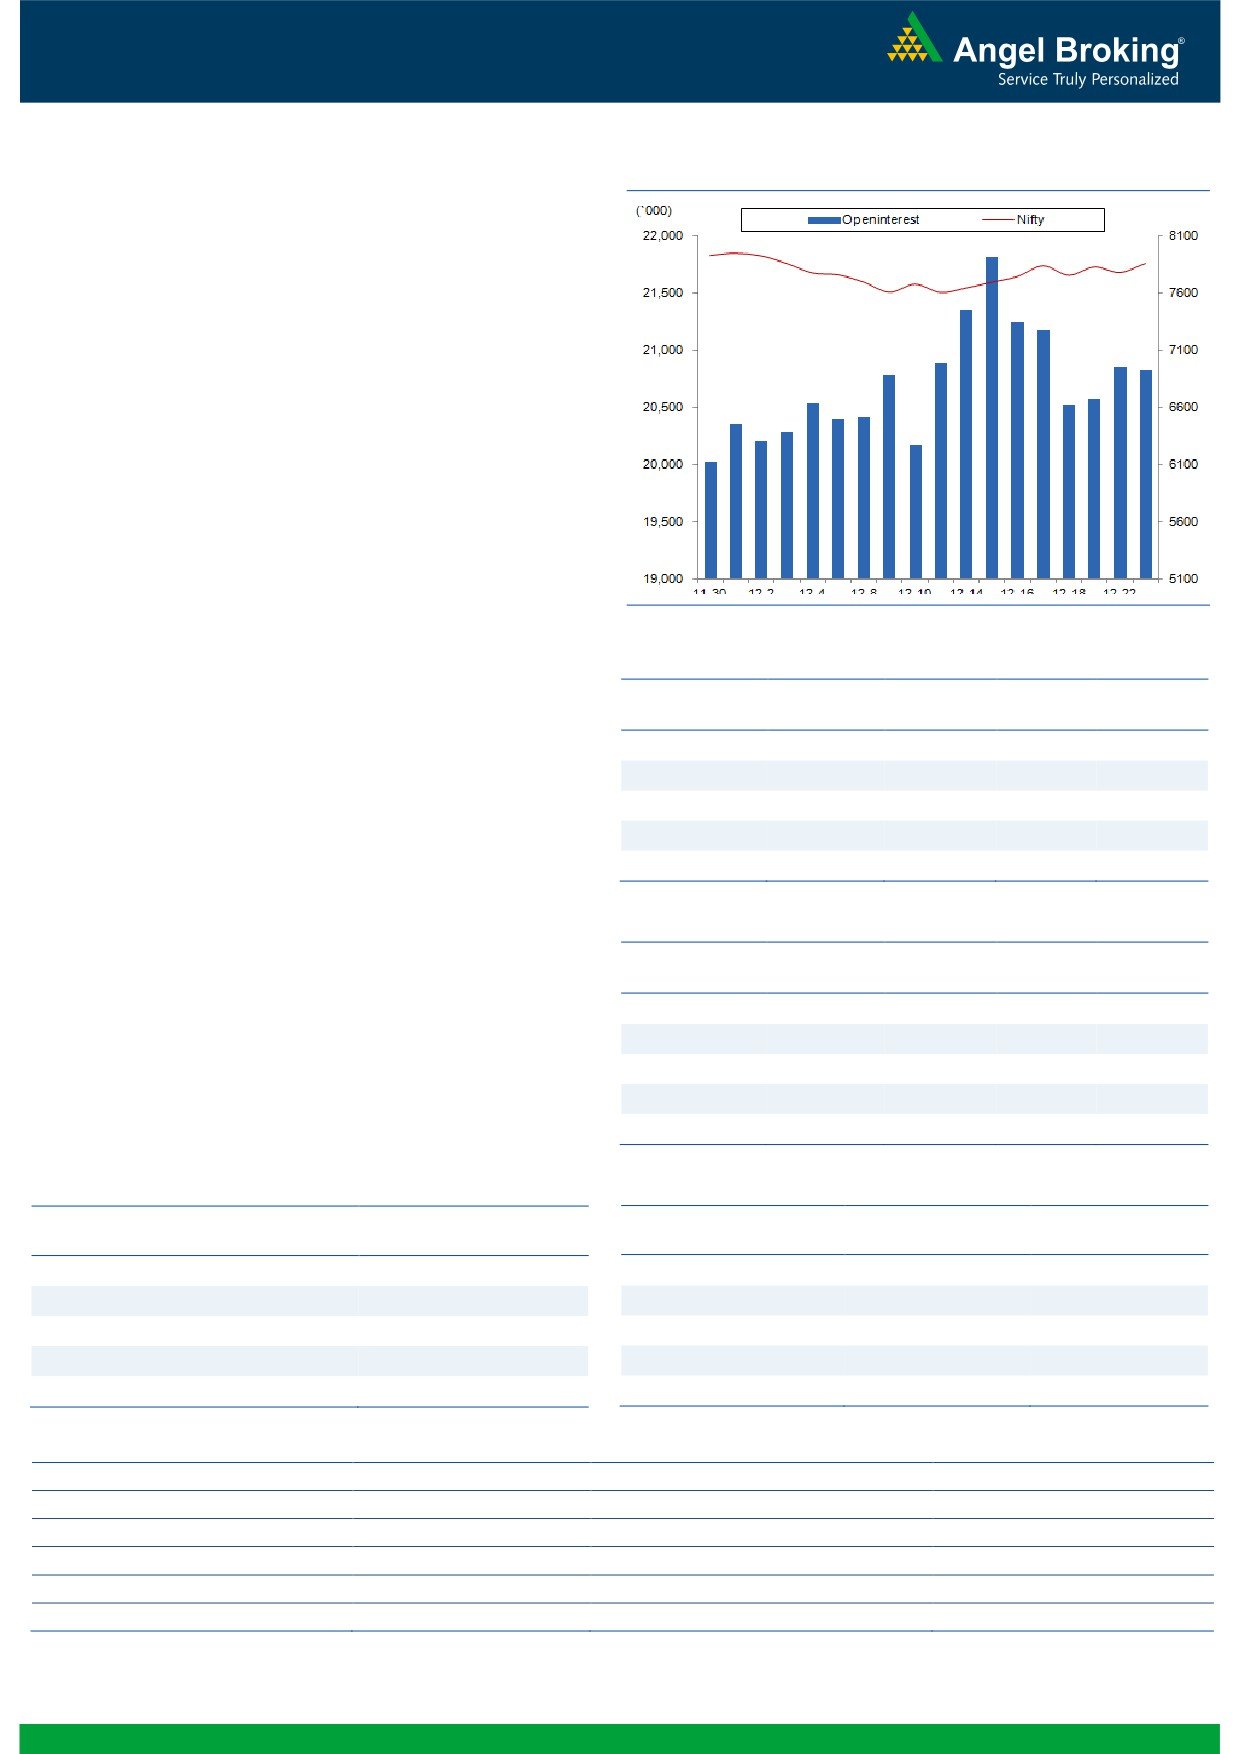
Nifty Vs OI
The Nifty futures open interest has decreased by 0.12%
BankNifty futures open interest has decreased by 1.09%
as market closed at 7865.95 levels.
The Nifty December future closed at a discount of 1.95
points against a discount of 1.00 points. The January
series closed at a premium of 28.15 points.
The Implied Volatility of at the money options has
decreased from 11.34% to 10.54 %.
The total OI of the market is Rs. 2,50,891/- cr. and the
stock futures OI is Rs. 69,301/- cr.
Few of the liquid counters where we have seen high cost
of carry are UNITECH, JINDALSTEL, HAVELLS, SUNTV
and JPASSOCIAT.
Views
OI Gainers
OI
PRICE
FIIs were net buyers in cash market segment, they bought
SCRIP
OI
PRICE
CHG. (%)
CHG. (%)
to the tune of Rs. 386 crores. While in Index Futures, they
PIDILITIND
934000
21.30
551.00
1.71
bought of worth Rs. 556 crores with fall in open interest,
KSCL
4144500
18.86
340.15
-2.47
indicating short covering in last trading session.
DLF
58560000
15.96
116.45
2.33
In Index Options front, FIIs sold of worth Rs. 152 crores
MCLEODRUSS
3803800
14.81
172.55
-1.82
with some rise in open interest. In call options, we hardly
INFRATEL
2323100
12.67
417.70
4.01
saw any strike adding meaningful OI; good amount of
unwinding was visible in 7800 call options. While in put
OI Losers
options, 7800 strike added good amount of build-up.
OI
PRICE
IV’s of puts plunged
100 bps which means short
SCRIP
OI
PRICE
CHG. (%)
CHG. (%)
positions were formed in 7800 put. Maximum build-up in
IOB
11928000
-12.44
31.00
1.97
current series in seen in 8000 call and 7500 put options.
TATAGLOBAL
25916000
-4.01
142.35
0.64
We believe one should trade with a positive bias in Nifty,
ONGC
18366000
-3.86
235.25
2.11
till we don’t see any selling in Index Futures by FIIs.
HINDZINC
2006400
-3.83
147.15
1.45
UNITECH
242704000
-3.34
6.85
1.48
Historical Volatility
Put-Call Ratio
SCRIP
HV
SCRIP
PCR-OI
PCR-VOL
GAIL
48.18
NIFTY
0.83
0.97
AUROPHARMA
29.71
BANKNIFTY
0.92
0.88
BHEL
33.59
SBIN
0.53
0.35
HINDALCO
50.69
RELIANCE
0.83
0.64
TATACHEM
29.25
LT
0.48
0.27
Strategy Date
Symbol
Strategy
Status
November 30, 2015
LT
Long Put
Profit Booked on Dec 11, 2015
December 07, 2015
BANKNIFTY
Raito Bear Put Spread
Active
December 14, 2015
HINDALCO
Long Call
Profit Booked on Dec 23, 2015
December 21, 2015
RELIANCE
Raito Bull Call Spread
Active
2
Technical & Derivatives Report
December 24, 2015
FII Statistics for 23-December 2015
Turnover on 23-December 2015
Open Interest
No. of
Turnover
Change
Detail
Buy
Sell
Net
Instrument
Value
Change
Contracts
( in Cr. )
(%)
Contracts
(in Cr.)
(%)
INDEX
INDEX
2513.54
1957.57
555.97
246986
14150.56
(1.88)
237525
13411.33
-4.29
FUTURES
FUTURES
INDEX
INDEX
16733.99
16885.82
(151.83)
1267919
74052.88
0.75
3057707
177878.12
10.16
OPTIONS
OPTIONS
STOCK
4838.73
4588.86
249.87
1086276
54101.37
1.30
STOCK
FUTURES
513172
25772.93
11.77
FUTURES
STOCK
STOCK
1502.36
1536.84
(34.48)
86765
4255.93
(1.67)
OPTIONS
244914
12487.23
7.55
OPTIONS
TOTAL
25588.62
24969.10
619.52
2687946
146560.74
0.64
TOTAL
4053318
229549.61
9.23
Nifty Spot = 7865.95
Lot Size = 25
Bull-Call Spreads
Bear-Put Spreads
Action
Strike
Price
Risk
Reward
BEP
Action
Strike
Price
Risk
Reward
BEP
Buy
7900
32.95
Buy
7800
25.30
23.20
76.80
7923.20
16.25
83.75
7783.75
Sell
8000
9.75
Sell
7700
9.05
Buy
7900
32.95
Buy
7800
25.30
29.75
170.25
7929.75
21.20
178.80
7778.80
Sell
8100
3.20
Sell
7600
4.10
Buy
8000
9.75
Buy
7700
9.05
6.55
93.45
8006.55
4.95
95.05
7695.05
Sell
8100
3.20
Sell
7600
4.10
Note: Above mentioned Bullish or Bearish Spreads in Nifty (Dec. Series) are given as an information and not as a recommendation.
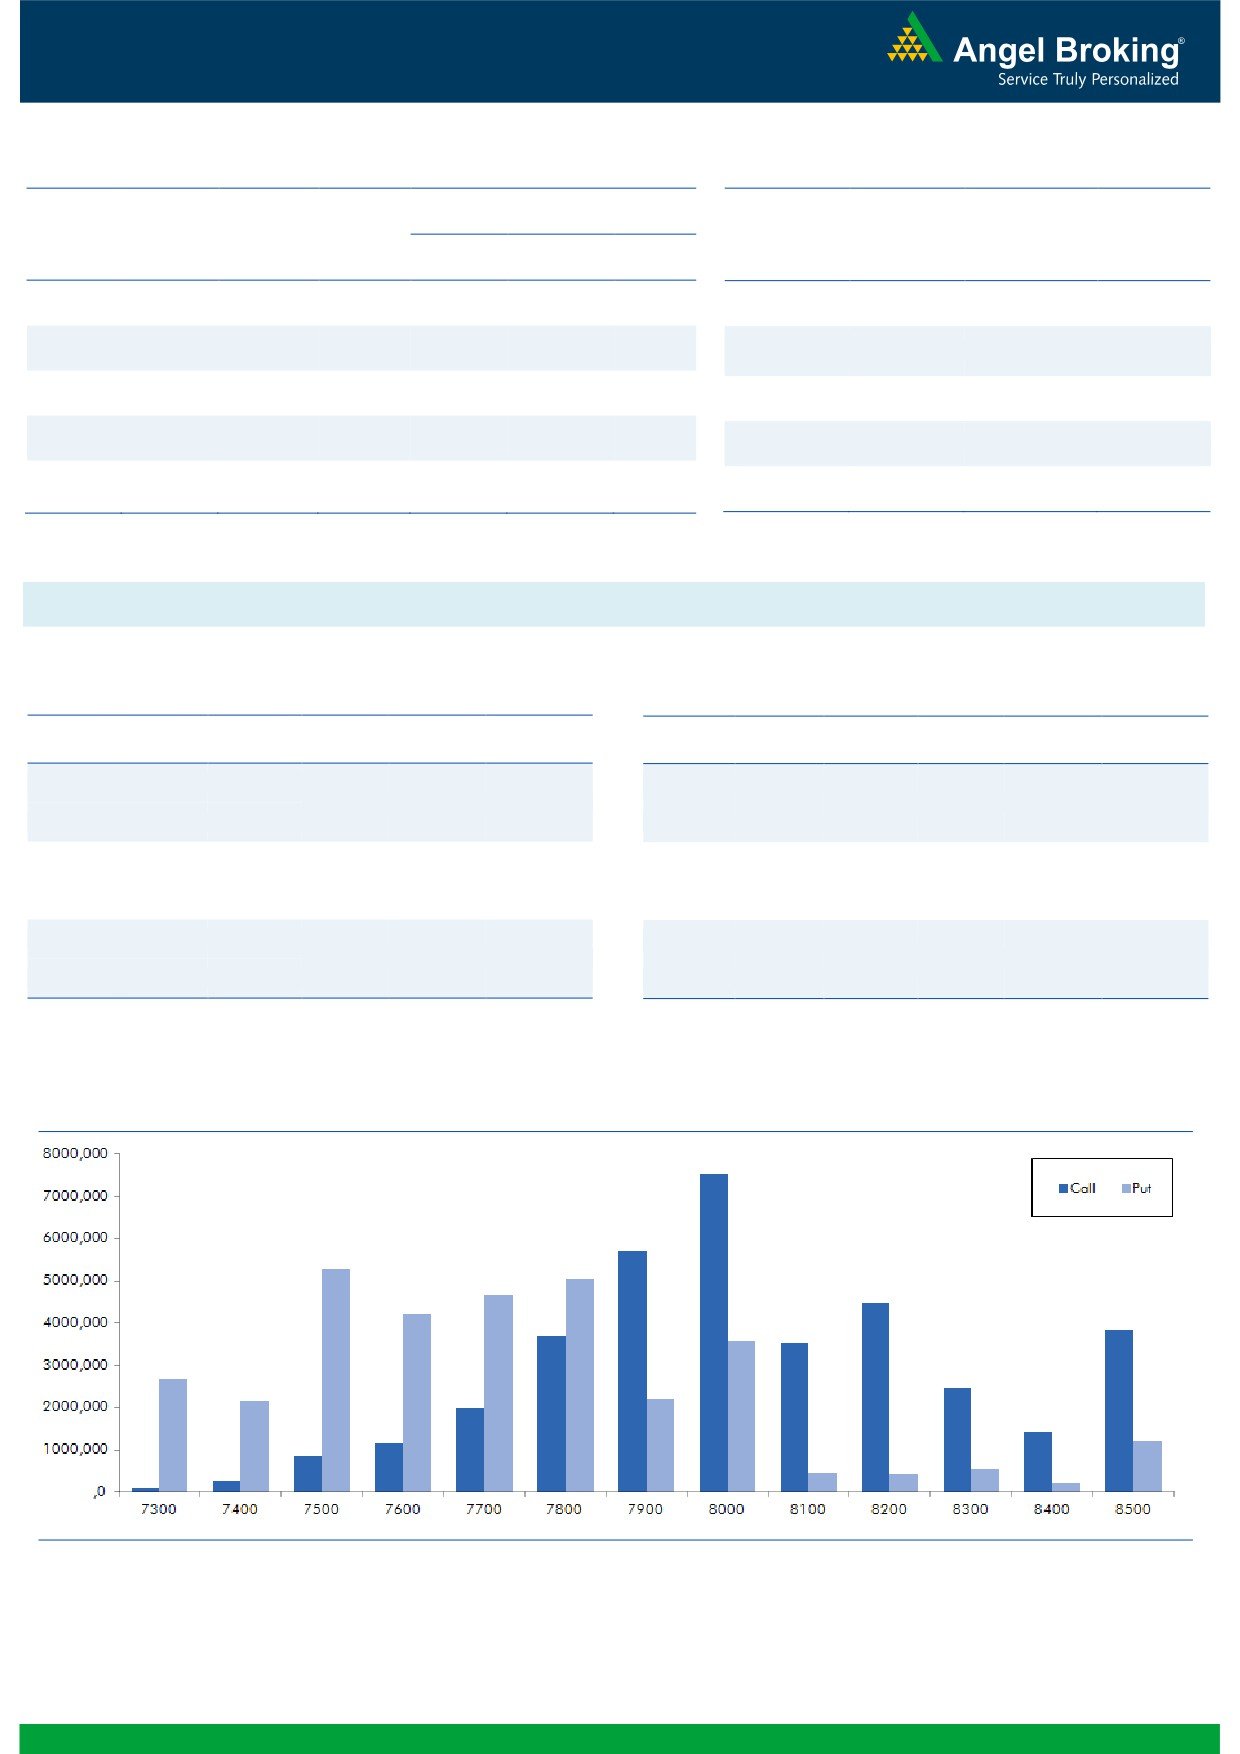
Nifty Put-Call Analysis
3
Technical & Derivatives Report
December 24, 2015
Daily Pivot Levels for Nifty 50 Stocks
Scrips
S2
S1
PIVOT
R1
R2
ACC
1,325
1,333
1,347
1,355
1,369
ADANIPORTS
253
255
258
260
262
AMBUJACEM
200
201
201
202
202
ASIANPAINT
870
874
879
884
888
AXISBANK
446
449
451
454
455
BAJAJ-AUTO
2,447
2,460
2,482
2,495
2,516
BANKBARODA
157
158
158
159
160
BHARTIARTL
321
327
330
335
338
BHEL
165
168
171
174
177
BOSCHLTD
18,043
18,130
18,215
18,302
18,386
BPCL
893
897
902
906
912
CAIRN
133
134
135
136
137
CIPLA
642
645
647
650
652
COALINDIA
318
320
322
324
326
DRREDDY
3,001
3,013
3,022
3,034
3,043
GAIL
335
347
354
365
372
GRASIM
3,706
3,723
3,737
3,753
3,768
HCLTECH
844
854
860
870
876
HDFC
1,227
1,233
1,238
1,244
1,248
HDFCBANK
1,065
1,070
1,074
1,078
1,083
HEROMOTOCO
2,650
2,664
2,679
2,694
2,709
HINDALCO
79
81
83
85
87
HINDUNILVR
849
856
863
870
878
ICICIBANK
257
260
261
264
265
IDEA
138
139
140
141
142
INDUSINDBK
932
936
940
944
949
INFY
1,081
1,091
1,097
1,107
1,112
ITC
318
320
322
324
326
KOTAKBANK
693
698
701
706
710
LT
1,275
1,283
1,291
1,299
1,307
LUPIN
1,782
1,794
1,803
1,815
1,824
M&M
1,233
1,243
1,256
1,266
1,279
MARUTI
4,601
4,618
4,637
4,654
4,673
NTPC
136
138
139
140
141
ONGC
229
232
234
238
240
PNB
120
120
121
122
122
POWERGRID
138
139
140
141
141
RELIANCE
983
994
1,000
1,010
1,017
SBIN
228
229
230
231
232
VEDL
86
88
89
90
91
SUNPHARMA
761
776
785
799
808
TATAMOTORS
376
377
379
380
382
TATAPOWER
65
65
66
66
67
TATASTEEL
260
262
264
266
269
TCS
2,399
2,413
2,424
2,437
2,448
TECHM
511
515
520
523
528
ULTRACEMCO
2,789
2,804
2,816
2,831
2,843
WIPRO
551
554
557
560
563
YESBANK
715
720
723
728
731
ZEEL
412
415
418
422
424
4
Technical & Derivatives Report
December 24, 2015
Research Team Tel: 022 - 39357800
For Technical Queries
For Derivatives Queries
DISCLAIMER
Angel Broking Private Limited (hereinafter referred to as “Angel”) is a registered Member of National Stock Exchange of India Limited,
Bombay Stock Exchange Limited and MCX Stock Exchange Limited. It is also registered as a Depository Participant with CDSL and
Portfolio Manager with SEBI. It also has registration with AMFI as a Mutual Fund Distributor. Angel Broking Private Limited is a
registered entity with SEBI for Research Analyst in terms of SEBI (Research Analyst) Regulations, 2014 vide registration number
INH000000164. Angel or its associates has not been debarred/ suspended by SEBI or any other regulatory authority for accessing
/dealing in securities Market. Angel or its associates including its relatives/analyst do not hold any financial interest/beneficial
ownership of more than 1% in the company covered by Analyst. Angel or its associates/analyst has not received any compensation /
managed or co-managed public offering of securities of the company covered by Analyst during the past twelve months. Angel/analyst
has not served as an officer, director or employee of company covered by Analyst and has not been engaged in market making activity
of the company covered by Analyst.
This document is solely for the personal information of the recipient, and must not be singularly used as the basis of any investment
decision. Nothing in this document should be construed as investment or financial advice. Each recipient of this document should
make such investigations as they deem necessary to arrive at an independent evaluation of an investment in the securities of the
companies referred to in this document (including the merits and risks involved), and should consult their own advisors to determine
the merits and risks of such an investment.
Reports based on technical and derivative analysis center on studying charts of a stock's price movement, outstanding positions and
trading volume, as opposed to focusing on a company's fundamentals and, as such, may not match with a report on a company's
fundamentals.
The information in this document has been printed on the basis of publicly available information, internal data and other reliable
sources believed to be true, but we do not represent that it is accurate or complete and it should not be relied on as such, as this
document is for general guidance only. Angel Broking Pvt. Limited or any of its affiliates/ group companies shall not be in any way
responsible for any loss or damage that may arise to any person from any inadvertent error in the information contained in this report.
Angel Broking Pvt. Limited has not independently verified all the information contained within this document. Accordingly, we cannot
testify, nor make any representation or warranty, express or implied, to the accuracy, contents or data contained within this document.
While Angel Broking Pvt. Limited endeavors to update on a reasonable basis the information discussed in this material, there may be
regulatory, compliance, or other reasons that prevent us from doing so.
This document is being supplied to you solely for your information, and its contents, information or data may not be reproduced,
redistributed or passed on, directly or indirectly.
Neither Angel Broking Pvt. Limited, nor its directors, employees or affiliates shall be liable for any loss or damage that may arise from
or in connection with the use of this information.
Note: Please refer to the important ‘Stock Holding Disclosure' report on the Angel website (Research Section). Also, please refer to the
latest update on respective stocks for the disclosure status in respect of those stocks. Angel Broking Pvt. Limited and its affiliates may
have investment positions in the stocks recommended in this report.
5