Technical & Derivatives Report
November 24, 2016
Sensex (26052) / Nifty (8033)
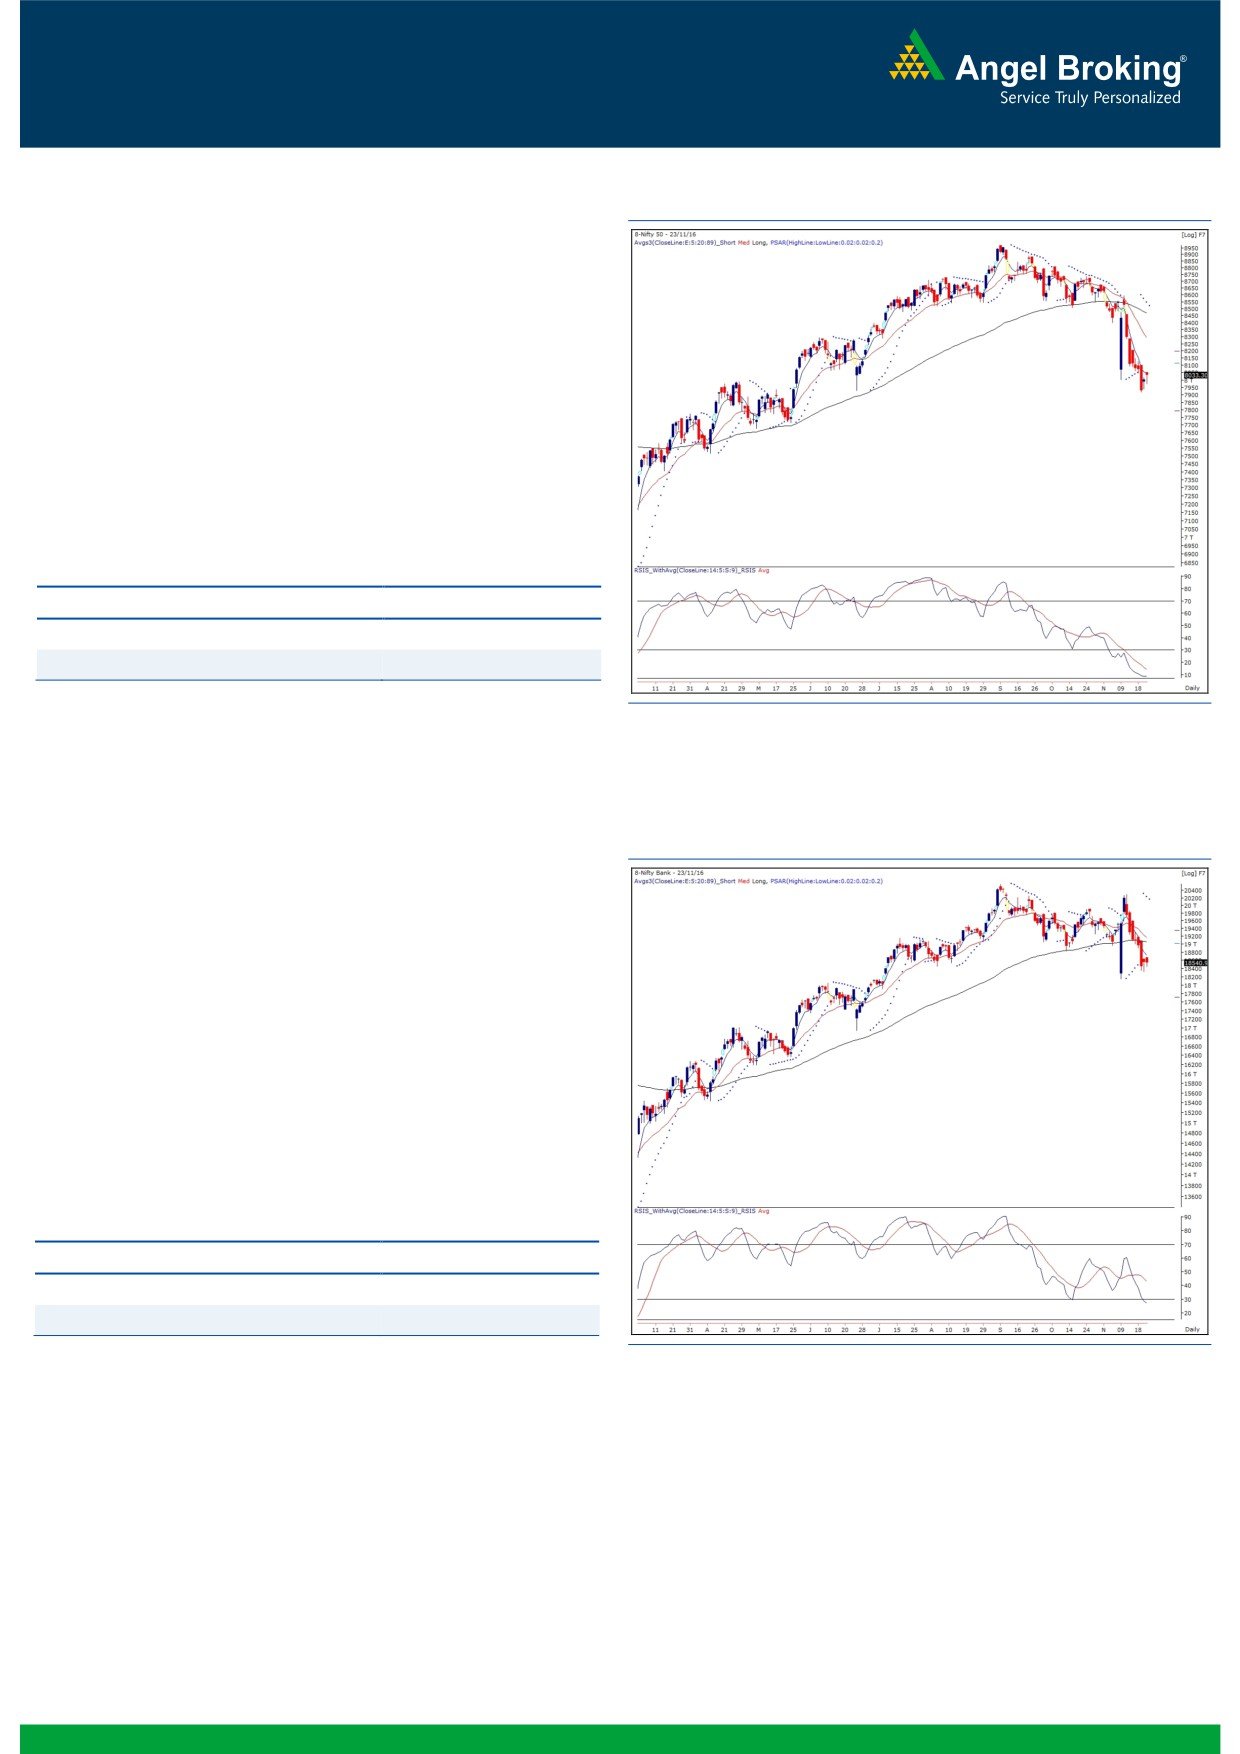
Exhibit 1: Nifty Daily Chart
Yesterday's session too opened higher but similar to previous day,
we witnessed a decent selling pressure at higher levels during the
initial trades. However, we witnessed modest recovery throughout
the day to end the session well above the 8000 mark.
After a massive correction, the index has taken a breather. We
continue with our view that the market is deeply oversold and we
may witness a decent bounce soon. Traders are advised not to
trade on the short side. On the lower side, 7940 - 7900 would be
seen as immediate support level; whereas 8055 - 8120 would act
a resistance zone.
Key Levels
Support 1 - 7940
Resistance 1 - 8055
Support 2 - 7900
Resistance 2 - 8120
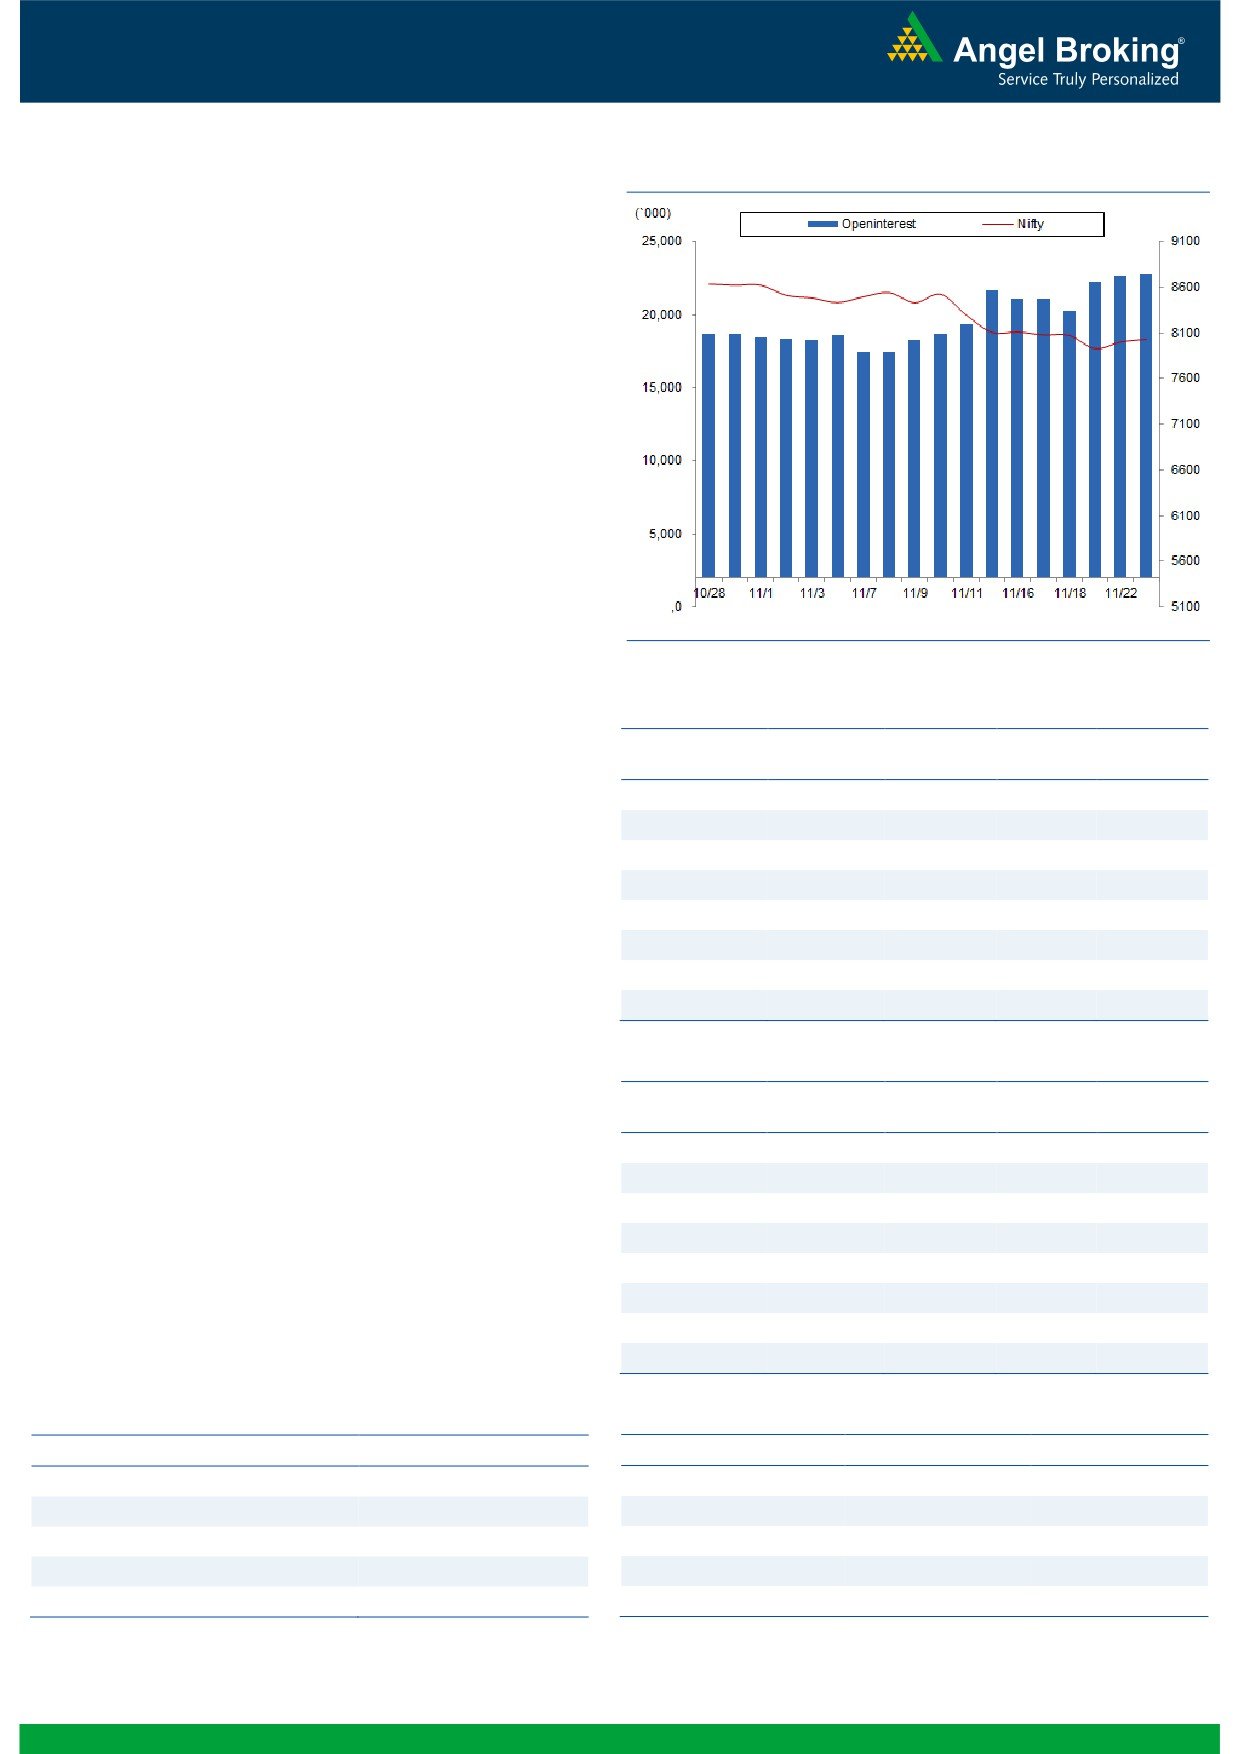
Nifty Bank Outlook - (18541)
Exhibit 2: Nifty Bank Daily Chart
The Nifty Bank index traded in a narrow range yesterday and
ended the session almost near its previous session's close.
The Nifty Bank index formed another small body candle yesterday
ahead of the expiry session, indicating lack of directional
momentum in intraday trades. As highlighted yesterday, the
momentum readings are in oversold territory on lower time frame
charts which could lead to a pullback move. However, citing
recent volatility, traders are advised to focus on stock specific
moves and trade with proper risk management. The intraday
supports for the Nifty Bank index are placed around 18320 and
18145 whereas resistances are seen around 18795 and 18955.
Key Levels
Support 1 - 18320
Resistance 1 - 18795
Support 2 - 18145
Resistance 2 - 18955
1
Technical & Derivatives Report
November 24, 2016
Comments
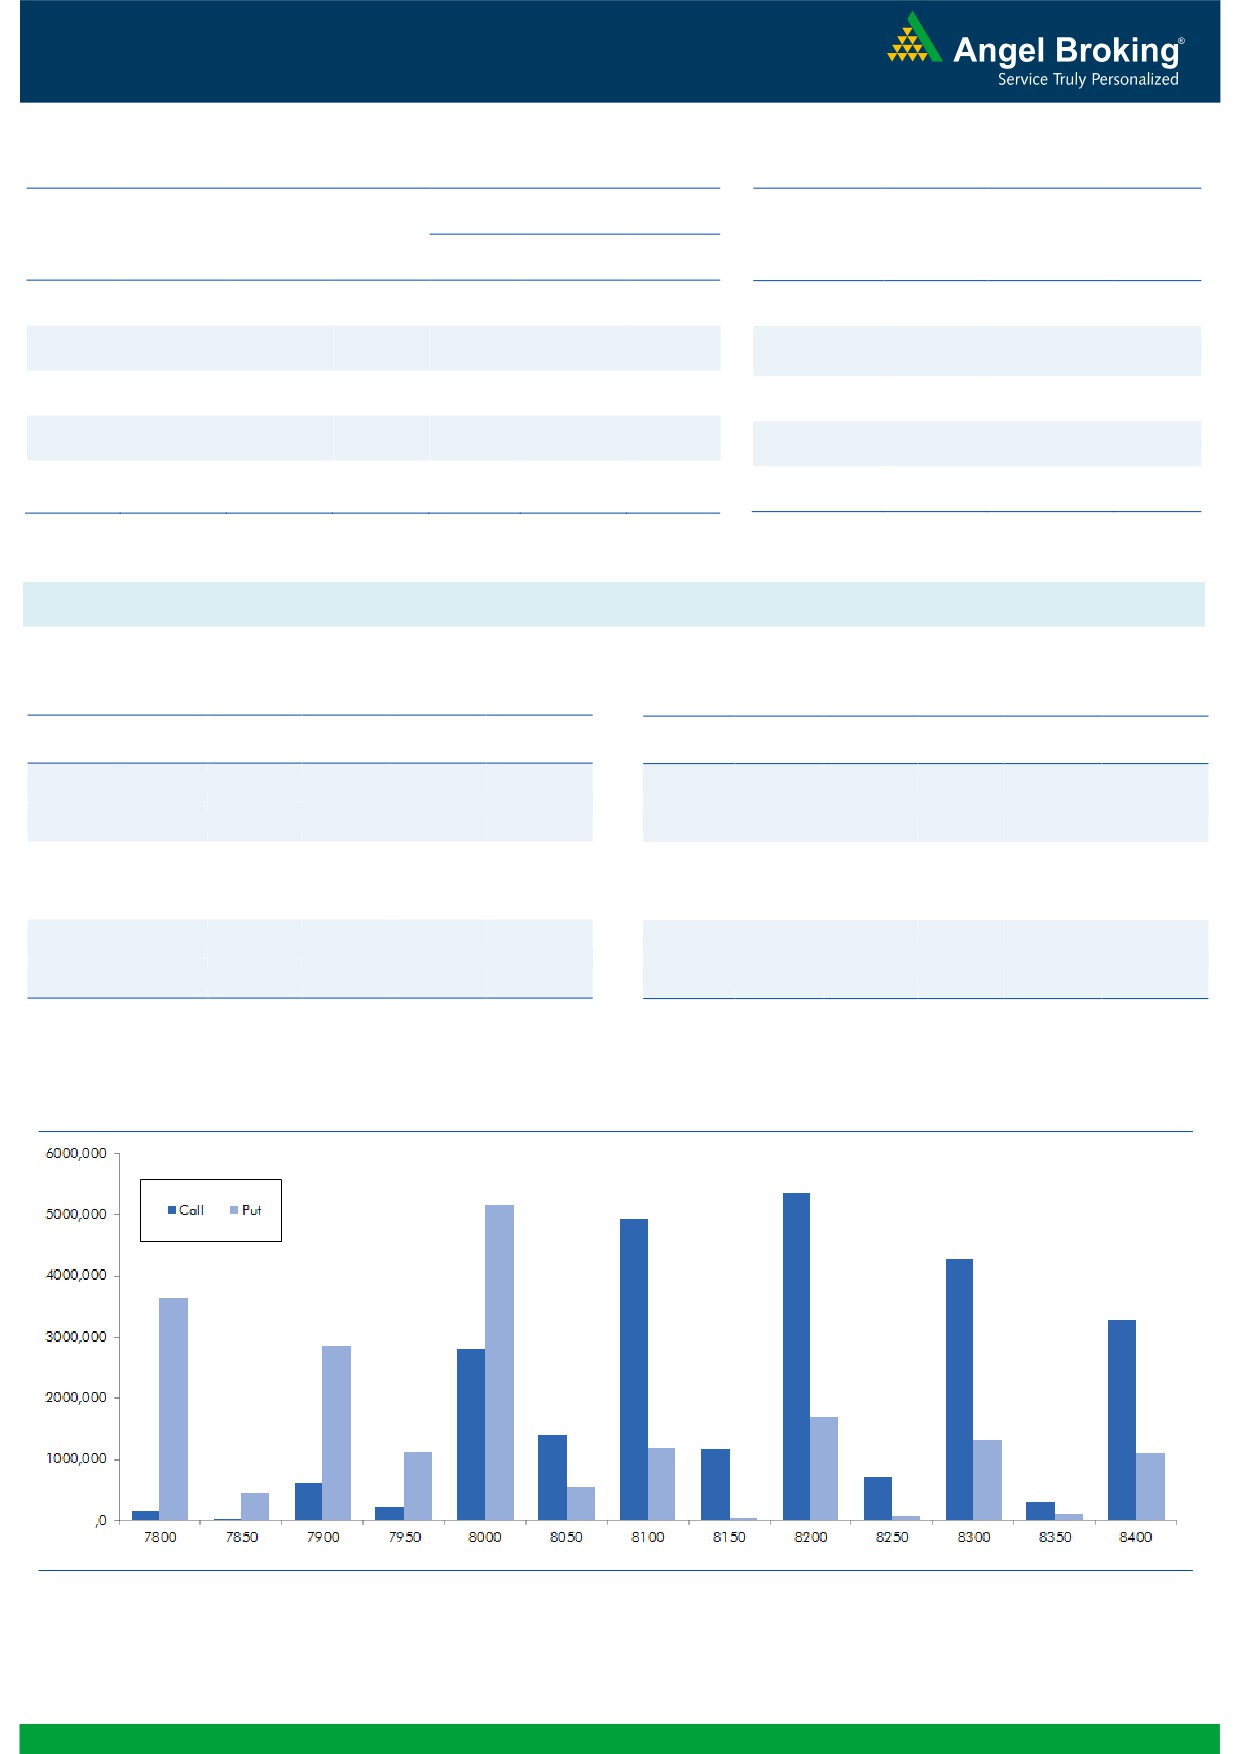
Nifty Vs OI
The Nifty futures open interest has increased by 0.29%
BankNifty futures open interest has decreased by 3.42%
as market closed at 8033.30 levels.
The Nifty November future closed with a discount of 8.45
against the premium of 4.50 points in last trading
session. The December series closed at a premium of
31.40 points.
The Implied Volatility of at the money options has
decreased from 18.89% to 18.24%. At the same time,
the PCR-OI of Nifty has increased from 0.71 to 0.73
levels.
The total OI of the market is Rs. 2,98,769/- cr. and the
stock futures OI is Rs. 73,161/- cr.
Few of the liquid counters where we have seen high cost
of carry are JPASSOCIAT, IDEA, TORNTPOWER,
GODREJCP and EICHERMOT.
Views
OI Gainers
FIIs continue their selling streak in cash market segment;
OI
PRICE
SCRIP
OI
PRICE
CHG. (%)
CHG. (%)
they sold equities worth Rs. 1023 crores. While, in index
SIEMENS
986000
19.88
1056.05
-2.01
futures, they sold marginally with rise in open interest,
ULTRACEMCO
1821200
15.46
3449.80
1.03
indicating blend of long and short formation in last
NHPC
26946000
14.19
26.00
2.36
trading session.
www.angelbroking.com
BHARTIARTL
30253400
11.43
300.95
-0.76
In Index options segment, FII were net seller worth
CESC
2098800
11.32
569.40
-0.82
Rs. 1054 crores with marginal change in open interest.
BAJAJ-AUTO
1747250
9.94
2596.60
-0.07
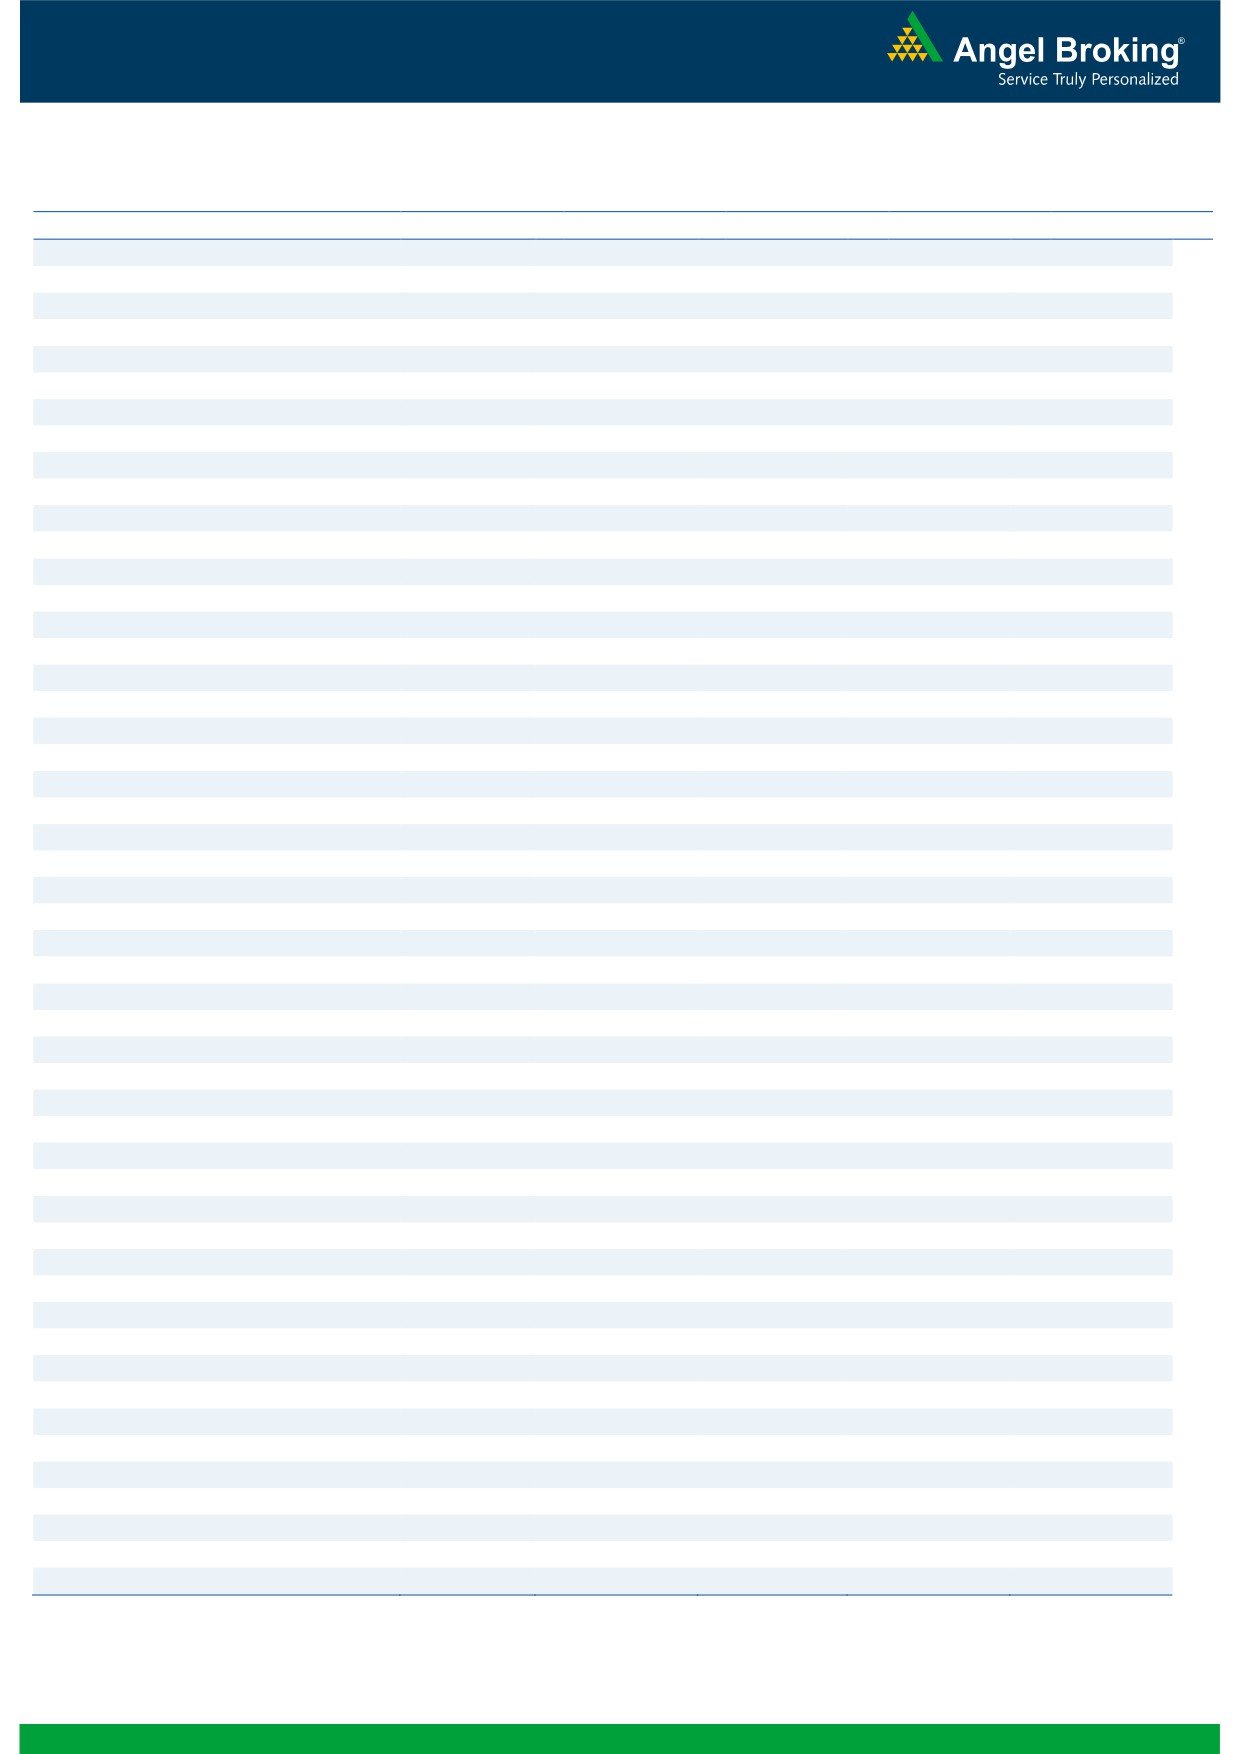
In call options, 8050 and 8100 strikes added some fresh
CUMMINSIND
598200
9.20
760.50
-1.30
positions, followed by unwinding in 8000 call option.
HINDALCO
41615000
9.01
173.55
4.23
While on the other hand in put options, good amount of
build-up was visible in 8000 strike. Highest OI in current
series has been shifted to 8200 from 8500 call and of
OI Losers
put options remains intact in 8000 strike.
OI
PRICE
SCRIP
OI
PRICE
CHG. (%)
CHG. (%)
From last
2-3 trading sessions, we are witnessing
IBREALEST
33490000
-13.55
68.75
9.47
formation of mixed position in Index Future by FIIs;
JETAIRWAYS
5746000
-13.49
361.05
5.79
wherein, majority of positions formed were on long side.
MRF
28890
-13.32
47548.50
1.17
But, these positions have been formed in December
GODREJIND
1492500
-12.33
374.50
-1.81
series. In addition, we are also witnessing good amount
ENGINERSIN
5736500
-11.93
276.25
0.31
of long formation in Stock Futures since last couple of
UNIONBANK
13028000
-11.71
149.50
-0.76
days. However, FIIs continue to write call options of
November series. Thus, looking at the options data, we
COLPAL
586600
-10.85
922.60
2.01
believe we may see November expiry below 8000 mark.
HAVELLS
3486000
-9.64
327.10
3.69
Historical Volatility
Put-Call Ratio
SCRIP
HV
SCRIP
PCR-OI
PCR-VOL
LUPIN
43.38
NIFTY
0.73
0.80
NTPC
35.09
BANKNIFTY
0.73
0.77
RELINFRA
60.08
SBIN
0.49
0.42
TATAELXSI
53.54
ICICIBANK
0.50
0.66
CADILAHC
60.31
RELIANCE
0.46
0.59
2
Technical & Derivatives Report
November 24, 2016
FII Statistics for November 23, 2016
Turnover on November 23, 2016
Open Interest
No. of
Turnover
Change
Detail
Buy
Sell
Net
Instrument
Value
Change
Contracts
( in Cr. )
(%)
Contracts
(in Cr.)
(%)
INDEX
INDEX
6183.55
6238.13
(54.58)
304004
19062.99
4.92
442512
24523.07
-0.67
FUTURES
FUTURES
INDEX
INDEX
53603.75
54657.34
(1053.58)
1321143
82097.41
0.23
6911166
409100.42
6.94
OPTIONS
OPTIONS
STOCK
25490.45
24032.87
1457.58
982889
58709.02
2.88
STOCK
FUTURES
975739
75897.09
23.41
FUTURES
STOCK
STOCK
4777.75
4816.37
(38.62)
127572
8075.54
(1.98)
OPTIONS
435175
26984.61
-2.39
OPTIONS
TOTAL
90055.50
89744.71
310.79
2735608
167944.96
1.57
TOTAL
8764592
536505.19
8.08
Nifty Spot = 8033.30
Lot Size = 75
Bull-Call Spreads
Bear-Put Spreads
Action
Strike
Price
Risk
Reward
BEP
Action
Strike
Price
Risk
Reward
BEP
Buy
8000
47.30
Buy
8100
81.30
40.40
59.60
8040.40
54.65
45.35
8045.35
Sell
8100
6.90
Sell
8000
26.65
Buy
8000
47.30
Buy
8100
81.30
46.00
154.00
8046.00
74.75
125.25
8025.25
Sell
8200
1.30
Sell
7900
6.55
Buy
8100
6.90
Buy
8000
26.65
5.60
94.40
8105.60
20.10
79.90
7979.90
Sell
8200
1.30
Sell
7900
6.55
Note: Above mentioned Bullish or Bearish Spreads in Nifty (November Series) are given as an information and not as a recommendation.
Nifty Put-Call Analysis
3
Technical & Derivatives Report
November 24, 2016
Daily Pivot Levels for Nifty Constituents
Scrips
S2
S1
PIVOT
R1
R2
ACC
1,259
1,281
1,299
1,321
1,339
ADANIPORTS
256
260
262
266
269
AMBUJACEM
191
195
197
200
203
ASIANPAINT
899
921
933
955
968
AUROPHARMA
711
721
726
736
742
AXISBANK
464
472
477
486
491
BAJAJ-AUTO
2,535
2,568
2,604
2,636
2,672
BANKBARODA
158
160
163
164
167
BHEL
121
123
125
127
129
BPCL
615
625
634
643
652
BHARTIARTL
294
297
303
306
312
INFRATEL
353
356
360
364
368
BOSCH
18,254
18,615
18,838
19,198
19,422
CIPLA
541
547
553
559
565
COALINDIA
300
302
304
307
309
DRREDDY
3,072
3,100
3,123
3,151
3,174
EICHERMOT
20,209
20,585
21,025
21,401
21,841
GAIL
402
407
414
419
425
GRASIM
796
804
811
819
826
HCLTECH
751
757
763
769
775
HDFCBANK
1,168
1,176
1,190
1,198
1,212
HDFC
1,179
1,203
1,229
1,253
1,279
HEROMOTOCO
2,978
2,996
3,013
3,031
3,048
HINDALCO
166
170
172
176
178
HINDUNILVR
808
820
827
839
846
ICICIBANK
258
262
264
267
269
IDEA
70
71
72
74
75
INDUSINDBK
1,050
1,057
1,068
1,075
1,086
INFY
908
914
919
925
929
ITC
221
223
225
227
230
KOTAKBANK
759
763
768
772
777
LT
1,326
1,342
1,363
1,379
1,400
LUPIN
1,385
1,436
1,466
1,517
1,547
M&M
1,162
1,177
1,202
1,217
1,241
MARUTI
4,810
4,846
4,895
4,931
4,980
NTPC
147
154
157
164
167
ONGC
274
277
279
282
285
POWERGRID
175
178
183
186
191
RELIANCE
995
1,002
1,006
1,013
1,017
SBIN
252
255
258
261
264
SUNPHARMA
685
693
699
707
713
TCS
2,113
2,135
2,149
2,170
2,185
TATAMTRDVR
286
291
295
301
305
TATAMOTORS
456
464
470
477
483
TATAPOWER
68
69
69
70
70
TATASTEEL
374
384
389
398
404
TECHM
442
448
453
459
464
ULTRACEMCO
3,342
3,397
3,436
3,491
3,530
WIPRO
438
443
448
453
457
YESBANK
1,102
1,114
1,130
1,141
1,158
ZEEL
430
444
453
467
477
4
Technical & Derivatives Report
November 24, 2016
Research Team Tel: 022 - 39357800
For Technical Queries
For Derivatives Queries
DISCLAIMER
Angel Broking Private Limited (hereinafter referred to as “Angel”) is a registered Member of National Stock Exchange of India Limited,
Bombay Stock Exchange Limited and Metropolitan Stock Exchange Limited. It is also registered as a Depository Participant with CDSL
and Portfolio Manager with SEBI. It also has registration with AMFI as a Mutual Fund Distributor. Angel Broking Private Limited is a
registered entity with SEBI for Research Analyst in terms of SEBI (Research Analyst) Regulations, 2014 vide registration number
INH000000164. Angel or its associates has not been debarred/ suspended by SEBI or any other regulatory authority for accessing
/dealing in securities Market. Angel or its associates/analyst has not received any compensation / managed or co-managed public
offering of securities of the company covered by Analyst during the past twelve months.
This document is solely for the personal information of the recipient, and must not be singularly used as the basis of any investment
decision. Nothing in this document should be construed as investment or financial advice. Each recipient of this document should
make such investigations as they deem necessary to arrive at an independent evaluation of an investment in the securities of the
companies referred to in this document (including the merits and risks involved), and should consult their own advisors to determine
the merits and risks of such an investment.
Reports based on technical and derivative analysis center on studying charts of a stock's price movement, outstanding positions and
trading volume, as opposed to focusing on a company's fundamentals and, as such, may not match with a report on a company's
fundamentals. Investors are advised to refer the Fundamental and Technical Research Reports available on our website to evaluate the
contrary view, if any.
The information in this document has been printed on the basis of publicly available information, internal data and other reliable
sources believed to be true, but we do not represent that it is accurate or complete and it should not be relied on as such, as this
document is for general guidance only. Angel Broking Pvt. Limited or any of its affiliates/ group companies shall not be in any way
responsible for any loss or damage that may arise to any person from any inadvertent error in the information contained in this report.
Angel Broking Pvt. Limited has not independently verified all the information contained within this document. Accordingly, we cannot
testify, nor make any representation or warranty, express or implied, to the accuracy, contents or data contained within this document.
While Angel Broking Pvt. Limited endeavors to update on a reasonable basis the information discussed in this material, there may be
regulatory, compliance, or other reasons that prevent us from doing so.
This document is being supplied to you solely for your information, and its contents, information or data may not be reproduced,
redistributed or passed on, directly or indirectly.
Neither Angel Broking Pvt. Limited, nor its directors, employees or affiliates shall be liable for any loss or damage that may arise from
or in connection with the use of this information.
5