Technical & Derivatives Report
November 24, 2015
Sensex (25819) / Nifty (7849)
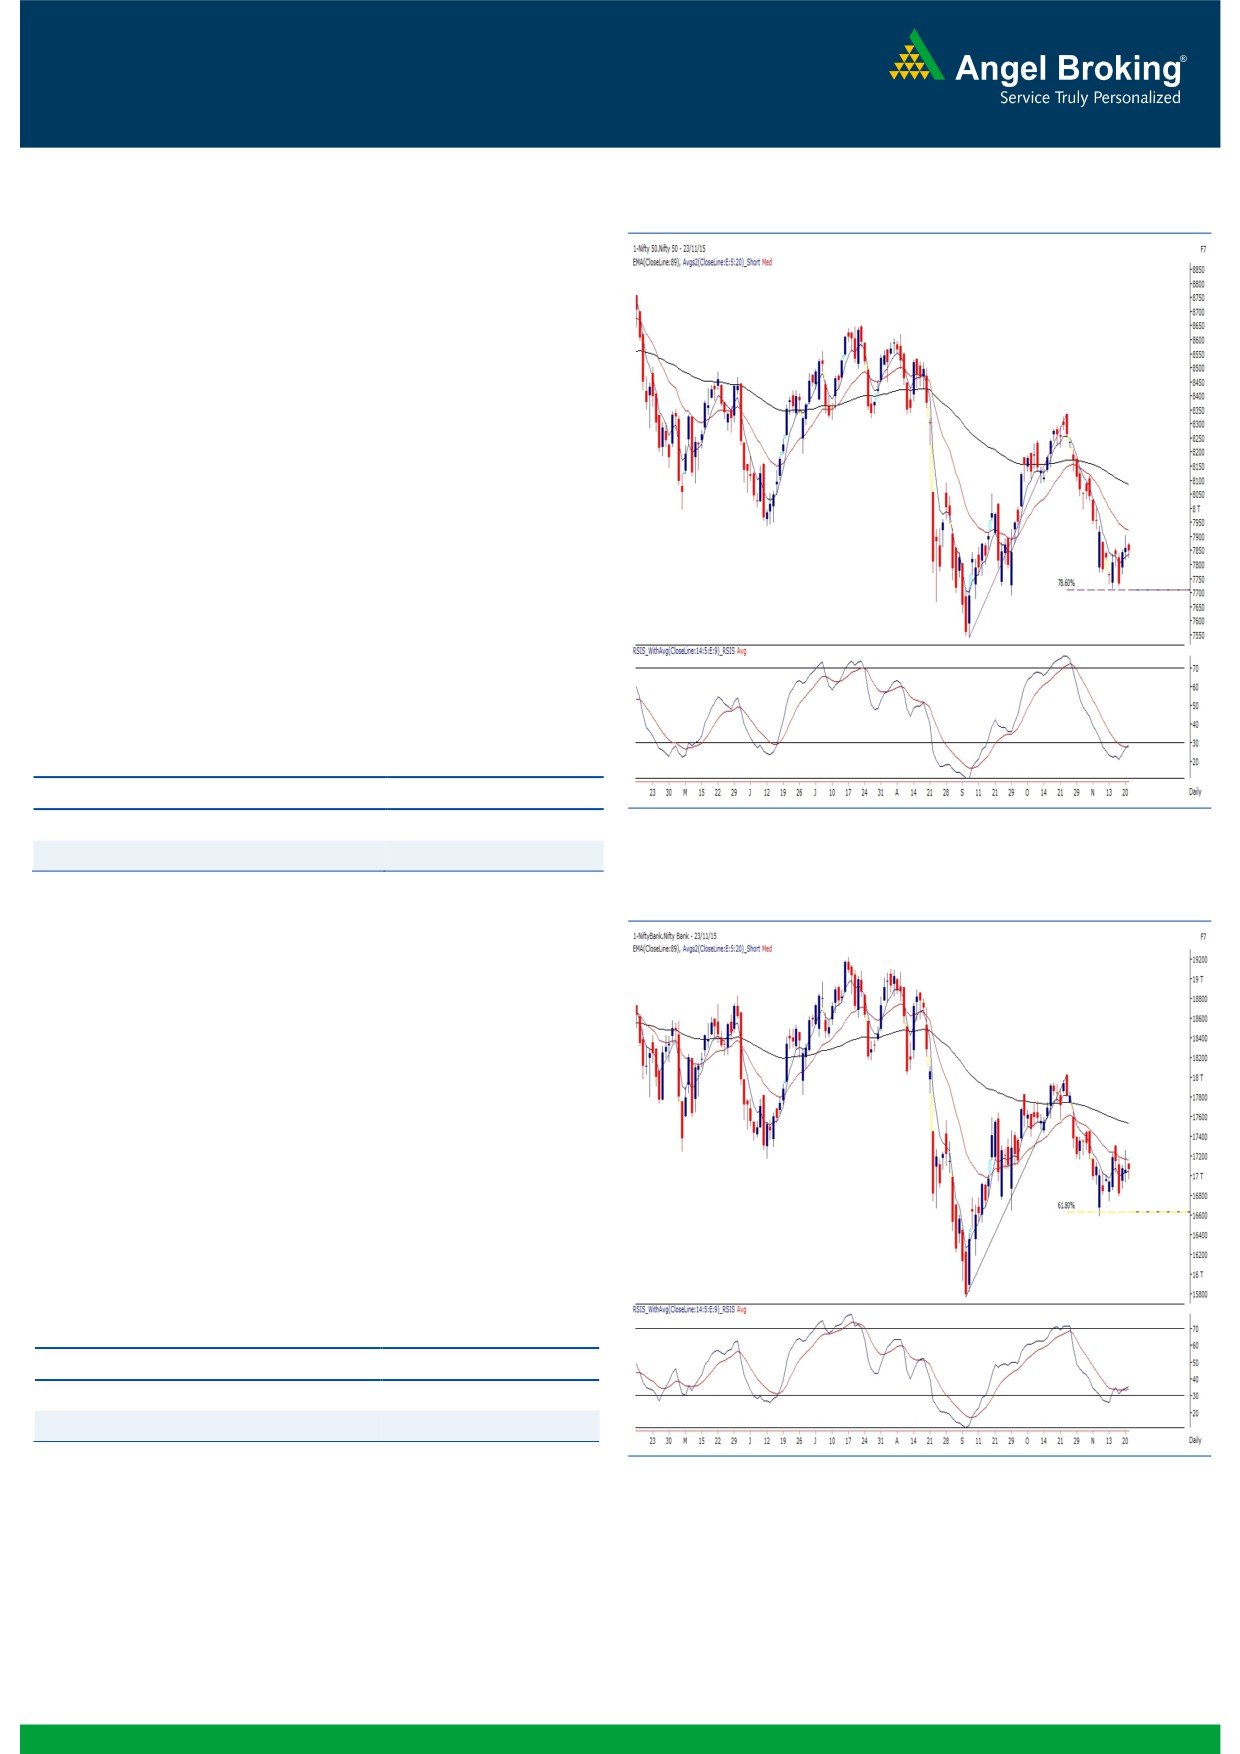
Exhibit 1: Nifty Daily Chart
The opening session of the week started the proceedings with
a mildly positive bias amid mixed global cues. However, the
index came off a bit from day’s high and then traded within a
narrow range throughout the session to conclude with
negligible losses. Despite dull price movement, we can now
observe few interesting developments on chart. Firstly, the
hourly chart depicts a ‘Higher Top Higher Bottom’ for the first
time in last four weeks and more importantly, the daily ‘RSI-
Smoothened’ oscillator is on the verge of confirming a positive
crossover well inside the positive territory. Historically, this
technical evidence has proved its significance on so many
occasions and thus, need to be given some weightage to this
development. Going forward, if the Nifty manages to surpass
the 7920 mark then we may witness an impact of this
indicator to push the Nifty northwards. On the flipside, 7810 -
7700 remains to be strong support levels. Meanwhile, traders
should continue with their stock centric approach with a
proper exit strategy.
Key Levels
Support 1 - 7810
Resistance 1 - 7885
Support 2 - 7700
Resistance 2 - 7920
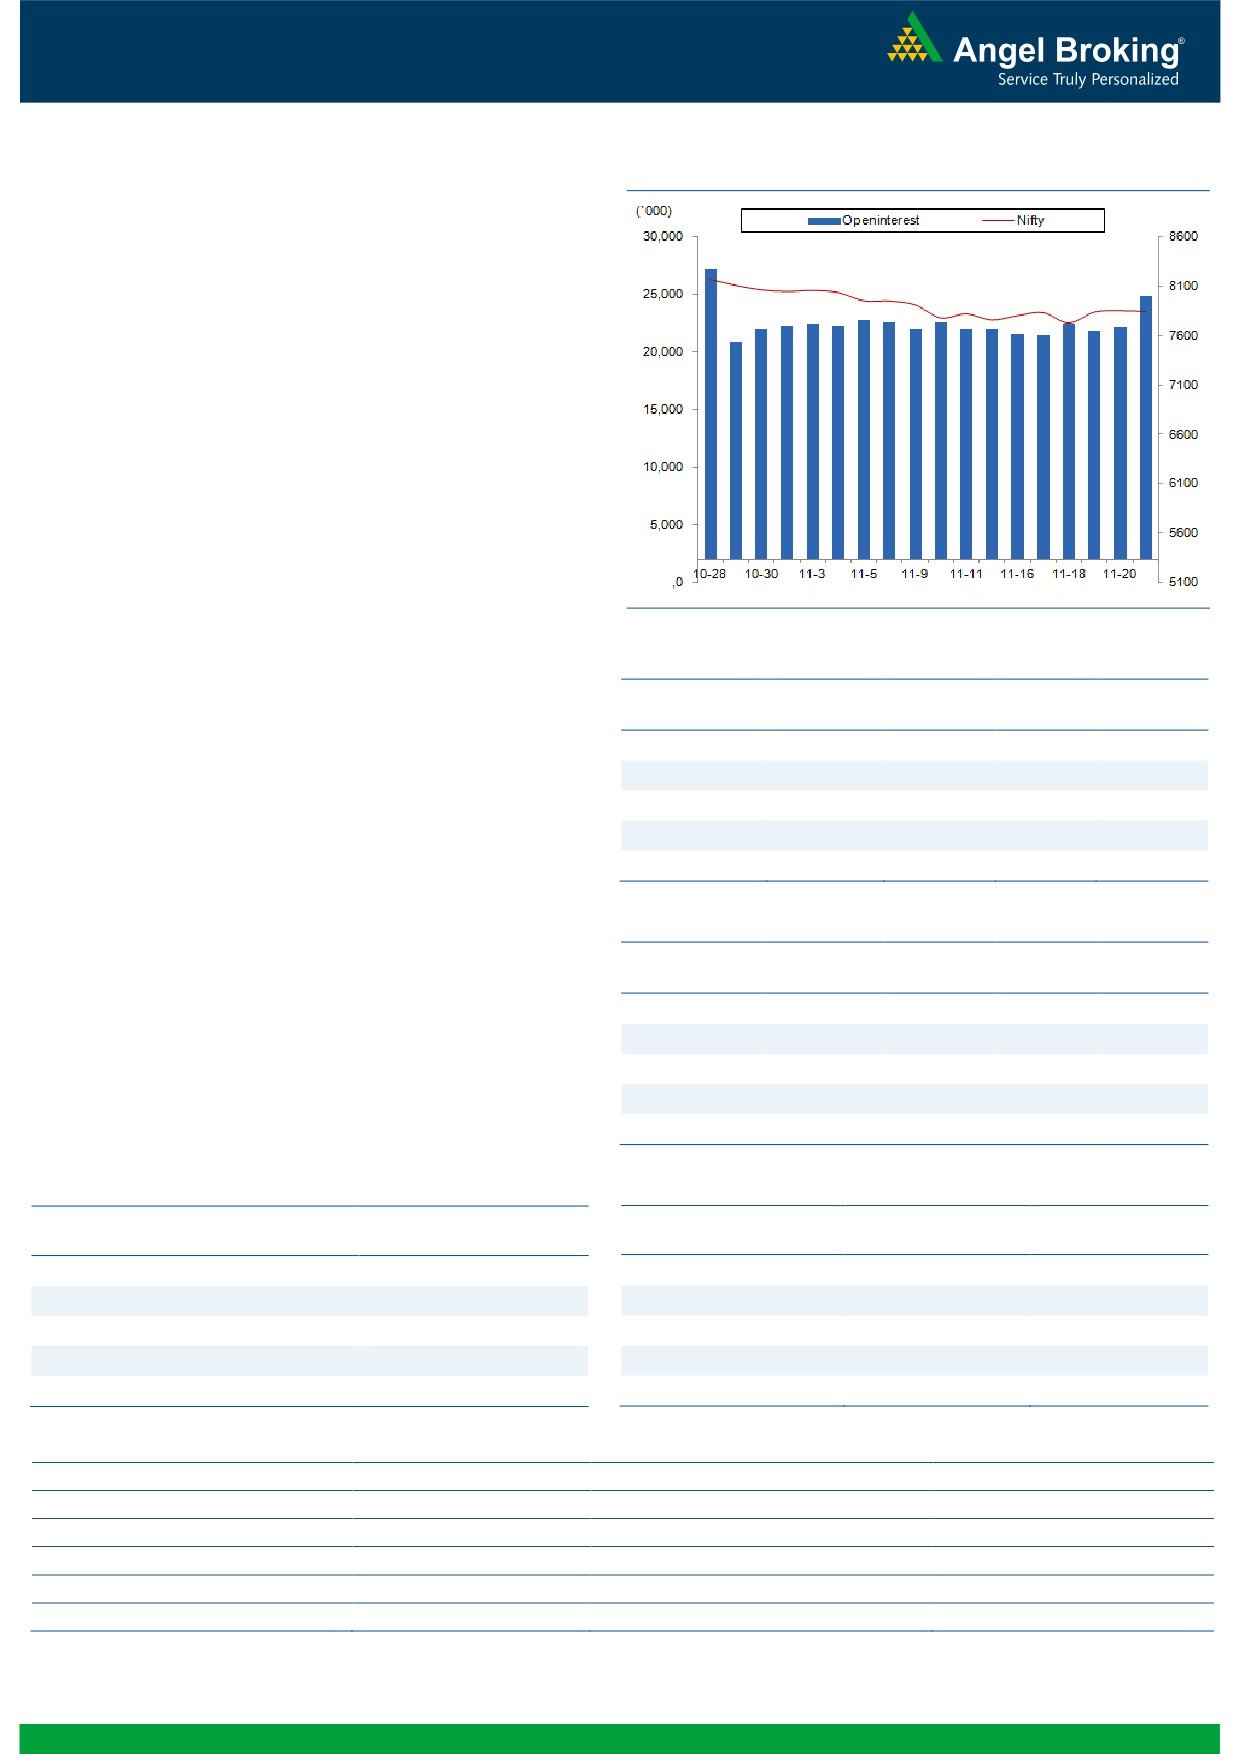
Exhibit 2: Bank Nifty Daily Chart
Bank Nifty Outlook - (17060)
The week started on a positive note as the Bank Nifty opened
with an upside gap of nearly 65 points in yesterday’s session.
But, the index failed to gain momentum from the gap up
opening and started correcting from the first tick. The banking
index traded within a narrow range of a percent throughout
the session and eventually ended the session with negligible
gains of 0.03 percent over its previous close. Since, the chart
structure remains the same; we reiterate our view that the
Bank Nifty may move towards 17400 levels till it holds 16785
level. At current juncture, the intraday support for the Bank
Nifty is placed at 16930 and 16785 levels; whereas, 17260
and 17400 levels would now act as an immediate resistance
zone for the index.
Key Levels
Support 1 - 16930
Resistance 1 - 17260
Support 2 - 16785
Resistance 2 - 17400
1
Technical & Derivatives Report
November 24, 2015
Comments
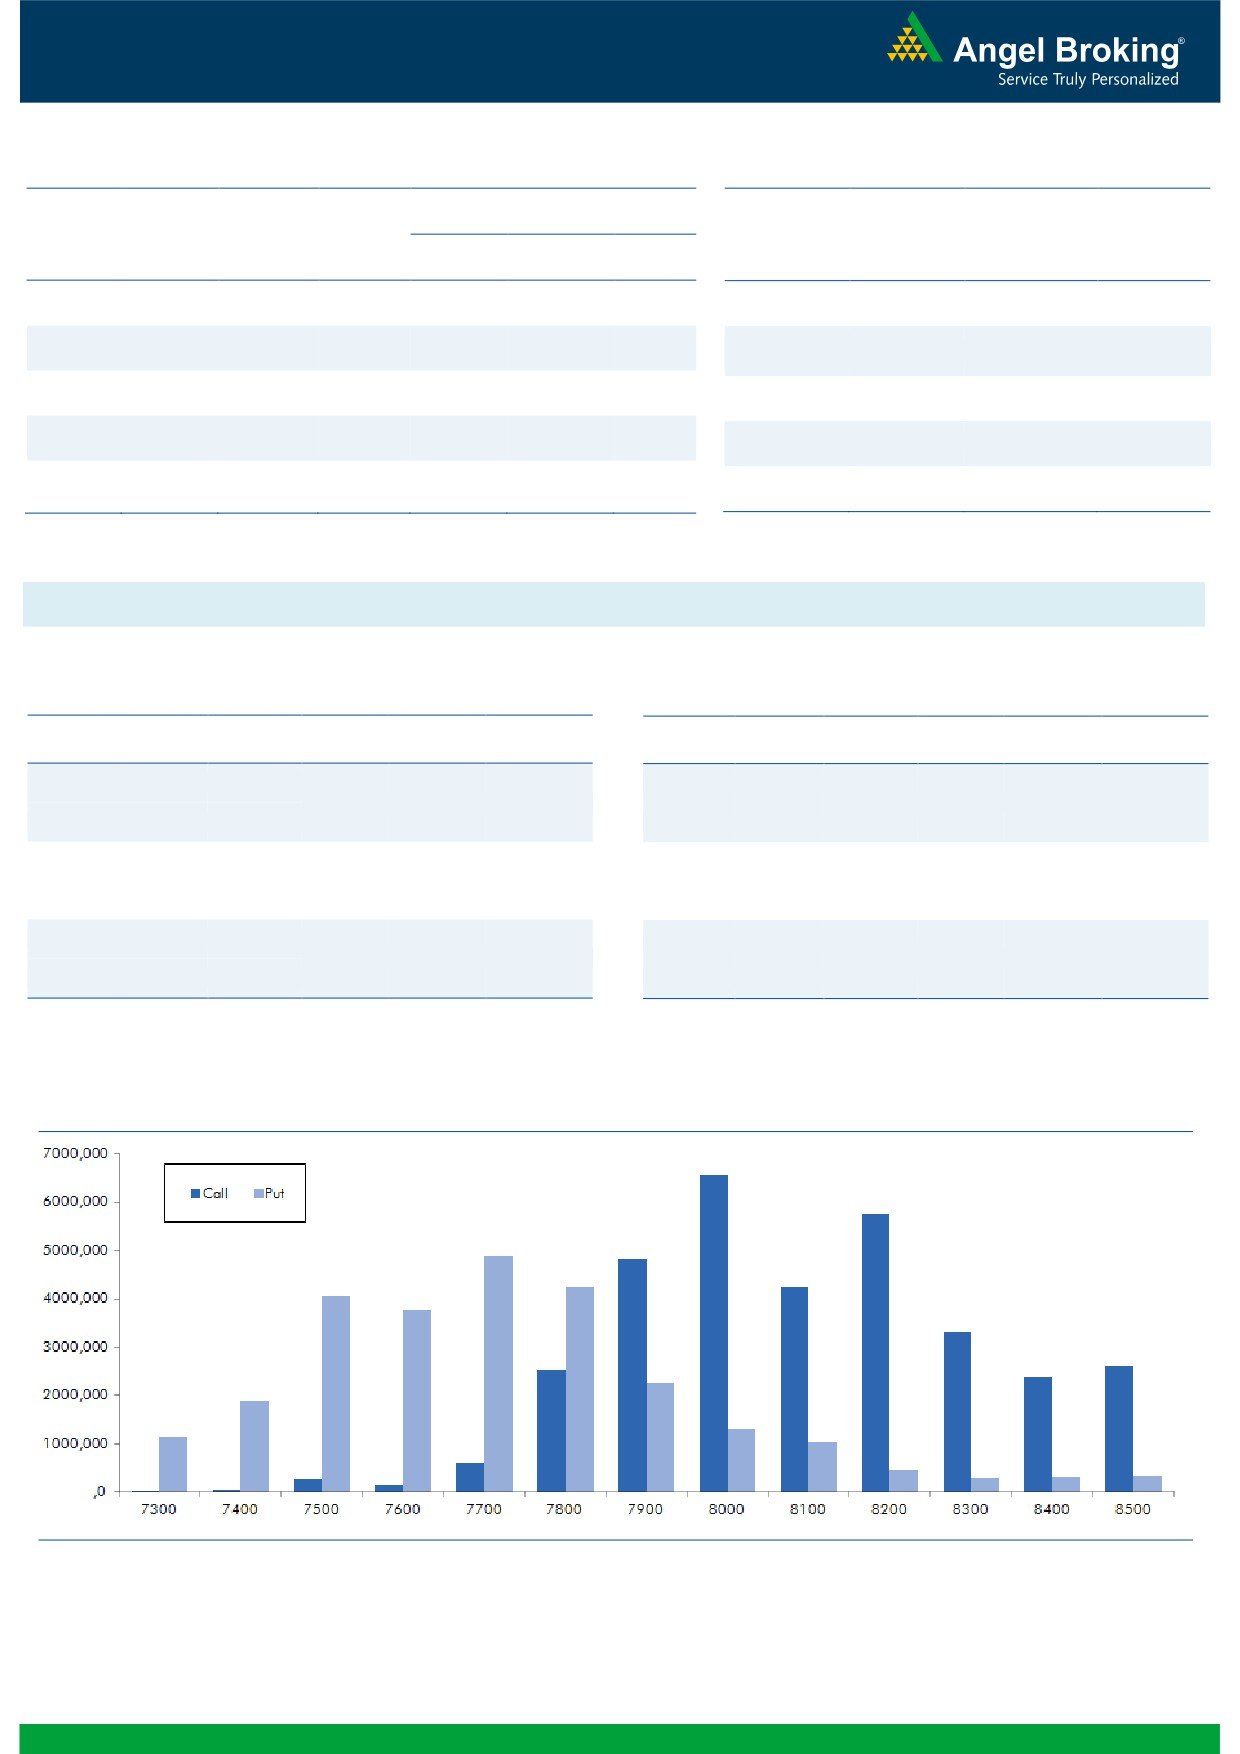
Nifty Vs OI
The Nifty futures open interest has increased by 11.99%
BankNifty futures open interest has increased by 3.08%
as market closed at 7849.25 levels.
The Nifty November future closed at a discount of 2.00
points against a discount of 4.95 points. The December
series closed at a premium of 36.20 points.
The Implied Volatility of at the money options has
increased from 12.36% to 14.68%.
The total OI of the market is Rs. 2,53,735/- cr. and the
stock futures OI is Rs. 67,093/- cr.
Few of the liquid counters where we have seen high cost
of carry are JINDALSTEL, GMRINFRA, UNITECH,
JPASSOCIAT and TVSMOTOR.
OI Gainers
OI
PRICE
Views
SCRIP
OI
PRICE
CHG. (%)
CHG. (%)
PETRONET
8046000
24.80
231.80
5.70
FIIs activity in cash market segment was muted. While in
VOLTAS
7908800
23.82
270.50
0.09
Index Futures, they were quite active; they bought of
NCC
10400000
20.59
78.35
-1.69
worth Rs. 403 crores with significant rise in open interest,
HEROMOTOCO
1665400
20.44
2630.20
2.35
indicating blend of both long and short formation.
UPL
8337000
18.66
442.80
-3.61
In Index Options front, they sold worth Rs. 687 croresng.com
with marginal change in OI. In call options, 7900 to
8000 strikes added some fresh positions. While in put
OI Losers
options front, we hardly saw any meaningful buildup.
OI
PRICE
SCRIP
OI
PRICE
CHG. (%)
CHG. (%)
Maximum build-up is visible in 8000 call and 7700 put
ASIANPAINT
4339200
-9.98
850.65
2.74
options. We still suggest avoiding forming fresh longs in
NMDC
17965000
-9.01
92.30
0.98
Nifty, no relevant changes being observed.
MOTHERSUMI
9651000
-7.38
284.60
-0.09
Rollovers in NIFTY and BANKNIFTY is in line at 44.56%
IBREALEST
39528000
-4.91
60.30
-1.07
and 30.13% respectively
ACC
1588875
-4.74
1342.35
0.04
Historical Volatility
Put-Call Ratio
SCRIP
HV
SCRIP
PCR-OI
PCR-VOL
HEROMOTOCO
25.18
NIFTY
0.77
0.90
PETRONET
51.60
BANKNIFTY
0.85
0.97
CROMPGREAV
44.40
DRREDDY
0.54
0.81
UPL
44.24
LT
0.43
0.45
ASIANPAINT
29.57
AXISBANK
0.38
0.53
Strategy Date
Symbol
Strategy
Status
November 02, 2015
RELIANCE
Short Strangle
Active
November 09, 2015
ITC
Short Strangle
Did not trigger.
November 16, 2015
TATAMOTORS
Long Put Ladder
Active
November 23, 2015
HEROMOTOCO
Ratio Put Spread
Active
2
Technical & Derivatives Report
November 24, 2015
FII Statistics for 23-November 2015
Turnover on 23-November 2015
Open Interest
No. of
Turnover
Change
Detail
Buy
Sell
Net
Instrument
Value
Change
Contracts
( in Cr. )
(%)
Contracts
(in Cr.)
(%)
INDEX
INDEX
7326.07
6922.81
403.26
381349
22044.60
22.93
368542
20896.75
-1.84
FUTURES
FUTURES
INDEX
INDEX
24366.28
25041.56
(675.28)
1276913
74265.21
0.17
3840300
223665.22
-22.11
OPTIONS
OPTIONS
STOCK
18949.87
18660.90
288.97
1051504
51987.44
4.16
STOCK
FUTURES
1158844
57633.36
52.68
FUTURES
STOCK
STOCK
2191.99
2287.42
(95.43)
81414
3992.62
1.13
OPTIONS
295009
15217.50
-17.58
OPTIONS
TOTAL
52834.20
52912.68
(78.48)
2791180
152289.88
4.34
TOTAL
5662696
317412.92
-12.95
Nifty Spot = 7849.25
Lot Size = 25
Bull-Call Spreads
Bear-Put Spreads
Action
Strike
Price
Risk
Reward
BEP
Action
Strike
Price
Risk
Reward
BEP
Buy
7900
20.00
Buy
7800
22.65
15.65
84.35
7915.65
16.20
83.80
7783.80
Sell
8000
4.35
Sell
7700
6.45
Buy
7900
20.00
Buy
7800
22.65
18.80
181.20
7918.80
19.90
180.10
7780.10
Sell
8100
1.20
Sell
7600
2.75
Buy
8000
4.35
Buy
7700
6.45
3.15
96.85
8003.15
3.70
96.30
7696.30
Sell
8100
1.20
Sell
7600
2.75
Note: Above mentioned Bullish or Bearish Spreads in Nifty (Nov. Series) are given as an information and not as a recommendation.
Nifty Put-Call Analysis
3
Technical & Derivatives Report
November 24, 2015
Daily Pivot Levels for Nifty 50 Stocks
Scrips
S2
S1
PIVOT
R1
R2
ACC
1,331
1,337
1,342
1,348
1,353
ADANIPORTS
271
274
276
279
282
AMBUJACEM
197
199
201
203
206
ASIANPAINT
829
840
846
857
863
AXISBANK
456
460
462
465
467
BAJAJ-AUTO
2,463
2,493
2,511
2,541
2,559
BANKBARODA
166
168
170
172
175
BHARTIARTL
331
335
341
344
350
BHEL
172
174
176
178
181
BOSCHLTD
18,738
18,876
19,038
19,176
19,338
BPCL
893
899
911
917
928
CAIRN
134
136
138
140
141
CIPLA
626
634
641
648
655
COALINDIA
329
331
332
334
336
DRREDDY
3,334
3,372
3,398
3,435
3,461
GAIL
334
348
358
372
382
GRASIM
3,613
3,643
3,677
3,707
3,742
HCLTECH
854
859
863
868
873
HDFC
1,169
1,180
1,195
1,207
1,222
HDFCBANK
1,050
1,058
1,067
1,075
1,083
HEROMOTOCO
2,530
2,583
2,625
2,678
2,720
HINDALCO
72
73
75
76
79
HINDUNILVR
779
785
793
799
807
ICICIBANK
253
260
264
270
274
IDEA
133
136
138
141
143
INDUSINDBK
911
915
923
927
934
INFY
1,027
1,040
1,051
1,065
1,076
ITC
331
334
339
343
348
KOTAKBANK
672
678
686
692
700
LT
1,354
1,361
1,373
1,380
1,391
LUPIN
1,798
1,820
1,833
1,855
1,867
M&M
1,295
1,309
1,322
1,336
1,349
MARUTI
4,655
4,696
4,743
4,783
4,831
NTPC
131
132
133
134
136
ONGC
228
230
233
235
238
PNB
136
137
139
141
143
POWERGRID
130
131
131
132
133
RELIANCE
941
947
953
959
964
SBIN
238
240
243
245
248
VEDL
87
89
91
93
95
SUNPHARMA
704
711
720
726
735
TATAMOTORS
393
398
401
406
409
TATAPOWER
66
67
67
67
67
TATASTEEL
218
221
226
229
234
TCS
2,364
2,378
2,396
2,409
2,427
TECHM
530
534
540
544
549
ULTRACEMCO
2,742
2,771
2,790
2,820
2,839
WIPRO
563
566
571
575
580
YESBANK
727
734
739
746
752
ZEEL
391
399
404
412
418
4
Technical & Derivatives Report
November 24, 2015
Research Team Tel: 022 - 39357800
For Technical Queries
For Derivatives Queries
DISCLAIMER
Angel Broking Private Limited (hereinafter referred to as “Angel”) is a registered Member of National Stock Exchange of India Limited,
Bombay Stock Exchange Limited and MCX Stock Exchange Limited. It is also registered as a Depository Participant with CDSL and
Portfolio Manager with SEBI. It also has registration with AMFI as a Mutual Fund Distributor. Angel Broking Private Limited is a
registered entity with SEBI for Research Analyst in terms of SEBI (Research Analyst) Regulations, 2014 vide registration number
INH000000164. Angel or its associates has not been debarred/ suspended by SEBI or any other regulatory authority for accessing
/dealing in securities Market. Angel or its associates including its relatives/analyst do not hold any financial interest/beneficial
ownership of more than 1% in the company covered by Analyst. Angel or its associates/analyst has not received any compensation /
managed or co-managed public offering of securities of the company covered by Analyst during the past twelve months. Angel/analyst
has not served as an officer, director or employee of company covered by Analyst and has not been engaged in market making activity
of the company covered by Analyst.
This document is solely for the personal information of the recipient, and must not be singularly used as the basis of any investment
decision. Nothing in this document should be construed as investment or financial advice. Each recipient of this document should
make such investigations as they deem necessary to arrive at an independent evaluation of an investment in the securities of the
companies referred to in this document (including the merits and risks involved), and should consult their own advisors to determine
the merits and risks of such an investment.
Reports based on technical and derivative analysis center on studying charts of a stock's price movement, outstanding positions and
trading volume, as opposed to focusing on a company's fundamentals and, as such, may not match with a report on a company's
fundamentals.
The information in this document has been printed on the basis of publicly available information, internal data and other reliable
sources believed to be true, but we do not represent that it is accurate or complete and it should not be relied on as such, as this
document is for general guidance only. Angel Broking Pvt. Limited or any of its affiliates/ group companies shall not be in any way
responsible for any loss or damage that may arise to any person from any inadvertent error in the information contained in this report.
Angel Broking Pvt. Limited has not independently verified all the information contained within this document. Accordingly, we cannot
testify, nor make any representation or warranty, express or implied, to the accuracy, contents or data contained within this document.
While Angel Broking Pvt. Limited endeavors to update on a reasonable basis the information discussed in this material, there may be
regulatory, compliance, or other reasons that prevent us from doing so.
This document is being supplied to you solely for your information, and its contents, information or data may not be reproduced,
redistributed or passed on, directly or indirectly.
Neither Angel Broking Pvt. Limited, nor its directors, employees or affiliates shall be liable for any loss or damage that may arise from
or in connection with the use of this information.
Note: Please refer to the important ‘Stock Holding Disclosure' report on the Angel website (Research Section). Also, please refer to the
latest update on respective stocks for the disclosure status in respect of those stocks. Angel Broking Pvt. Limited and its affiliates may
have investment positions in the stocks recommended in this report.
5