Technical & Derivatives Report
October 24, 2016
Sensex (28077) / Nifty (8693)
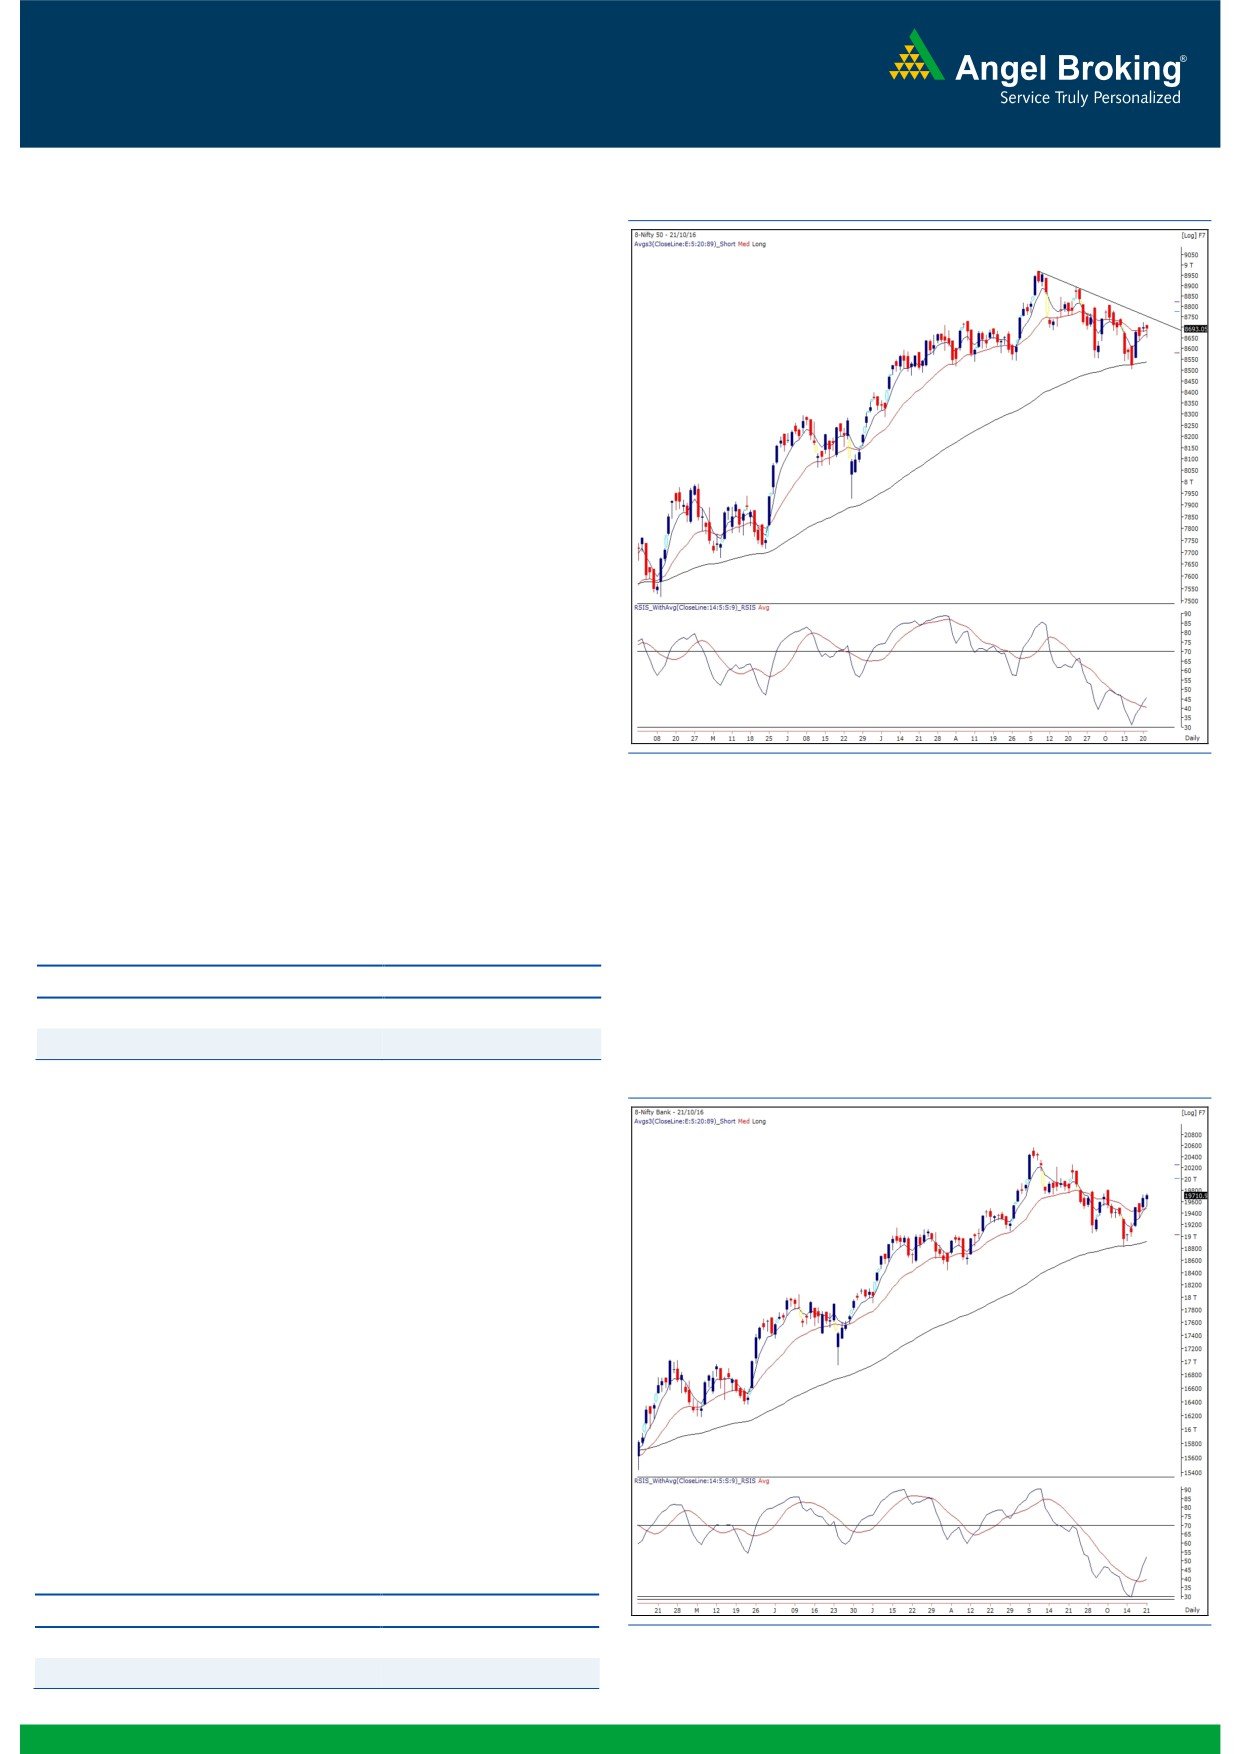
Exhibit 1: Nifty Daily Chart
The Nifty index traded in narrow range on Friday and ended the
session on flat note.
The week’s trading started on expected lines witnessing the index
forming a large bearish candle on Monday’s session. As a result,
the index breached the neckline of the ‘Head & Shoulders’
pattern, which we had mentioned in our last week’s outlook.
However, inspite of posting a bit lower than the support zone of
8540 - 8518, the index pulled back higher in the remaining part
of the week. The velocity of the pullback move was quite
unexpected as certain index heavy-weights and midcaps showed
decent upward move. If we closely observe the daily chart, inspite
of the recent rally, the ‘Lower Top Lower Bottom’ structure is still
intact. The recent ‘Swing High’, the ‘Falling Trendline Resistance’
formed by joining the recent lower tops, and the ‘Parabolic SAR’
on daily charts coincide near 8745 and thus, the mentioned level
is a key resistance for the index. Hence, unless the index closes
above the mentioned resistance, we would continue to advise
traders to wait on sidelines. In case of failure to cross the
resistance, it would lead to another leg of corrective move
towards 8630 and 8540. However, a firm close above 8745
would negate our recent cautious stance on the market and then
it would compel us to reassess the situation in order to provide a
near term outlook.
Key Levels
Support 1 - 8668
Resistance 1 - 8745
Support 2 - 8630
Resistance 2 - 8765
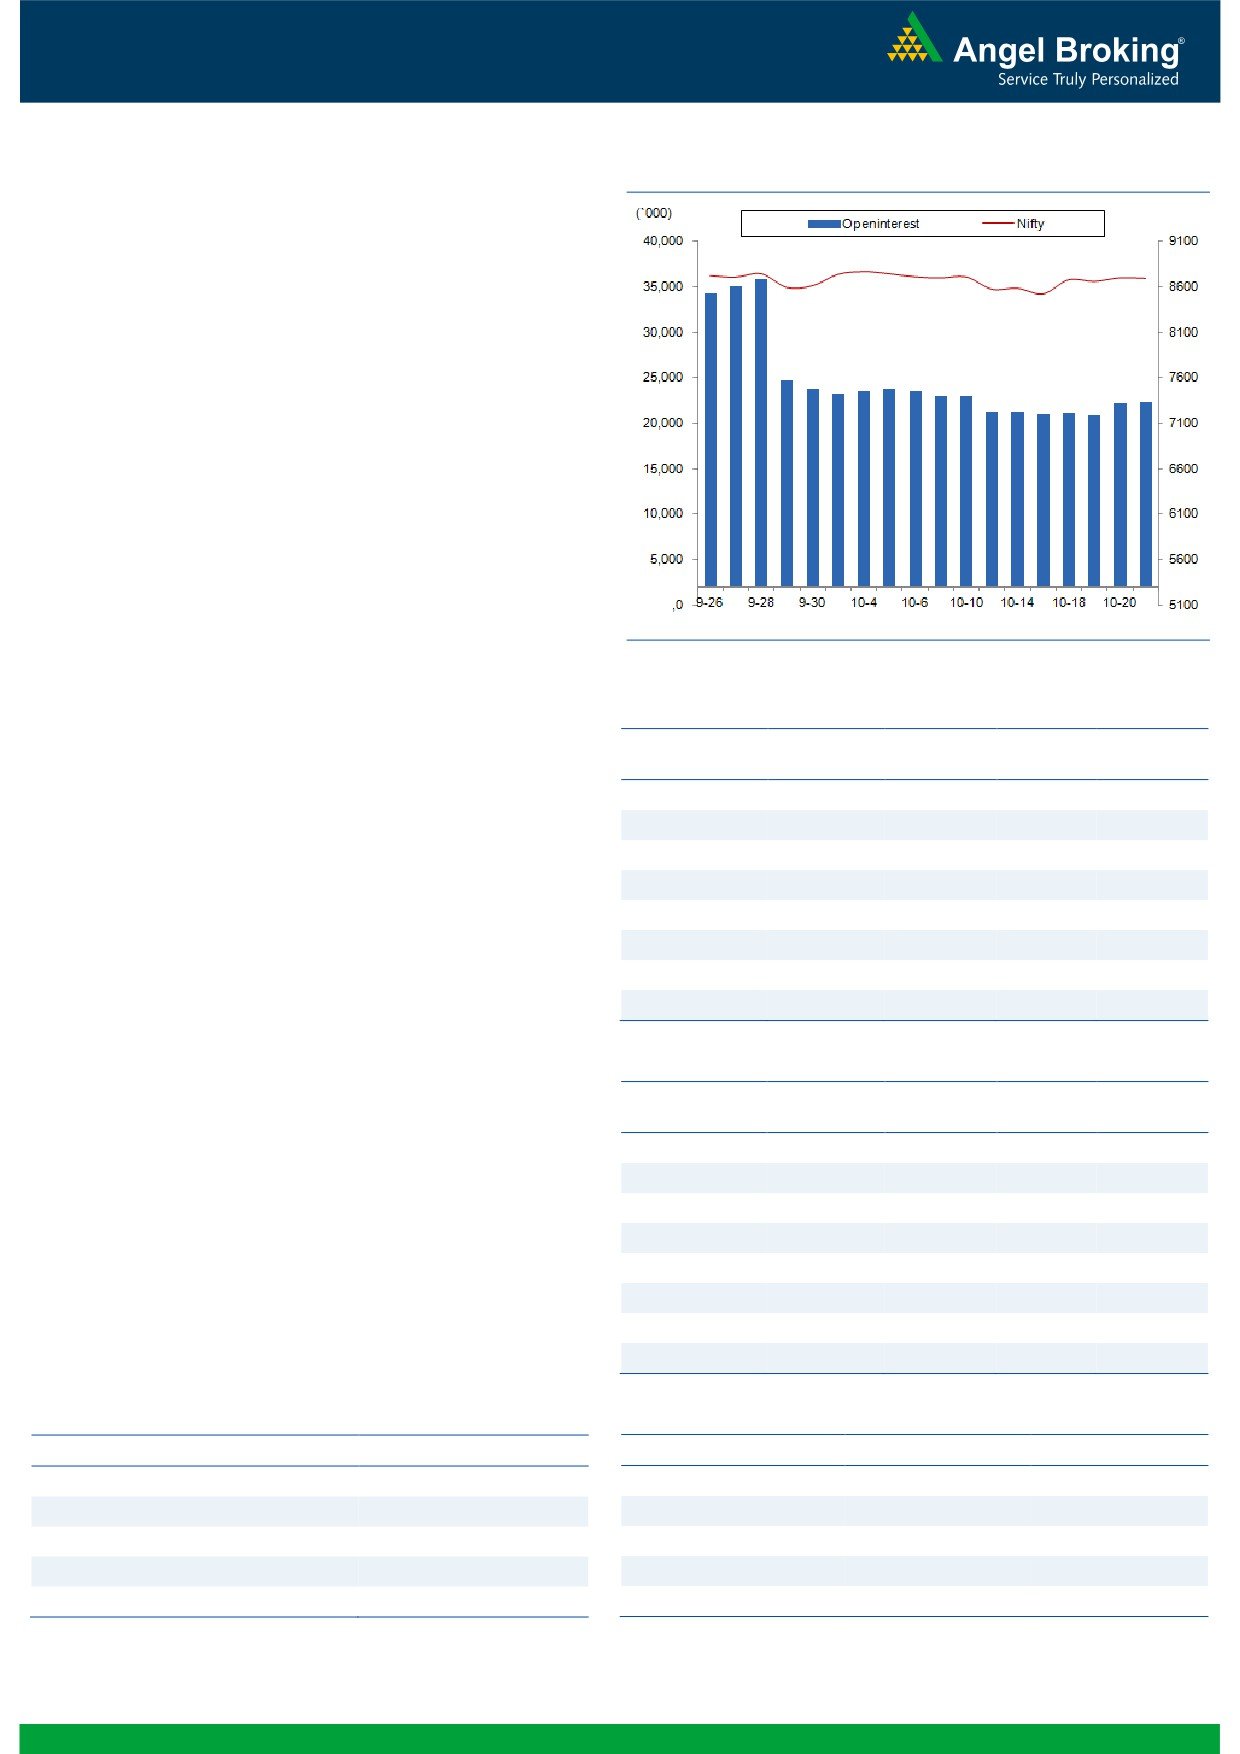
Exhibit 2: Nifty Bank Daily Chart
Nifty Bank Outlook - (19711)
The Nifty Bank index opened on a flat note on Friday and moved
in negative territory for major part of the session. However, the
sharp rally in the concluding hour pulled the banking index
higher to post a close with 0.27 percent gains over its previous
close.
On week on week basis, the banking index has shown
tremendous out-performance against broader market by posting
a close above previous week’s high. However, the ‘Lower High
Lower Low’ formation on daily chart is still intact and will negate
only above its previous swing high of 19817. Currently, the Nifty
Bank index is trading at the crucial levels and further development
on chart will dictate upcoming move in the index. Immediate
support for the banking index is placed at 19516 - 19470 zone;
whereas, the resistance is at 19817 and 19905 levels.
Key Levels
Support 1 - 19516
Resistance 1 - 19817
Support 2 - 19470
Resistance 2 - 19905
1
Technical & Derivatives Report
October 24, 2016
Comments
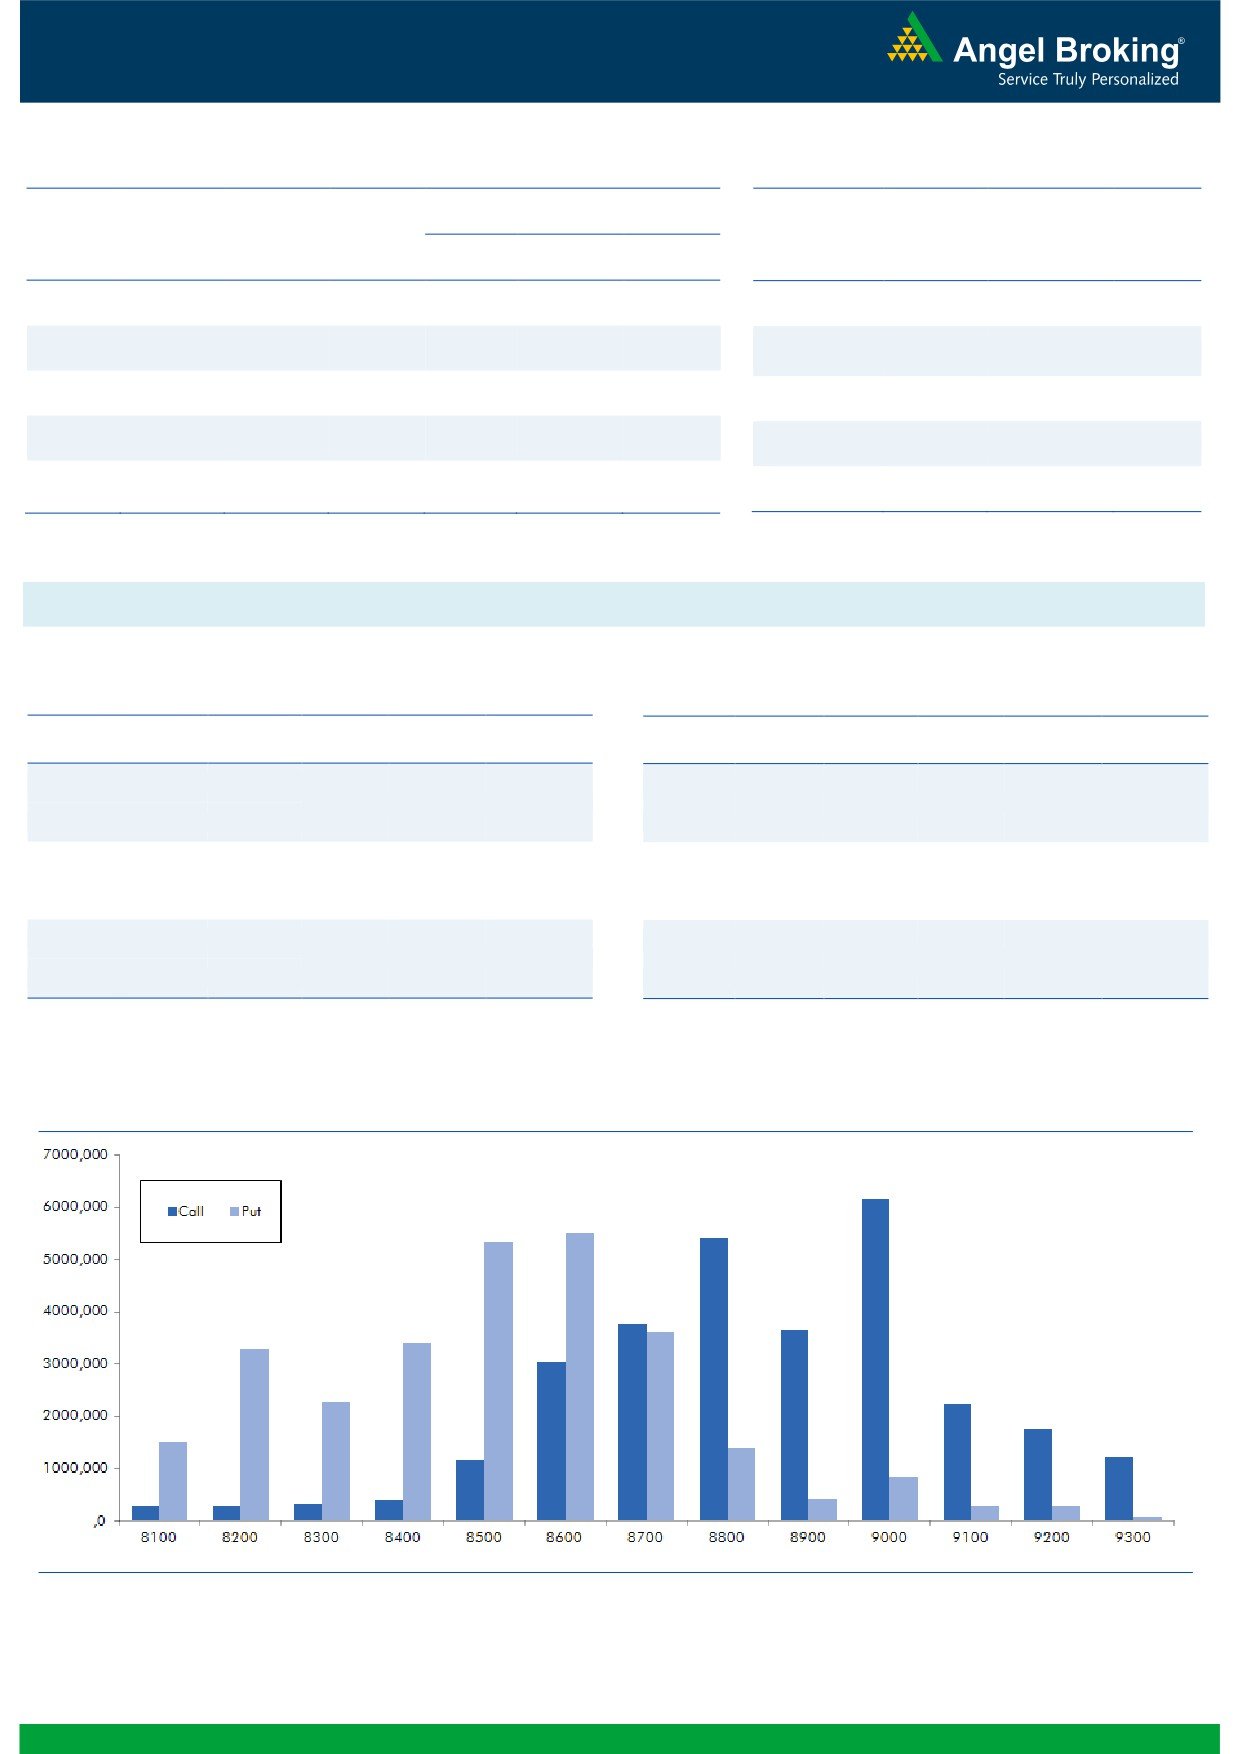
Nifty Vs OI
The Nifty futures open interest has increased by 0.48%
BankNifty futures open interest has decreased by 0.56%
as market closed at 8693.05 levels.
The Nifty October future closed with a premium of 7.30
against the premium of 5.75 points in last trading
session. The November series closed at a premium of
49.00 points.
The Implied Volatility of at the money options has
increased from 11.64% to 12.28%. At the same time, the
PCR-OI of Nifty has increased from 0.98 to 1.00 levels.
The total OI of the market is Rs. 2,83,816/- cr. and the
stock futures OI is Rs. 82,583/- cr.
Few of the liquid counters where we have seen high cost
of carry are CROMPGREAV, IDFCBANK, IDBI, NHPC and
GMRINFRA.
Views
OI Gainers
On Friday, FIIs were net sellers in cash market segment
OI
PRICE
SCRIP
OI
PRICE
CHG. (%)
CHG. (%)
to the tune of Rs. 273 crores. While, in index futures their
NCC
31440000
27.76
92.60
11.90
overall activity was subdued.
RELIANCE
23312500
16.07
1067.80
-2.03
On Index Options front, FIIs bought of worth Rs. 337
ACC
1555600
15.06
1562.55
-3.22
crores with some rise in OI. In call options, we hardlyng.com
TORNTPHARM
401600
11.43
1585.55
-1.49
saw any meaningful open interest additions. However,
BIOCON
4145900
10.27
1009.60
2.93
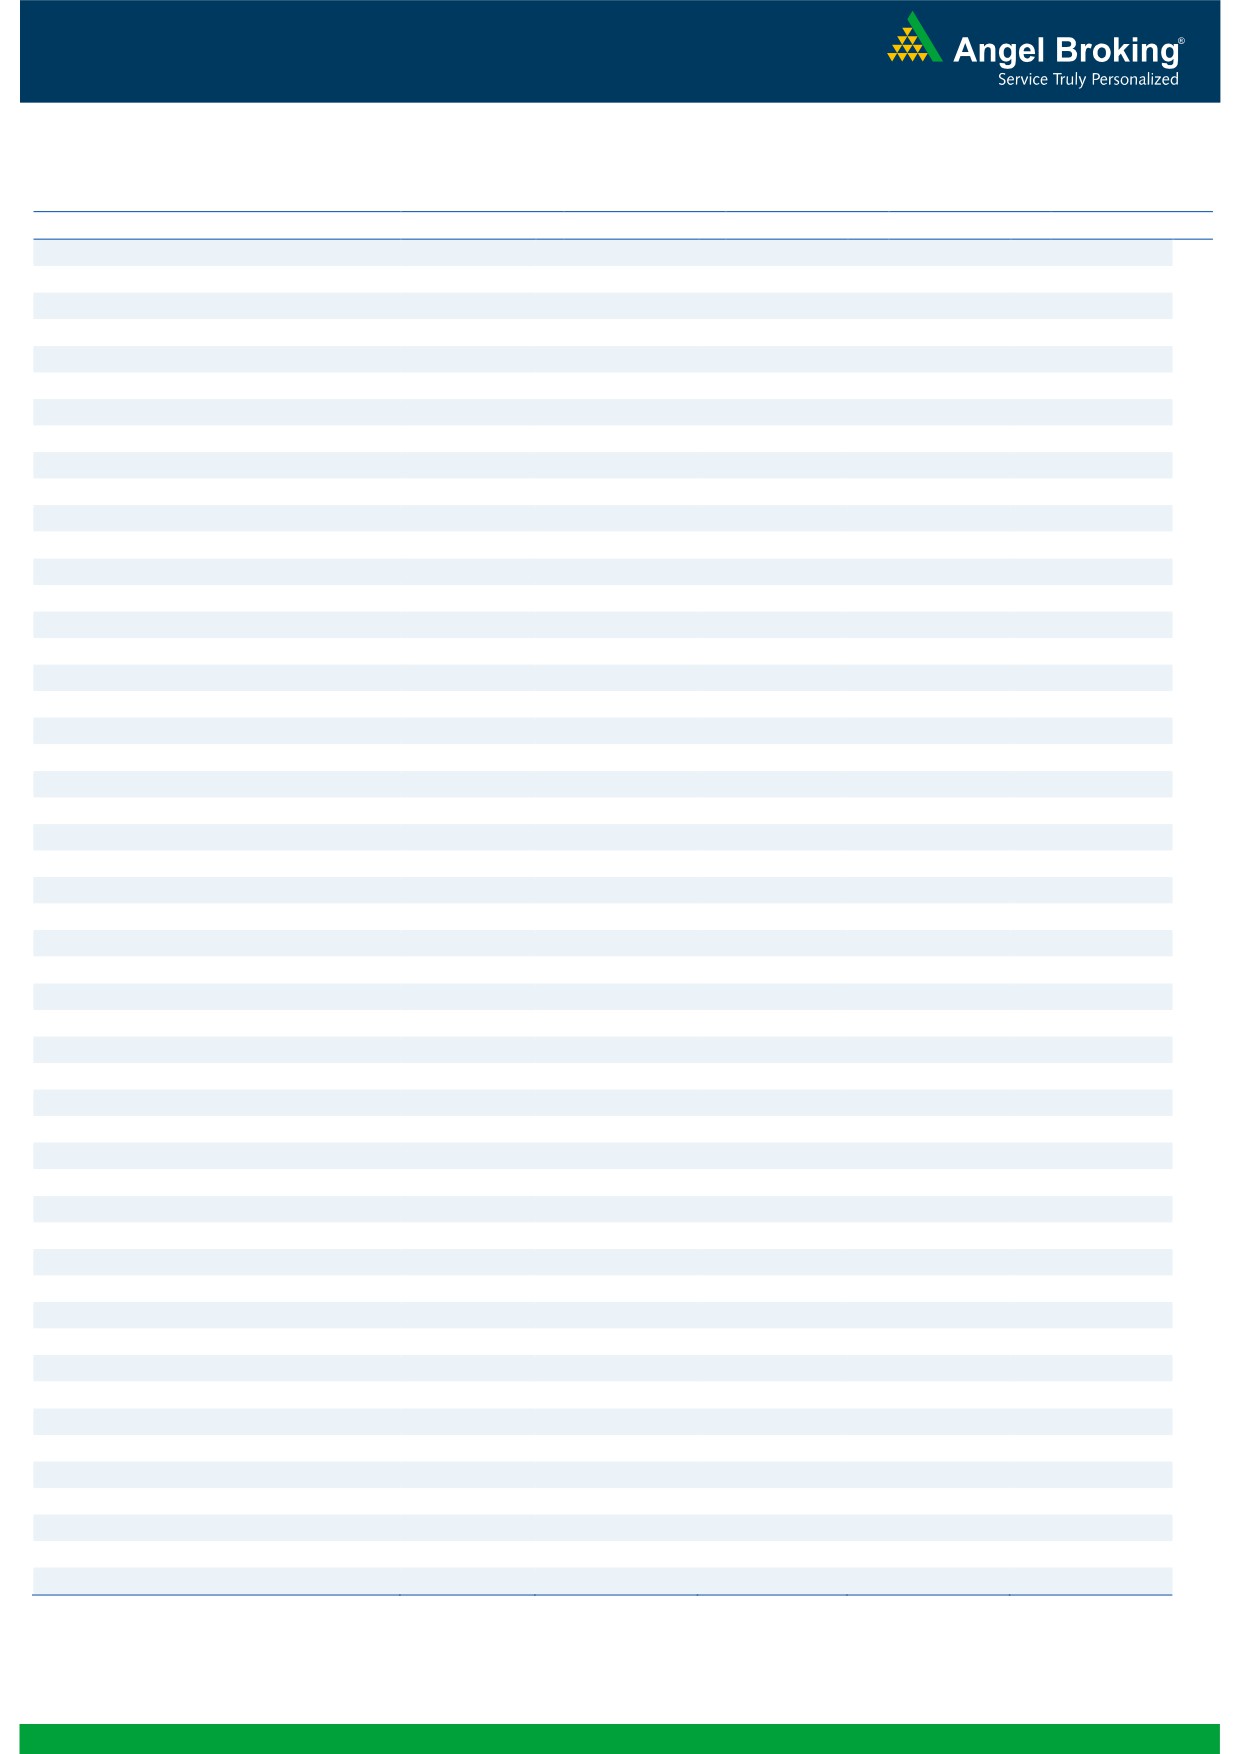
8850 and 9000 strike was comparatively active. On the
TATACOMM
6923000
9.33
680.60
5.95
other hand in put options, 8650 strike added some fresh
MRF
57915
9.10
50603.60
1.27
positions. Maximum OI in October series is placed at
9000 call and of put options has shifted to 8600 strike
TITAN
9967500
8.26
379.70
-2.60
price.
After huge amount of long unwinding in Index Futures;
OI Losers
last week, we witness fresh short formation in Index by
OI
PRICE
SCRIP
OI
PRICE
FIIs. We believe, these short are mainly formed in
CHG. (%)
CHG. (%)
SYNDIBANK
18567000
-6.27
76.25
-0.20
November. We also witness decent amount of writing in
VEDL
41562000
-5.36
203.70
-1.88
8600 put option, which suggests market may take
COLPAL
1945300
-4.67
957.55
1.22
support near these levels for current series. Thus, looking
IOC
28764000
-4.55
324.90
0.79
at the above data, we would suggest traders to avoid
forming any aggressive directional trade in Nifty for
UNIONBANK
13648000
-4.16
147.45
-0.64
October expiry.
CEATLTD
1368500
-4.12
1319.10
0.91
GAIL
6253500
-3.98
440.85
0.26
JUBLFOOD
2158500
-3.94
1100.75
-1.96
Historical Volatility
Put-Call Ratio
SCRIP
HV
SCRIP
PCR-OI
PCR-VOL
NCC
69.40
NIFTY
1.00
0.95
ACC
32.27
BANKNIFTY
1.20
1.06
TATACOMM
59.34
RELIANCE
0.33
0.40
GODREJCP
30.74
INFY
0.53
0.53
CIPLA
27.44
ICICIBANK
1.10
0.66
2
Technical & Derivatives Report
October 24, 2016
FII Statistics for 21, October 2016
Turnover on 21, October 2016
Open Interest
No. of
Turnover
Change
Detail
Buy
Sell
Net
Instrument
Value
Change
Contracts
( in Cr. )
(%)
Contracts
(in Cr.)
(%)
INDEX
INDEX
1107.39
1083.44
23.95
258569
17413.78
0.14
185034
12882.59
-23.15
FUTURES
FUTURES
INDEX
INDEX
29690.36
29353.72
336.65
1139793
76153.57
1.33
3392696
235225.66
-56.50
OPTIONS
OPTIONS
STOCK
7824.27
8091.83
(267.56)
894388
59917.17
0.18
STOCK
FUTURES
619205
44725.76
-0.33
FUTURES
STOCK
STOCK
5472.60
5611.45
(138.86)
123372
8433.15
1.93
OPTIONS
464733
33655.80
-5.78
OPTIONS
TOTAL
44094.63
44140.44
(45.82)
2416122
161917.68
0.80
TOTAL
4661668
326489.81
-48.83
Nifty Spot = 8693.05
Lot Size = 75
Bull-Call Spreads
Bear-Put Spreads
Action
Strike
Price
Risk
Reward
BEP
Action
Strike
Price
Risk
Reward
BEP
Buy
8700
50.90
Buy
8700
50.10
35.40
64.60
8735.40
29.15
70.85
8670.85
Sell
8800
15.50
Sell
8600
20.95
Buy
8700
50.90
Buy
8700
50.10
47.25
152.75
8747.25
41.30
158.70
8658.70
Sell
8900
3.65
Sell
8500
8.80
Buy
8800
15.50
Buy
8600
20.95
11.85
88.15
8811.85
12.15
87.85
8587.85
Sell
8900
3.65
Sell
8500
8.80
Note: Above mentioned Bullish or Bearish Spreads in Nifty (October Series) are given as an information and not as a recommendation.
Nifty Put-Call Analysis
3
Technical & Derivatives Report
October 24, 2016
Daily Pivot Levels for Nifty Constituents
Scrips
S2
S1
PIVOT
R1
R2
ACC
1,497
1,524
1,569
1,596
1,641
ADANIPORTS
279
282
285
289
292
AMBUJACEM
240
243
249
252
257
ASIANPAINT
1,128
1,139
1,156
1,168
1,185
AUROPHARMA
814
817
823
826
831
AXISBANK
515
522
530
537
545
BAJAJ-AUTO
2,766
2,783
2,799
2,816
2,832
BANKBARODA
153
154
156
158
159
BHEL
139
141
142
143
144
BPCL
657
662
667
672
677
BHARTIARTL
303
306
309
312
314
INFRATEL
352
358
364
370
376
BOSCH
22,094
22,367
22,513
22,785
22,931
CIPLA
556
569
583
596
611
COALINDIA
311
312
313
314
315
DRREDDY
3,061
3,087
3,115
3,141
3,169
EICHERMOT
24,668
24,899
25,046
25,278
25,425
GAIL
431
435
442
447
454
GRASIM
956
964
976
984
997
HCLTECH
807
820
834
847
862
HDFCBANK
1,242
1,257
1,265
1,280
1,288
HDFC
1,312
1,324
1,343
1,354
1,373
HEROMOTOCO
3,328
3,344
3,359
3,375
3,390
HINDALCO
148
150
153
155
157
HINDUNILVR
832
841
846
855
860
ICICIBANK
271
274
277
280
283
IDEA
76
78
79
81
82
INDUSINDBK
1,194
1,209
1,217
1,232
1,240
INFY
1,015
1,026
1,034
1,045
1,052
ITC
238
239
240
241
242
KOTAKBANK
764
772
778
786
791
LT
1,484
1,496
1,505
1,517
1,526
LUPIN
1,477
1,487
1,503
1,513
1,529
M&M
1,316
1,322
1,326
1,331
1,335
MARUTI
5,589
5,617
5,643
5,671
5,697
NTPC
148
149
149
150
150
ONGC
274
276
279
281
284
POWERGRID
174
176
178
179
181
RELIANCE
1,034
1,049
1,073
1,087
1,111
SBIN
254
256
258
260
262
SUNPHARMA
737
742
746
750
754
TCS
2,388
2,407
2,417
2,436
2,447
TATAMTRDVR
352
354
357
360
363
TATAMOTORS
537
541
545
549
554
TATAPOWER
81
82
83
84
84
TATASTEEL
419
423
426
429
432
TECHM
417
425
430
439
444
ULTRACEMCO
3,910
3,945
3,985
4,020
4,060
WIPRO
490
495
498
503
506
YESBANK
1,289
1,304
1,312
1,327
1,335
ZEEL
512
518
523
529
534
4
Technical & Derivatives Report
October 24, 2016
Research Team Tel: 022 - 39357800
For Technical Queries
For Derivatives Queries
DISCLAIMER
Angel Broking Private Limited (hereinafter referred to as “Angel”) is a registered Member of National Stock Exchange of India Limited,
Bombay Stock Exchange Limited and Metropolitan Stock Exchange Limited. It is also registered as a Depository Participant with CDSL
and Portfolio Manager with SEBI. It also has registration with AMFI as a Mutual Fund Distributor. Angel Broking Private Limited is a
registered entity with SEBI for Research Analyst in terms of SEBI (Research Analyst) Regulations, 2014 vide registration number
INH000000164. Angel or its associates has not been debarred/ suspended by SEBI or any other regulatory authority for accessing
/dealing in securities Market. Angel or its associates/analyst has not received any compensation / managed or co-managed public
offering of securities of the company covered by Analyst during the past twelve months.
This document is solely for the personal information of the recipient, and must not be singularly used as the basis of any investment
decision. Nothing in this document should be construed as investment or financial advice. Each recipient of this document should
make such investigations as they deem necessary to arrive at an independent evaluation of an investment in the securities of the
companies referred to in this document (including the merits and risks involved), and should consult their own advisors to determine
the merits and risks of such an investment.
Reports based on technical and derivative analysis center on studying charts of a stock's price movement, outstanding positions and
trading volume, as opposed to focusing on a company's fundamentals and, as such, may not match with a report on a company's
fundamentals. Investors are advised to refer the Fundamental and Technical Research Reports available on our website to evaluate the
contrary view, if any.
The information in this document has been printed on the basis of publicly available information, internal data and other reliable
sources believed to be true, but we do not represent that it is accurate or complete and it should not be relied on as such, as this
document is for general guidance only. Angel Broking Pvt. Limited or any of its affiliates/ group companies shall not be in any way
responsible for any loss or damage that may arise to any person from any inadvertent error in the information contained in this report.
Angel Broking Pvt. Limited has not independently verified all the information contained within this document. Accordingly, we cannot
testify, nor make any representation or warranty, express or implied, to the accuracy, contents or data contained within this document.
While Angel Broking Pvt. Limited endeavors to update on a reasonable basis the information discussed in this material, there may be
regulatory, compliance, or other reasons that prevent us from doing so.
This document is being supplied to you solely for your information, and its contents, information or data may not be reproduced,
redistributed or passed on, directly or indirectly.
Neither Angel Broking Pvt. Limited, nor its directors, employees or affiliates shall be liable for any loss or damage that may arise from
or in connection with the use of this information.
5