Technical & Derivatives Report
June 24, 2016
Sensex (27002) / Nifty (8270)
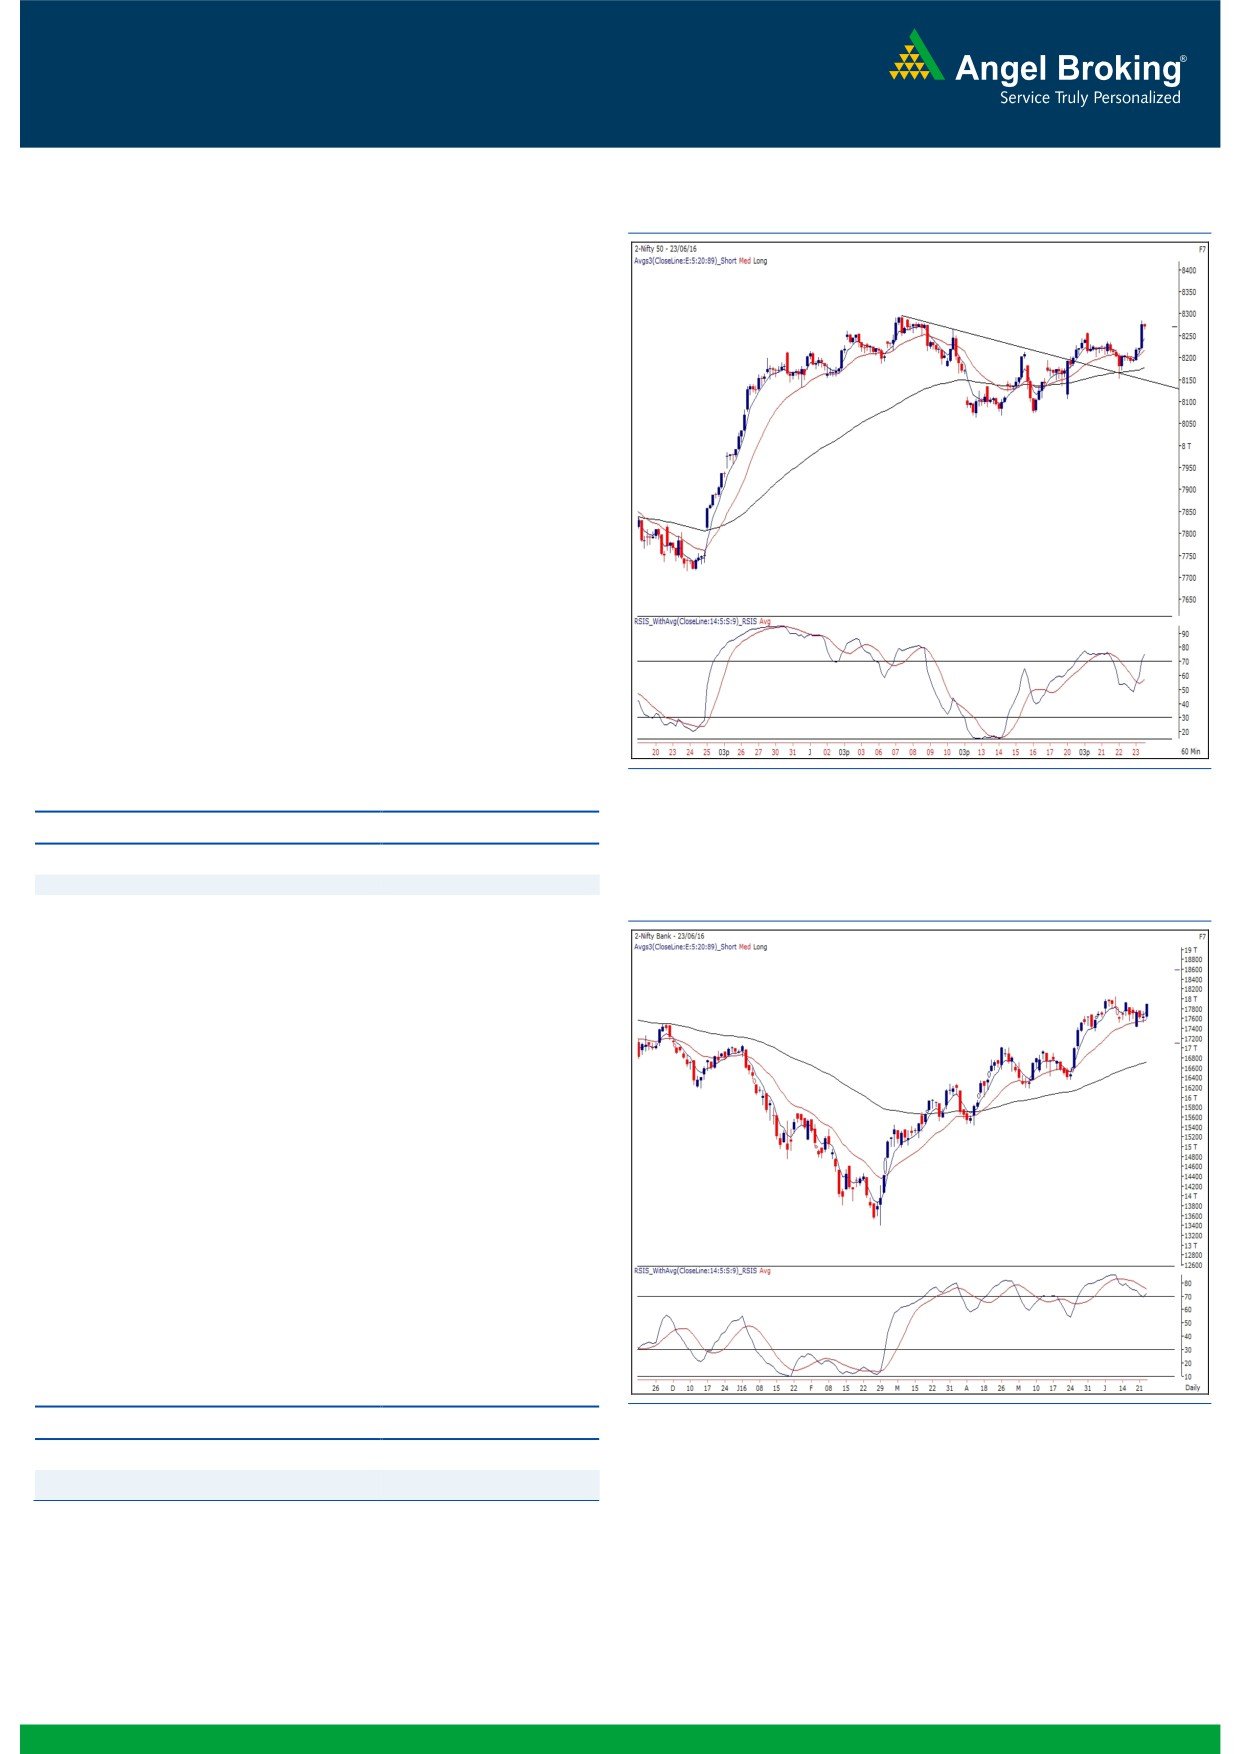
Exhibit 1: Nifty Hourly Chart
Yesterday, our markets opened on a flat note citing to muted
global cues and remained sideways in first half. However, a flurry
of buying interest in the latter half pushed the index higher to post
a strong close well above the 8250 mark.
In our earlier report, we had mentioned about the ‘Inverse Head
and Shoulder’ pattern on hourly chart and as expected,
Wednesday’s corrective move proved out to be a pull back before
yesterday’s thrust. Technically speaking, yesterday’s tail end
surge seems very encouraging for our markets; indicating
possibility of a breakout from the next hurdle of 8336. However,
traders should keep a note that the final verdict on Brexit would
be out in the initial hour of trading. This important global event
may set the tone for the global as well as our markets. A positive
outcome may lead to a breakout from the mentioned resistance
and a disappointment would result into some strong selling in the
market. An immediate support levels would be seen at 8150 -
8060 levels. Keeping this event aside, we maintain our positive
stance on the market with a positional perspective.
Key Levels
Support 1 - 8150
Resistance 1 - 8336
Support 2 - 8060
Resistance 2 - 8400
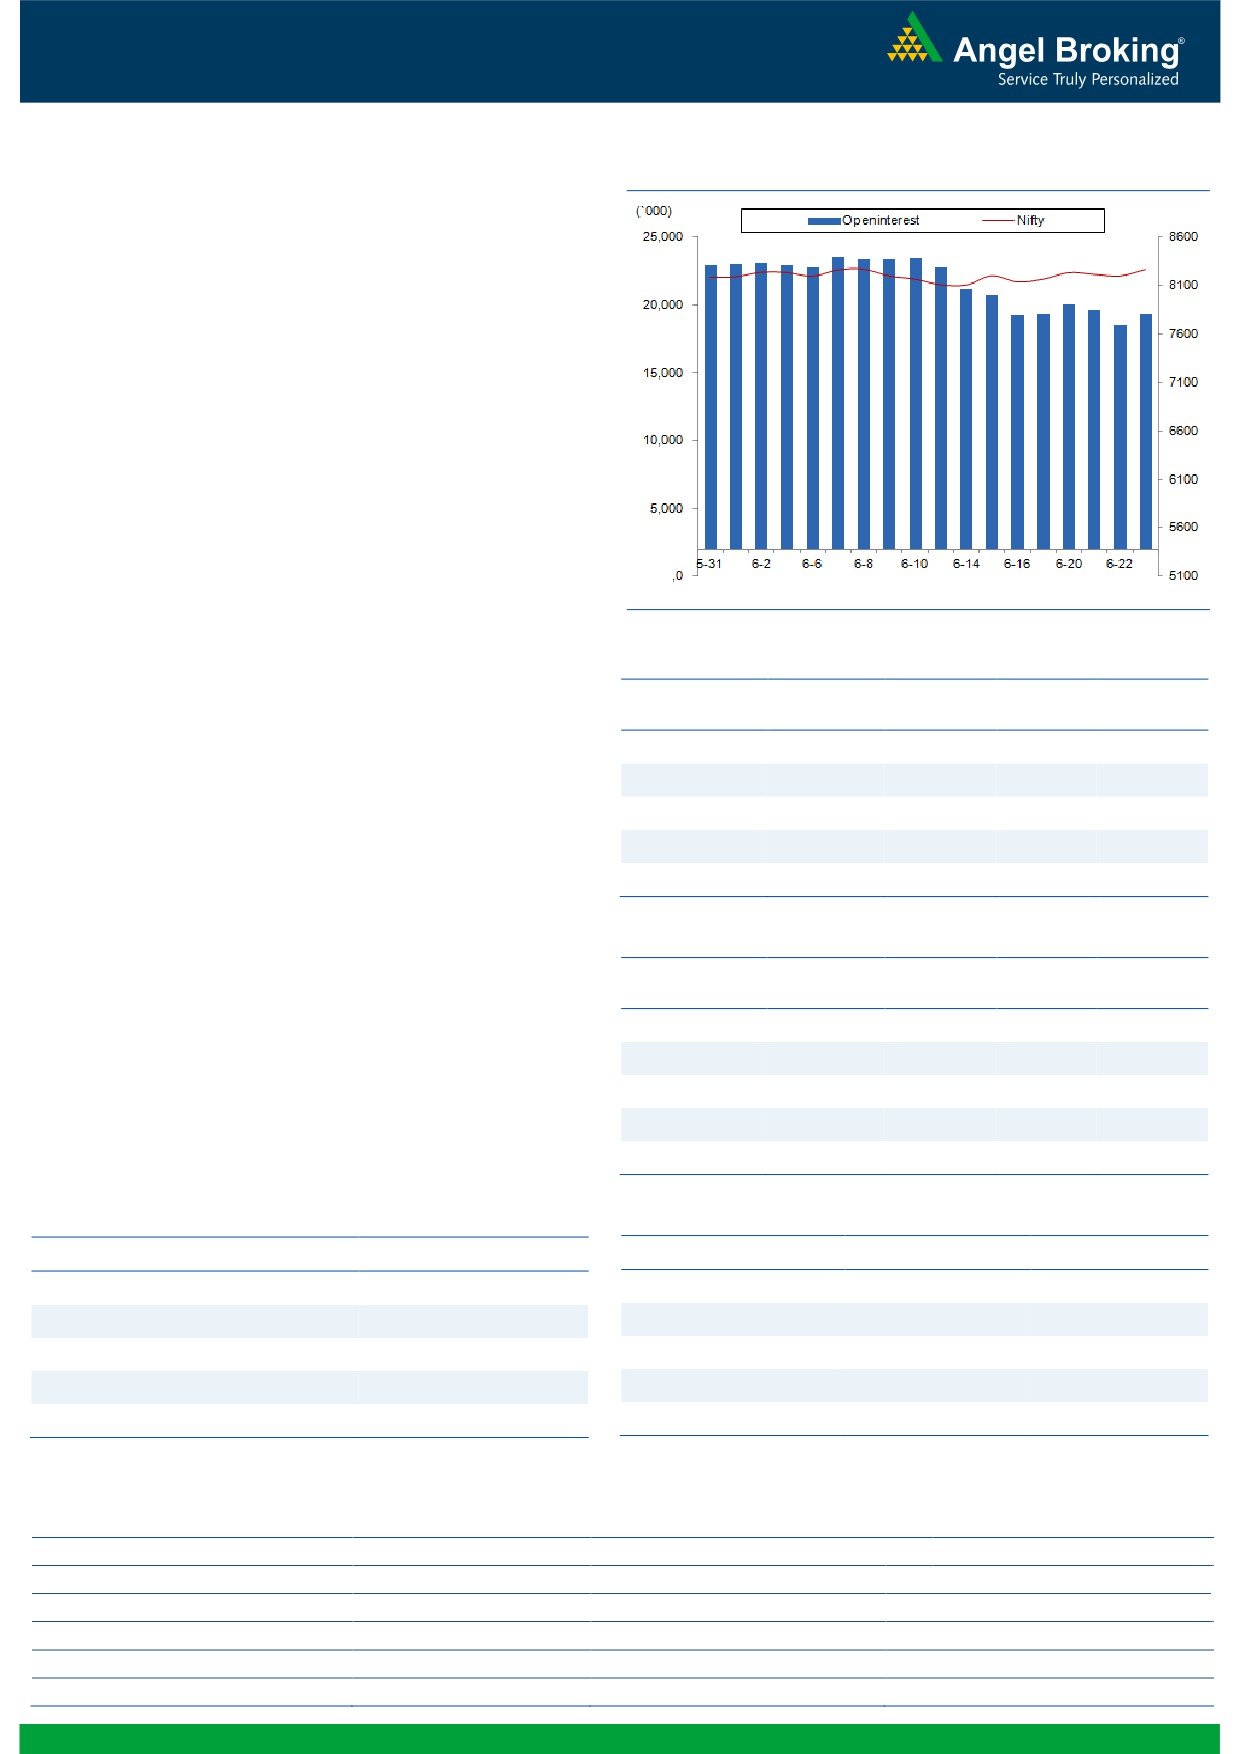
Exhibit 2: Nifty Bank Daily Chart
Nifty Bank Outlook - (17892)
Although the Nifty Bank index opened on a flat note yesterday,
the positive momentum picked up in latter half and eventually,
ended the session with gains of 1.51% over its previous close.
We have been mentioning since past few days that the Nifty Bank
index is trading in a range of 17350-18050 and only a breakout
from this range will lead to a directional momentum. On the
outcome of Britain's EU referendum on 'Brexit', global markets
could see intense volatility, which could lead to breakout from the
range on either side. Traders are hence advised to wait patiently
and watch market’s reaction till today’s closing. Breakout from
the mentioned range could lead to directional momentum in near
term. Intraday supports for the index are placed around 17530
and 17350; whereas, resistances are seen around 18050 and
18220.
Key Levels
Support 1 - 17530
Resistance 1 - 18050
Support 2 - 17350
Resistance 2 - 18220
1
Technical & Derivatives Report
June 24, 2016
Comments
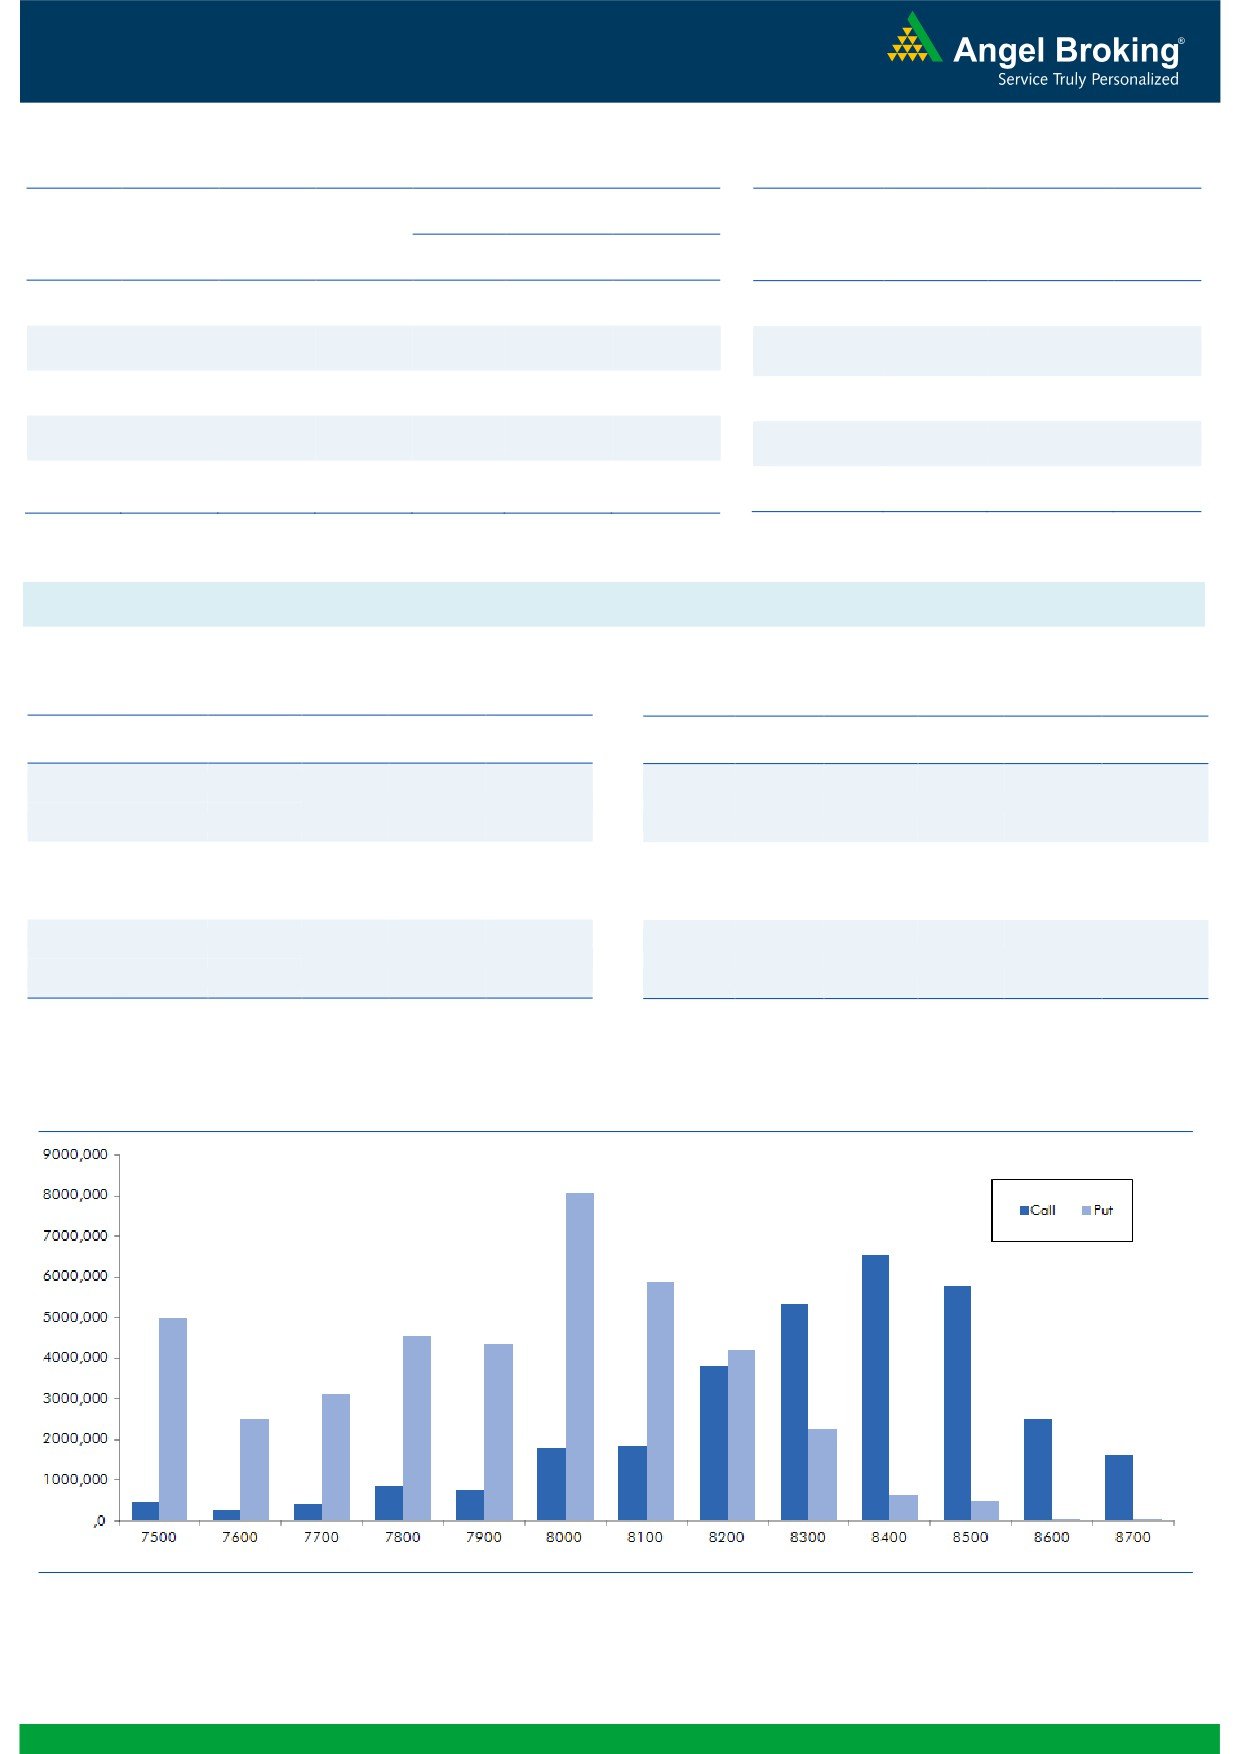
Nifty Vs OI
The Nifty futures open interest has increased by 4.47%
BankNifty futures open interest has increased by 4.25%
as market closed at 8270.45 levels.
The Nifty June future closed with a premium of 11.80
points against a premium of 1.35 points in previous
session. The July series closed at a premium of 39.65
points.
The Implied Volatility of at the money options has
increased from 20.94% to 21.69%.
The total OI of the market is Rs. 2,70,484/- cr. and the
stock futures OI is Rs. 68,270/- cr.
Few of the liquid counters where we have seen high cost
of carry are UNITECH, JPASSOCIAT, IBREALEST,
ADANIENT and INDUSINDBK.
Views
OI Gainers
FIIs activity in cash market segment was subdued. While
OI
PRICE
in Index Futures, they bought worth Rs. 320 crores with
SCRIP
OI
PRICE
CHG. (%)
CHG. (%)
rise in open interest, indicating fresh long formation in
INFRATEL
8652300
18.51
323.20
-4.87
last trading session.
ALBK
13338000
8.93
63.30
6.03
On Index Options front, FIIs sold worth Rs. 390 crores
RCOM
143782000
8.48
49.85
4.18
with rise in open interest. In Call option, out of the
money strikes, 8400-8700 were active and they also
STAR
1270100
8.33
1070.15
0.31
added fresh positions. While in Put option, OI addition
JSWENERGY
15758000
7.21
81.00
1.69
was seen in 8200 strike; while out of the money strikes
7800 strike also added some OI. Maximum OI in June
OI Losers
series has shifted to 8400 from 8300 call and of put
OI
PRICE
SCRIP
OI
PRICE
options is still intact in 8000 strike price.
CHG. (%)
CHG. (%)
FIIs were continuously unwinding their long positions in
HEXAWARE
5450000
-12.74
233.10
4.79
Index and thus most of the longs are now out of the
IOB
6566000
-9.81
27.10
0.56
system. Nifty is light in terms of OI now, we would like to
JETAIRWAYS
5897500
-7.76
558.90
-1.01
wait for any meaningful direction position. We advise
ARVIND
5364600
-6.97
322.50
-0.74
traders to remain light on positions and avoid taking
IGL
2509100
-6.25
607.80
0.12
undue risk on the event ‘EU Referendum on Brexit’.
Historical Volatility
Put-Call Ratio
SCRIP
HV
SCRIP
PCR-OI
PCR-VOL
HEXAWARE
38.41
NIFTY
1.18
1.06
JISLJALEQS
38.21
BANKNIFTY
1.30
0.96
INFRATEL
46.08
SBIN
0.99
0.78
YESBANK
27.44
TATAMOTORS
0.95
0.68
ALBK
56.07
RELIANCE
0.50
0.49
Strategy Date
Symbol
Strategy
Status
May 30, 2016
TCS
Ratio Bull Call Spread
Active
June 06, 2016
NIFTY
Long Call
Exited at Cost
June 13, 2016
ONGC
Ratio Bull Call Spread
Active
June 20, 2016
MARUTI
Long Call Ladder
Active
2
Technical & Derivatives Report
June 24, 2016
FII Statistics for 23-June 2016
Turnover on 23-June 2016
Open Interest
No. of
Turnover
Change
Detail
Buy
Sell
Net
Instrument
Value
Contracts
( in Cr. )
(%)
Contracts
Change (%)
(in Cr.)
INDEX
INDEX
2249.57
1929.51
320.06
235142
14251.98
3.18
281444
16499.32
9.95
FUTURES
FUTURES
INDEX
INDEX
23700.38
23055.00
645.38
1250298
76649.29
2.96
5100787
292365.16
45.07
OPTIONS
OPTIONS
STOCK
5743.53
5381.24
362.28
1085037
54882.28
(0.69)
STOCK
FUTURES
537379
28498.16
5.47
FUTURES
STOCK
STOCK
4005.53
4203.93
(198.39)
124637
6662.10
4.58
OPTIONS
368633
20271.23
15.36
OPTIONS
TOTAL
35699.01
34569.68
1129.32
2695114
152445.64
1.55
TOTAL
6288243
357633.87
36.96
Nifty Spot = 8270.45
Lot Size = 75
Bull-Call Spreads
Bear-Put Spreads
Action
Strike
Price
Risk
Reward
BEP
Action
Strike
Price
Risk
Reward
BEP
Buy
8300
88.30
Buy
8300
106.40
42.45
57.55
8342.45
37.95
62.05
8262.05
Sell
8400
45.85
Sell
8200
68.45
Buy
8300
88.30
Buy
8300
106.40
67.90
132.10
8367.90
62.85
137.15
8237.15
Sell
8500
20.40
Sell
8100
43.55
Buy
8400
45.85
Buy
8200
68.45
25.45
74.55
8425.45
24.90
75.10
8175.10
Sell
8500
20.40
Sell
8100
43.55
Note: Above mentioned Bullish or Bearish Spreads in Nifty (June Series) are given as an information and not as a recommendation.
Nifty Put-Call Analysis
3
Technical & Derivatives Report
June 24, 2016
Daily Pivot Levels for Nifty Constituents
Scrips
S2
S1
PIVOT
R1
R2
ACC
1,559
1,565
1,572
1,579
1,586
ADANIPORTS
203
205
207
209
211
AMBUJACEM
240
245
248
253
256
ASIANPAINT
975
980
985
989
995
AUROPHARMA
714
720
725
730
735
AXISBANK
510
518
523
531
536
BAJAJ-AUTO
2,575
2,613
2,640
2,678
2,705
BANKBARODA
148
150
152
154
156
BHEL
118
120
122
124
126
BPCL
992
1,008
1,019
1,035
1,047
BHARTIARTL
360
363
364
366
368
INFRATEL
310
316
327
333
344
BOSCH
21,487
21,669
21,792
21,973
22,096
CIPLA
469
473
478
481
486
COALINDIA
315
316
318
319
320
DRREDDY
3,082
3,127
3,153
3,198
3,224
EICHERMOT
18,495
18,577
18,682
18,765
18,870
GAIL
368
372
374
378
380
GRASIM
4,254
4,277
4,293
4,316
4,333
HCLTECH
758
764
768
774
778
HDFCBANK
1,159
1,174
1,183
1,199
1,208
HDFC
1,220
1,233
1,241
1,254
1,262
HEROMOTOCO
3,014
3,039
3,061
3,085
3,107
HINDALCO
121
122
123
125
126
HINDUNILVR
847
858
866
877
884
ICICIBANK
234
237
239
243
245
IDEA
101
101
102
102
103
INDUSINDBK
1,076
1,090
1,100
1,114
1,125
INFY
1,185
1,198
1,207
1,220
1,228
ITC
352
356
359
363
365
KOTAKBANK
733
740
745
752
757
LT
1,459
1,479
1,493
1,513
1,528
LUPIN
1,455
1,470
1,483
1,498
1,510
M&M
1,350
1,362
1,371
1,384
1,393
MARUTI
4,100
4,134
4,155
4,189
4,209
NTPC
145
147
148
151
152
ONGC
212
215
217
221
223
POWERGRID
151
154
156
159
161
RELIANCE
965
973
977
985
989
SBIN
211
214
216
219
221
SUNPHARMA
736
744
751
759
766
TCS
2,609
2,627
2,643
2,661
2,678
TATAMTRDVR
311
315
318
322
325
TATAMOTORS
471
479
485
493
498
TATAPOWER
70
72
73
75
77
TATASTEEL
324
329
333
337
341
TECHM
523
527
531
535
539
ULTRACEMCO
3,280
3,309
3,329
3,358
3,379
WIPRO
557
560
563
566
568
YESBANK
1,062
1,086
1,101
1,125
1,139
ZEEL
442
445
449
452
457
4
Technical & Derivatives Report
June 24, 2016
Research Team Tel: 022 - 39357800
For Technical Queries
For Derivatives Queries
DISCLAIMER
Angel Broking Private Limited (hereinafter referred to as “Angel”) is a registered Member of National Stock Exchange of India Limited,
Bombay Stock Exchange Limited and MCX Stock Exchange Limited. It is also registered as a Depository Participant with CDSL and
Portfolio Manager with SEBI. It also has registration with AMFI as a Mutual Fund Distributor. Angel Broking Private Limited is a
registered entity with SEBI for Research Analyst in terms of SEBI (Research Analyst) Regulations, 2014 vide registration number
INH000000164. Angel or its associates has not been debarred/ suspended by SEBI or any other regulatory authority for accessing
/dealing in securities Market. Angel or its associates including its relatives/analyst do not hold any financial interest/beneficial
ownership of more than 1% in the company covered by Analyst. Angel or its associates/analyst has not received any compensation /
managed or co-managed public offering of securities of the company covered by Analyst during the past twelve months. Angel/analyst
has not served as an officer, director or employee of company covered by Analyst and has not been engaged in market making activity
of the company covered by Analyst.
This document is solely for the personal information of the recipient, and must not be singularly used as the basis of any investment
decision. Nothing in this document should be construed as investment or financial advice. Each recipient of this document should
make such investigations as they deem necessary to arrive at an independent evaluation of an investment in the securities of the
companies referred to in this document (including the merits and risks involved), and should consult their own advisors to determine
the merits and risks of such an investment.
Reports based on technical and derivative analysis center on studying charts of a stock's price movement, outstanding positions and
trading volume, as opposed to focusing on a company's fundamentals and, as such, may not match with a report on a company's
fundamentals.
The information in this document has been printed on the basis of publicly available information, internal data and other reliable
sources believed to be true, but we do not represent that it is accurate or complete and it should not be relied on as such, as this
document is for general guidance only. Angel Broking Pvt. Limited or any of its affiliates/ group companies shall not be in any way
responsible for any loss or damage that may arise to any person from any inadvertent error in the information contained in this report.
Angel Broking Pvt. Limited has not independently verified all the information contained within this document. Accordingly, we cannot
testify, nor make any representation or warranty, express or implied, to the accuracy, contents or data contained within this document.
While Angel Broking Pvt. Limited endeavors to update on a reasonable basis the information discussed in this material, there may be
regulatory, compliance, or other reasons that prevent us from doing so.
This document is being supplied to you solely for your information, and its contents, information or data may not be reproduced,
redistributed or passed on, directly or indirectly.
Neither Angel Broking Pvt. Limited, nor its directors, employees or affiliates shall be liable for any loss or damage that may arise from
or in connection with the use of this information.
Note: Please refer to the important ‘Stock Holding Disclosure' report on the Angel website (Research Section). Also, please refer to the
latest update on respective stocks for the disclosure status in respect of those stocks. Angel Broking Pvt. Limited and its affiliates may
have investment positions in the stocks recommended in this report.
5