Technical & Derivatives Report
November 23, 2016
Sensex (25961) / Nifty (8002)
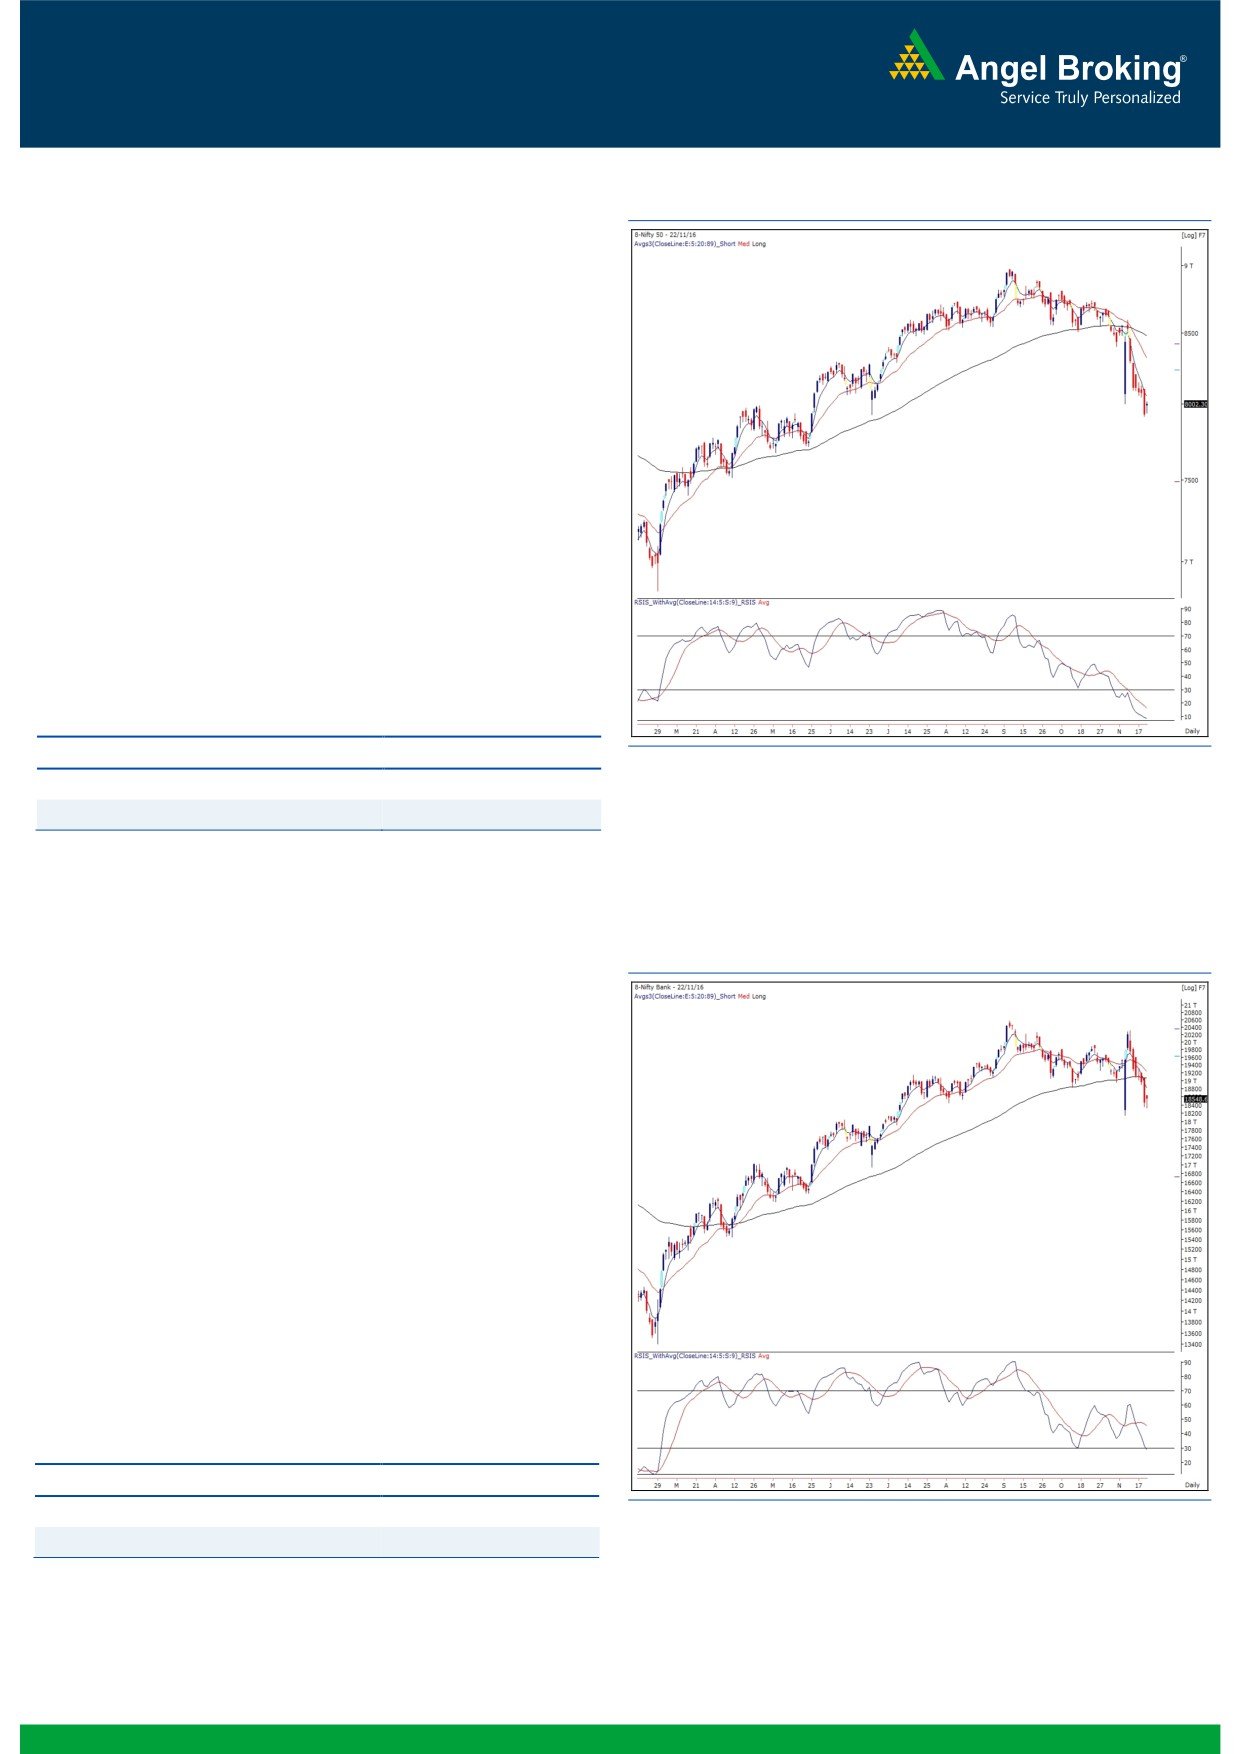
Exhibit 1: Nifty Daily Chart
Finally after six days of relentless selling, we witnessed some
respite in our market as the Nifty opened higher and then
managed to close with decent gains above the 8000 mark.
During the day, we witnessed higher volatility in the market. The
Nifty first corrected sharply from morning highs; but due to strong
buying at lower levels, the Nifty managed regain the strength. If
we refer to our earlier report, we had clearly stated the possibility
of a bounce. The 'RSI-Smoothened' oscillator hit the lowest point
in last 5 years. In addition, if we combine last two candles on
daily chart, we can observe a 'Bullish Harami' pattern. Thus, we
expect the Nifty to continue this bounce back towards 8120 -
8280 in the near term. The support is now seen at 7940 - 7900.
Traders need to understand that the market has undergone a
decent price-wise correction and now, we expect a time-correction
within the broad range for some time.
Key Levels
Support 1 - 7940
Resistance 1 - 8120
Support 2 - 7900
Resistance 2 - 8280
Nifty Bank Outlook - (18549)
Exhibit 2: Nifty Bank Daily Chart
In yesterday's session, the Nifty Bank index opened marginally
higher and continued its corrective move post opening. Although
the index traded in red for most part of the session, a swift
recovery in last hour of trade led to the index posting minor gains
of 0.55 percent over its previous session's close.
The pullback move in last hour of trade mainly seemed due to the
oversold momentum readings seen in lower time frame charts.
Although yesterday's session resembles a small body (narrow
range) candle, the momentum readings are indicating higher
probability of a pullback move. Also, the volatility is expected to
remain high owing to the F&O expiry slated on upcoming
Thursday. Traders are hence advised to focus on stock specific
moves and expect a pullback move in the index upto 18800-
18900 in near term. The intraday supports for the Nifty Bank
index are placed around 18320 and 18145 whereas resistances
are seen around 18795 and 18955.
Key Levels
Support 1 - 18320
Resistance 1 - 18795
Support 2 - 18145
Resistance 2 - 18955
1
Technical & Derivatives Report
November 23, 2016
Comments
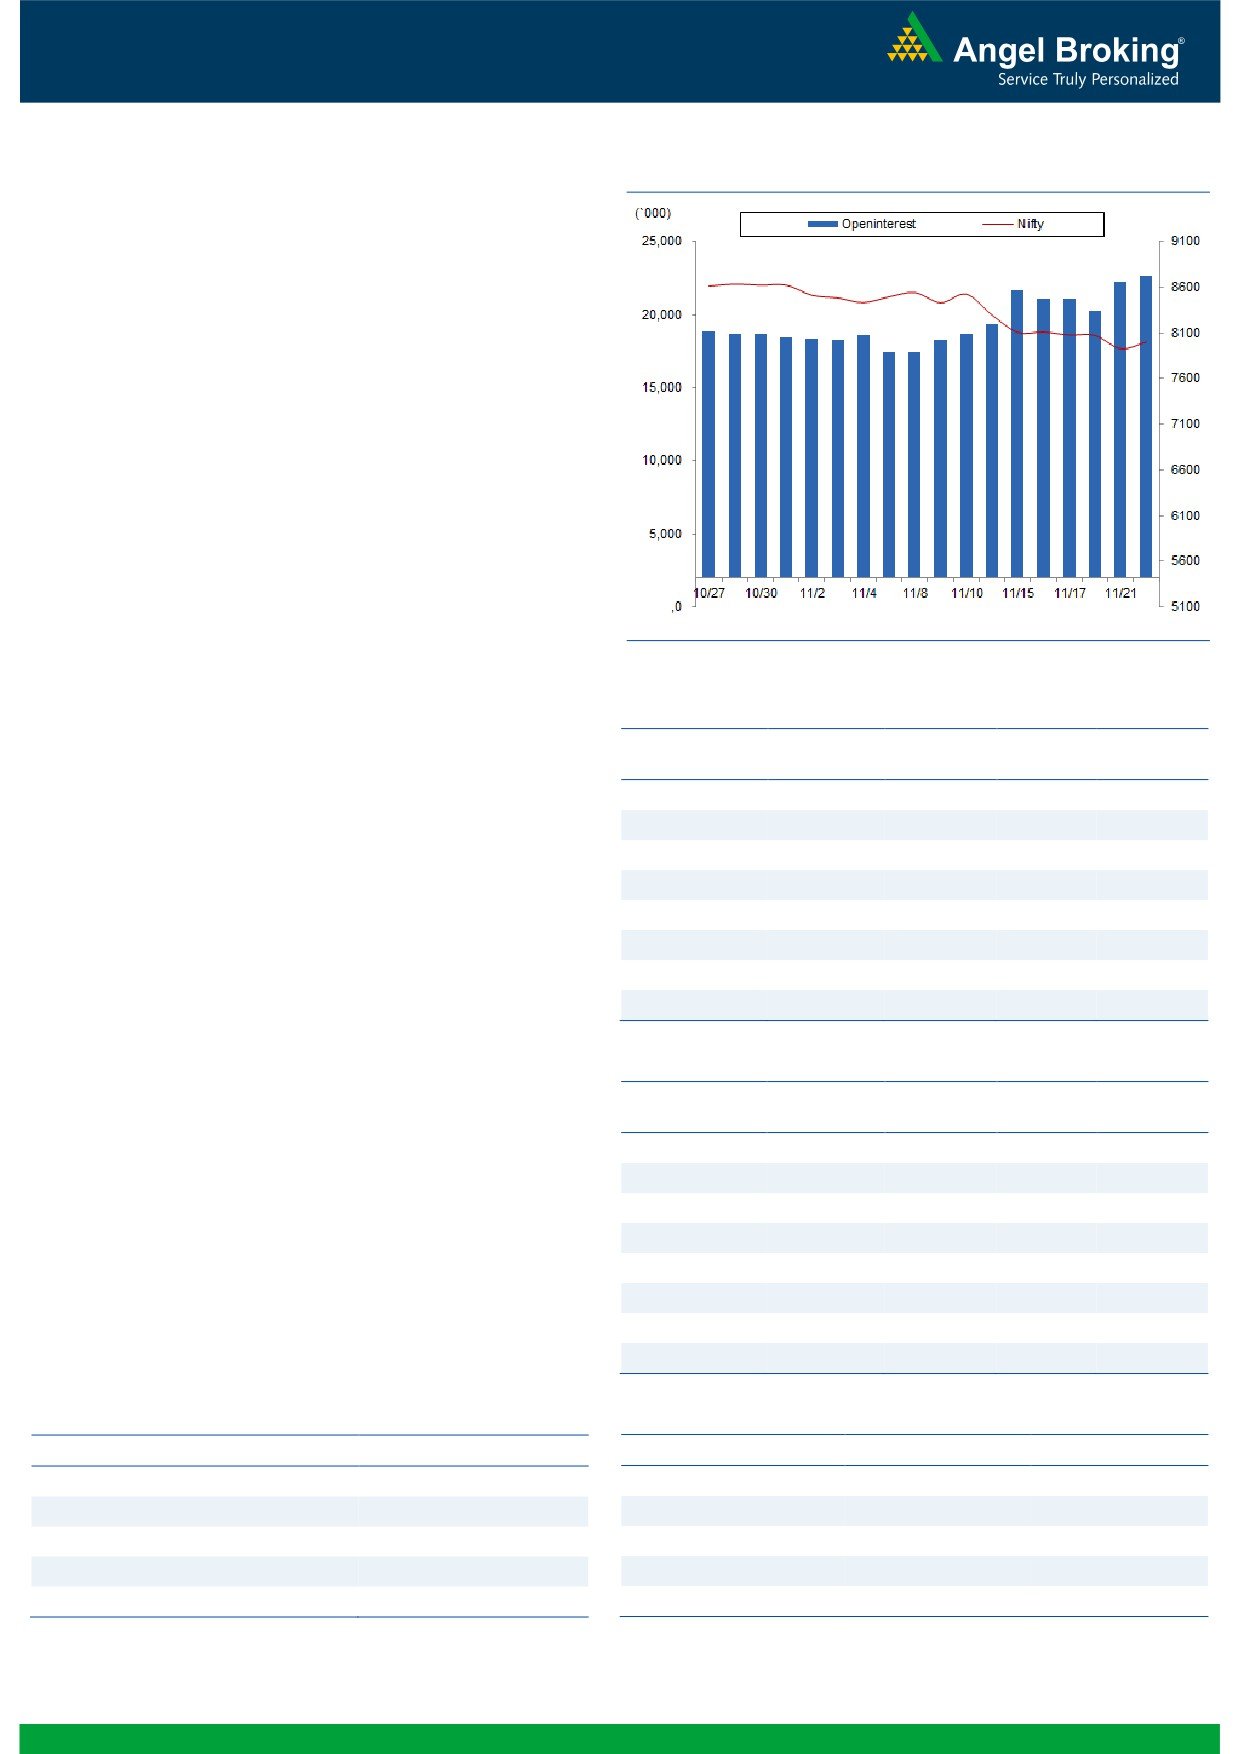
Nifty Vs OI
The Nifty futures open interest has increased by 1.85%
BankNifty futures open interest has increased by 4.43%
as market closed at 8002.30 levels.
The Nifty November future closed with a premium of
4.50 against the premium of 10.10 points in last trading
session. The December series closed at a premium of
42.65 points.
The Implied Volatility of at the money options has
decreased from 19.46% to 18.89%. At the same time,
the PCR-OI of Nifty has increased from 0.69 to 0.71
levels.
The total OI of the market is Rs. 2,93,186/- cr. and the
stock futures OI is Rs. 71,112/- cr.
Few of the liquid counters where we have seen high cost
of carry are JPASSOCIAT, IDEA, TORNTPOWER,
GODREJCP and EICHERMOT.
Views
OI Gainers
OI
PRICE
FIIs continue their selling streak in cash market segment;
SCRIP
OI
PRICE
CHG. (%)
CHG. (%)
they sold equities worth Rs. 693 crores. While, in index
VEDL
48935500
18.47
206.90
5.16
futures, they were net buyers worth Rs. 371 crores with
OIL
996200
18.15
425.95
2.47
significant rise in open interest, indicating blend of long
GMRINFRA
224775000
17.89
11.05
0.45
and short formation; wherein, more are on long side.roking.com
ENGINERSIN
6513500
14.81
275.40
1.64
In Index options segment, FII were net seller worth
ULTRACEMCO
1577400
13.74
3414.75
2.95
Rs. 317 crores with marginal change in open interest. In
GODREJIND
1702500
12.27
381.40
2.40
call options, except some OI build-up in 8150 strike, we
CESC
1885400
11.59
574.10
-0.79
didn’t witness any significant build-up in any strikes;
DRREDDY
1873400
11.26
3124.75
-0.51
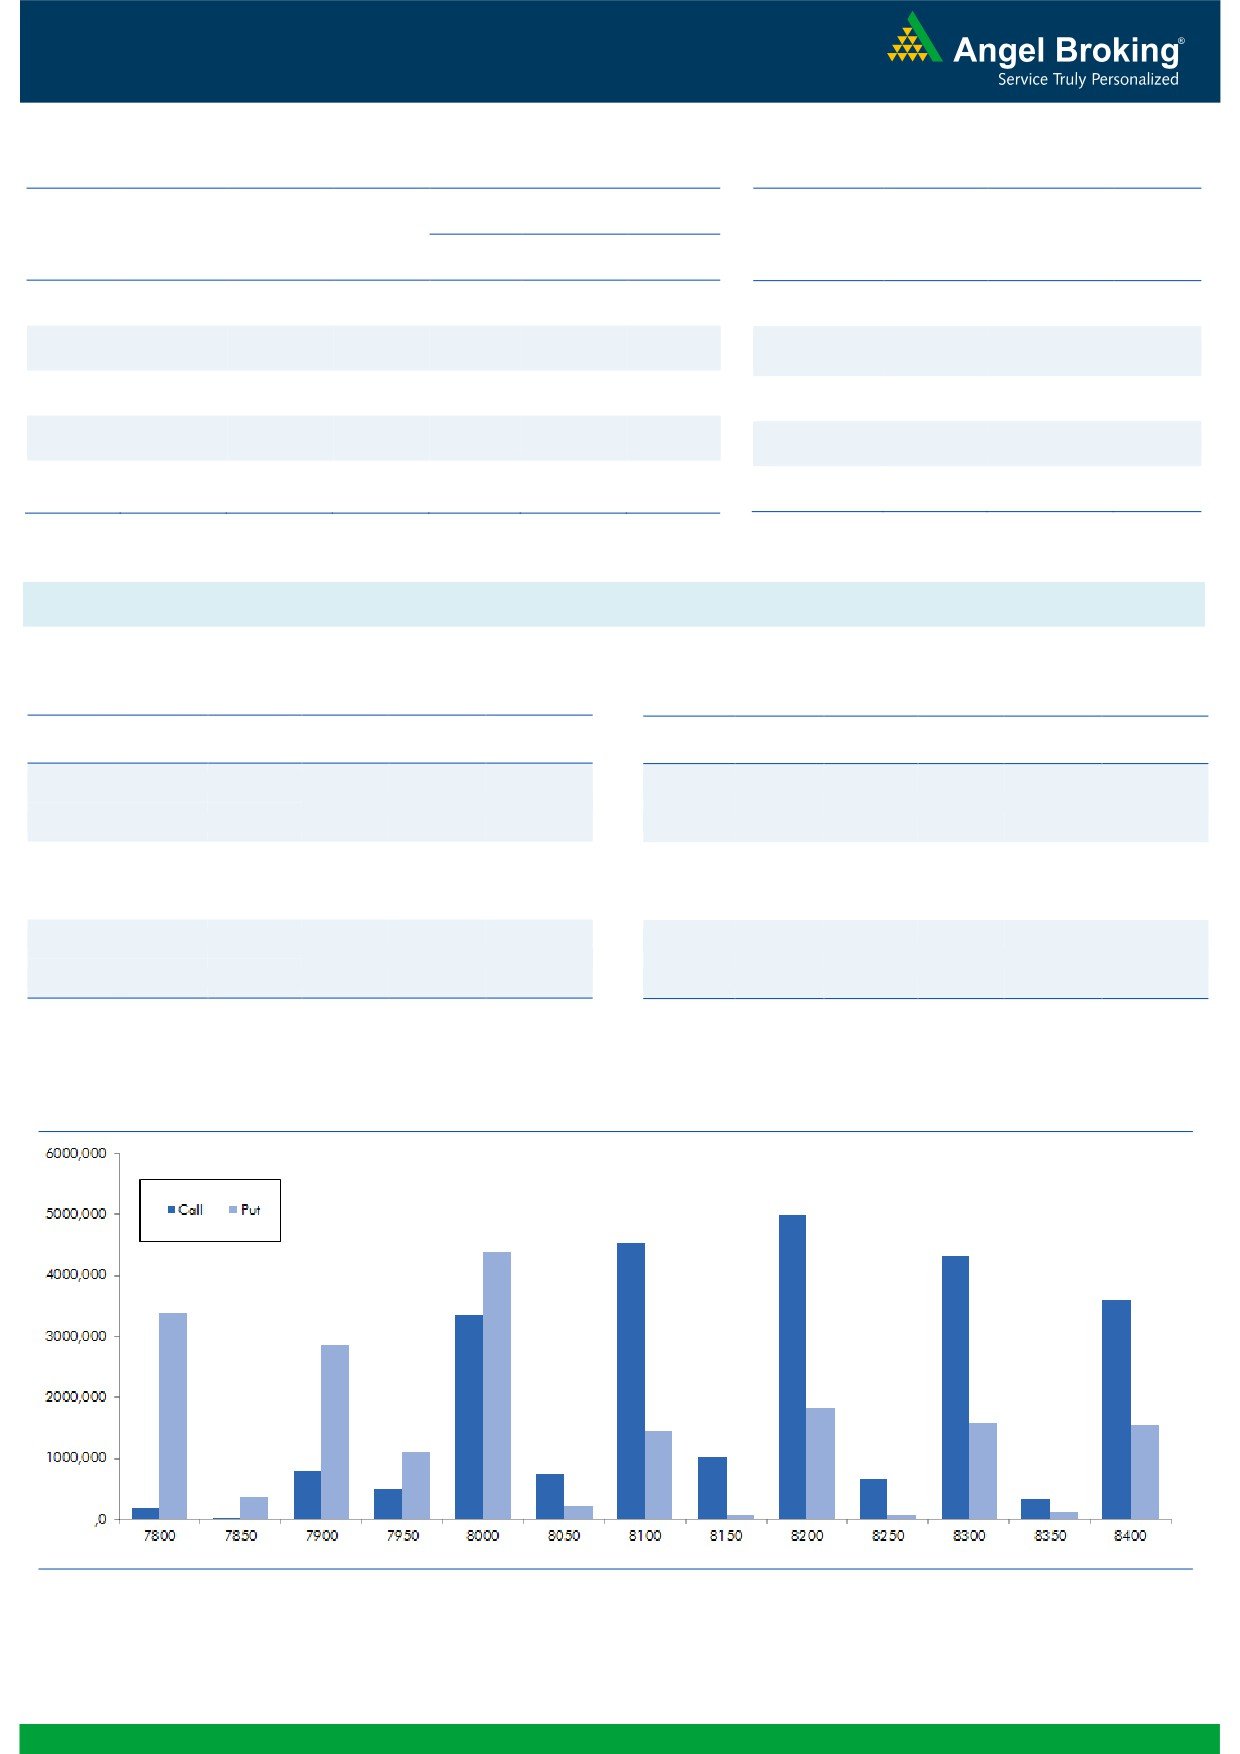
however, unwinding was seen in 8300-8600 strikes. On
the other hand, in put options, 8000 - 7950 strikes
OI Losers
added good amount of fresh positions; followed by
OI
PRICE
unwinding in 8100 - 8500 strikes. Highest OI in current
SCRIP
OI
PRICE
CHG. (%)
CHG. (%)
series is visible in 8500 call and 8000 put options.
APOLLOHOSP
574000
-12.34
1179.20
2.42
Again, we witnessed mixed position formation in Index
WIPRO
6096400
-11.54
451.10
2.09
Future by FIIs; wherein, majority of positions formed were
BHARATFORG
4242000
-10.64
878.75
2.26
on long side. But, these positions have been formed in
SAIL
63864000
-10.24
47.60
2.37
December series. However, bearish positions formed in
TORNTPHARM
307200
-10.18
1331.15
2.17
index options are still intact. Thus, we believe Nifty has
CUMMINSIND
547800
-9.69
770.55
0.77
limited upside for November Series. Hence, traders are
HAVELLS
3858000
-9.44
315.45
0.99
advised to remain light on positions and focus more on
CANBK
10818000
-7.77
303.30
-1.27
stock specific moves.
Historical Volatility
Put-Call Ratio
SCRIP
HV
SCRIP
PCR-OI
PCR-VOL
HINDUNILVR
23.63
NIFTY
0.71
0.79
MCDOWELL-N
48.37
BANKNIFTY
0.70
0.77
TATACOMM
51.19
SBIN
0.47
0.48
PFC
50.76
RELIANCE
0.46
0.45
HINDALCO
65.00
ICICIBANK
0.45
0.64
2
Technical & Derivatives Report
November 23, 2016
FII Statistics for November 22, 2016
Turnover on November 22, 2016
Open Interest
No. of
Turnover
Change
Detail
Buy
Sell
Net
Instrument
Value
Change
Contracts
( in Cr. )
(%)
Contracts
(in Cr.)
(%)
INDEX
INDEX
6213.56
5843.01
370.55
289747
18186.72
9.82
442512
24689.68
-13.89
FUTURES
FUTURES
INDEX
INDEX
68690.64
69007.37
(316.74)
1318151
81654.69
(0.46)
6911166
382550.50
-14.98
OPTIONS
OPTIONS
STOCK
20326.63
18930.10
1396.54
955400
56533.69
2.58
STOCK
FUTURES
975739
61497.79
1.55
FUTURES
STOCK
STOCK
5576.82
5525.39
51.43
130150
8162.91
0.59
OPTIONS
435175
27645.26
-9.56
OPTIONS
TOTAL
100807.66
99305.88
1501.78
2693448
164538.02
1.69
TOTAL
8764592
496383.23
-12.88
Nifty Spot = 8002.30
Lot Size = 75
Bull-Call Spreads
Bear-Put Spreads
Action
Strike
Price
Risk
Reward
BEP
Action
Strike
Price
Risk
Reward
BEP
Buy
8000
53.30
Buy
8000
46.05
37.25
62.75
8037.25
28.60
71.40
7971.40
Sell
8100
16.05
Sell
7900
17.45
Buy
8000
53.30
Buy
8000
46.05
48.95
151.05
8048.95
39.15
160.85
7960.85
Sell
8200
4.35
Sell
7800
6.90
Buy
8100
16.05
Buy
7900
17.45
11.70
88.30
8111.70
10.55
89.45
7889.45
Sell
8200
4.35
Sell
7800
6.90
Note: Above mentioned Bullish or Bearish Spreads in Nifty (November Series) are given as an information and not as a recommendation.
Nifty Put-Call Analysis
3
Technical & Derivatives Report
November 23, 2016
Daily Pivot Levels for Nifty Constituents
Scrips
S2
S1
PIVOT
R1
R2
ACC
1 242
1 267
1 282
1 308
1 323
ADANIPORTS
254
257
260
264
267
AMBUJACEM
188
192
195
198
201
ASIANPAINT
887
898
905
915
923
AUROPHARMA
693
706
718
732
743
AXISBANK
451
461
468
478
486
BAJAJ-AUTO
2 476
2 538
2 576
2 638
2 676
BANKBARODA
156
160
163
166
169
BHEL
119
122
126
129
133
BPCL
629
635
640
646
650
BHARTIARTL
291
297
301
308
312
INFRATEL
353
356
361
364
368
BOSCH
17 237
17 880
18 315
18 959
19 394
CIPLA
535
543
551
559
567
COALINDIA
296
300
302
306
309
DRREDDY
3 039
3 080
3 117
3 158
3 194
EICHERMOT
19 788
20 221
20 604
21 037
21 421
GAIL
396
405
417
426
438
GRASIM
779
792
800
814
822
HCLTECH
749
756
762
768
774
HDFCBANK
1 181
1 189
1 198
1 207
1 216
HDFC
1 216
1 233
1 243
1 260
1 269
HEROMOTOCO
2 900
2 949
2 982
3 031
3 064
HINDALCO
156
161
164
170
173
HINDUNILVR
795
808
815
827
835
ICICIBANK
256
259
263
266
270
IDEA
70
70
71
72
73
INDUSINDBK
1 049
1 060
1 069
1 080
1 088
INFY
901
908
918
925
935
ITC
221
224
226
228
231
KOTAKBANK
757
763
768
774
779
LT
1 276
1 303
1 331
1 358
1 387
LUPIN
1 396
1 405
1 411
1 419
1 425
M&M
1 171
1 195
1 209
1 233
1 248
MARUTI
4 775
4 855
4 905
4 985
5 036
NTPC
149
151
154
156
159
ONGC
270
274
279
283
287
POWERGRID
178
181
184
187
190
RELIANCE
986
994
1 001
1 008
1 015
SBIN
246
251
257
263
269
SUNPHARMA
677
683
691
698
706
TCS
2 089
2 112
2 145
2 168
2 200
TATAMTRDVR
278
285
290
296
302
TATAMOTORS
445
455
463
473
481
TATAPOWER
68
68
69
70
70
TATASTEEL
370
374
377
381
384
TECHM
443
448
452
457
460
ULTRACEMCO
3 252
3 337
3 386
3 471
3 520
WIPRO
434
442
448
456
461
YESBANK
1 077
1 104
1 123
1 150
1 168
ZEEL
433
441
446
454
459
4
Technical & Derivatives Report
November 23, 2016
Research Team Tel: 022 - 39357800
For Technical Queries
For Derivatives Queries
DISCLAIMER
Angel Broking Private Limited (hereinafter referred to as “Angel”) is a registered Member of National Stock Exchange of India Limited,
Bombay Stock Exchange Limited and Metropolitan Stock Exchange Limited. It is also registered as a Depository Participant with CDSL
and Portfolio Manager with SEBI. It also has registration with AMFI as a Mutual Fund Distributor. Angel Broking Private Limited is a
registered entity with SEBI for Research Analyst in terms of SEBI (Research Analyst) Regulations, 2014 vide registration number
INH000000164. Angel or its associates has not been debarred/ suspended by SEBI or any other regulatory authority for accessing
/dealing in securities Market. Angel or its associates/analyst has not received any compensation / managed or co-managed public
offering of securities of the company covered by Analyst during the past twelve months.
This document is solely for the personal information of the recipient, and must not be singularly used as the basis of any investment
decision. Nothing in this document should be construed as investment or financial advice. Each recipient of this document should
make such investigations as they deem necessary to arrive at an independent evaluation of an investment in the securities of the
companies referred to in this document (including the merits and risks involved), and should consult their own advisors to determine
the merits and risks of such an investment.
Reports based on technical and derivative analysis center on studying charts of a stock's price movement, outstanding positions and
trading volume, as opposed to focusing on a company's fundamentals and, as such, may not match with a report on a company's
fundamentals. Investors are advised to refer the Fundamental and Technical Research Reports available on our website to evaluate the
contrary view, if any.
The information in this document has been printed on the basis of publicly available information, internal data and other reliable
sources believed to be true, but we do not represent that it is accurate or complete and it should not be relied on as such, as this
document is for general guidance only. Angel Broking Pvt. Limited or any of its affiliates/ group companies shall not be in any way
responsible for any loss or damage that may arise to any person from any inadvertent error in the information contained in this report.
Angel Broking Pvt. Limited has not independently verified all the information contained within this document. Accordingly, we cannot
testify, nor make any representation or warranty, express or implied, to the accuracy, contents or data contained within this document.
While Angel Broking Pvt. Limited endeavors to update on a reasonable basis the information discussed in this material, there may be
regulatory, compliance, or other reasons that prevent us from doing so.
This document is being supplied to you solely for your information, and its contents, information or data may not be reproduced,
redistributed or passed on, directly or indirectly.
Neither Angel Broking Pvt. Limited, nor its directors, employees or affiliates shall be liable for any loss or damage that may arise from
or in connection with the use of this information.
5