Technical & Derivatives Report
September 23, 2016
Sensex (28773) / Nifty (8867)
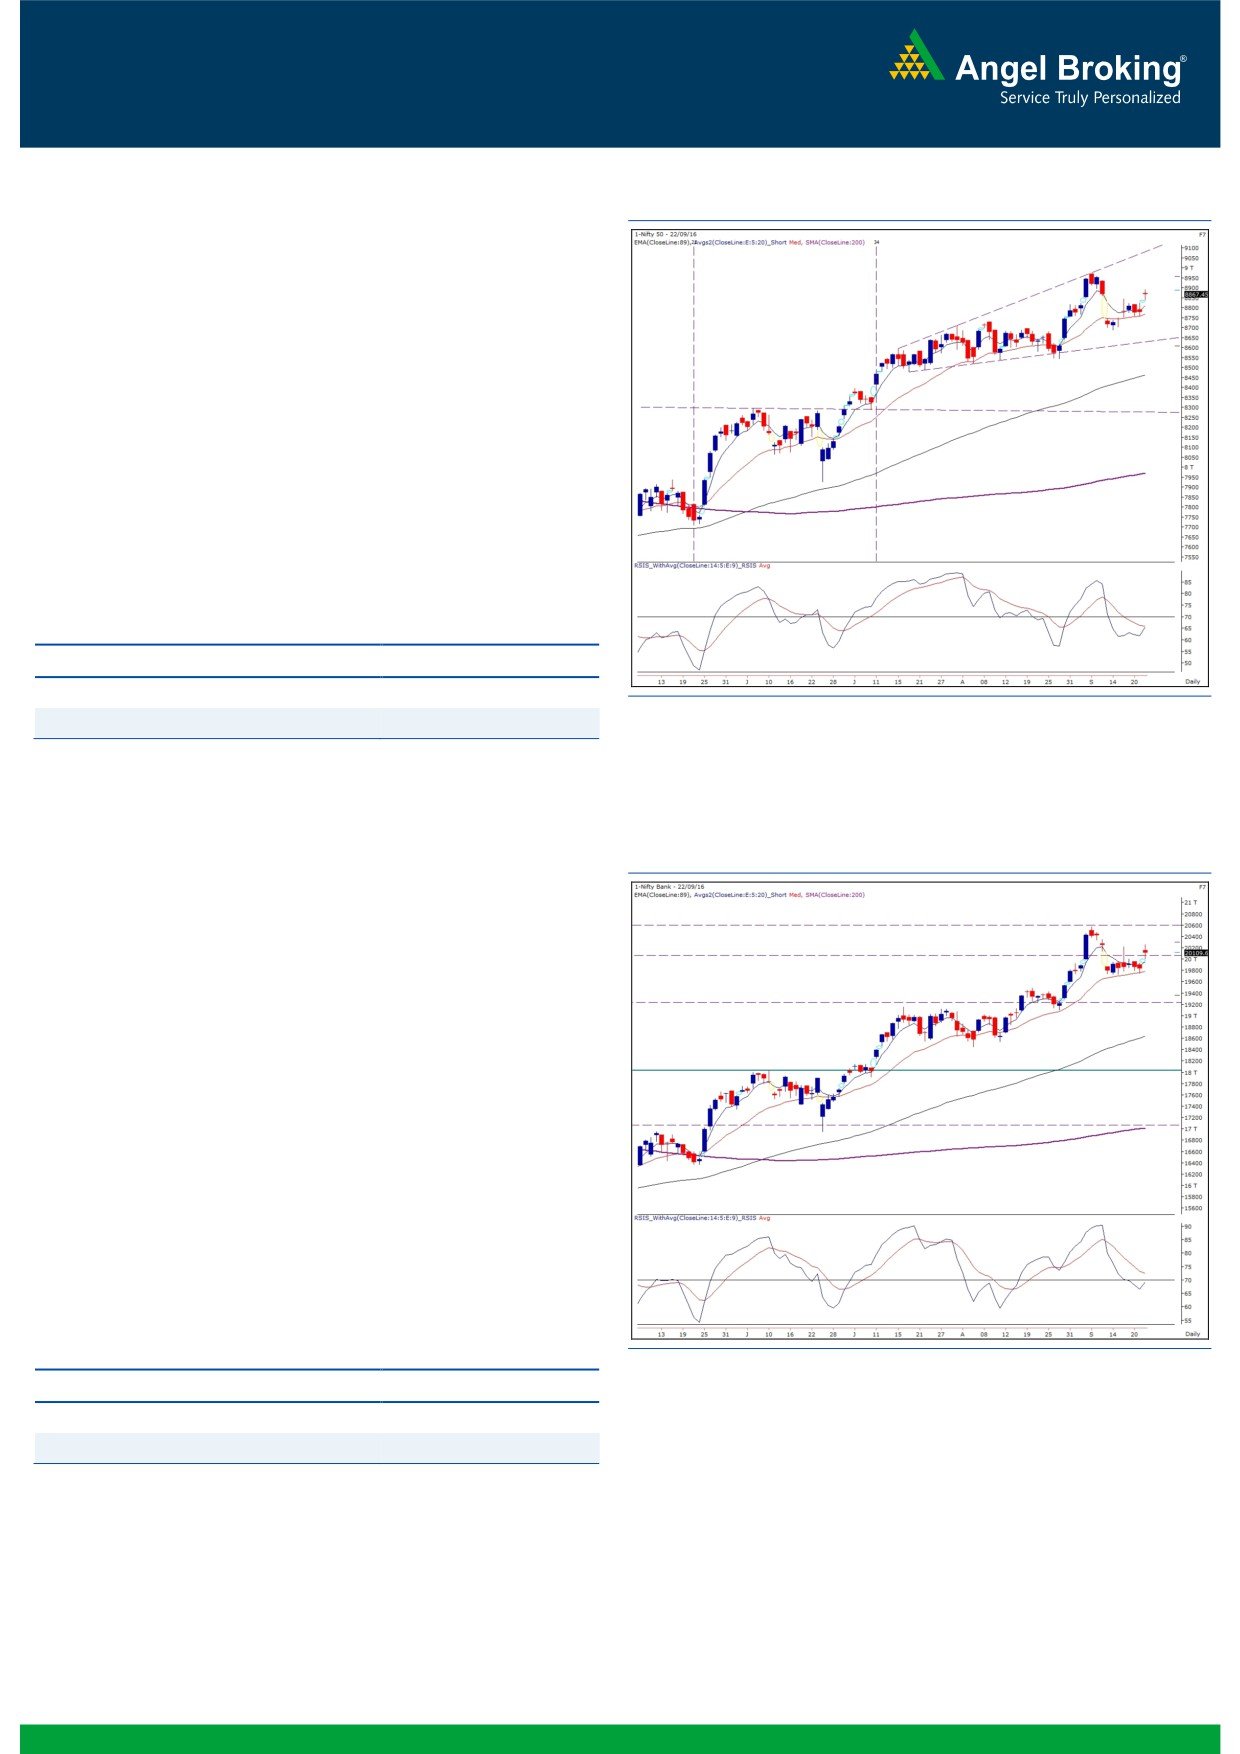
Exhibit 1: Nifty Daily Chart
Yesterday, our markets opened with a decent upside gap owing
to extremely positive cues across the globe. However, due to lack
of follow up buying, the Nifty consolidated in a thin range
throughout the day to end the session almost around its opening
point.
Now, as discussed in our earlier, we do not want to get carried
away by this move as the pattern formed on weekly chart (during
the previous week) is not so encouraging. We would stick to our
cautious stance and would use this bounce to go short on the
market. The immediate resistance levels are seen at 8880 - 8910.
On the downside, 8750 - 8700 would be the immediate support
zone.
Key Levels
Support 1 - 8750
Resistance 1 - 8880
Support 2 - 8700
Resistance 2 - 8910
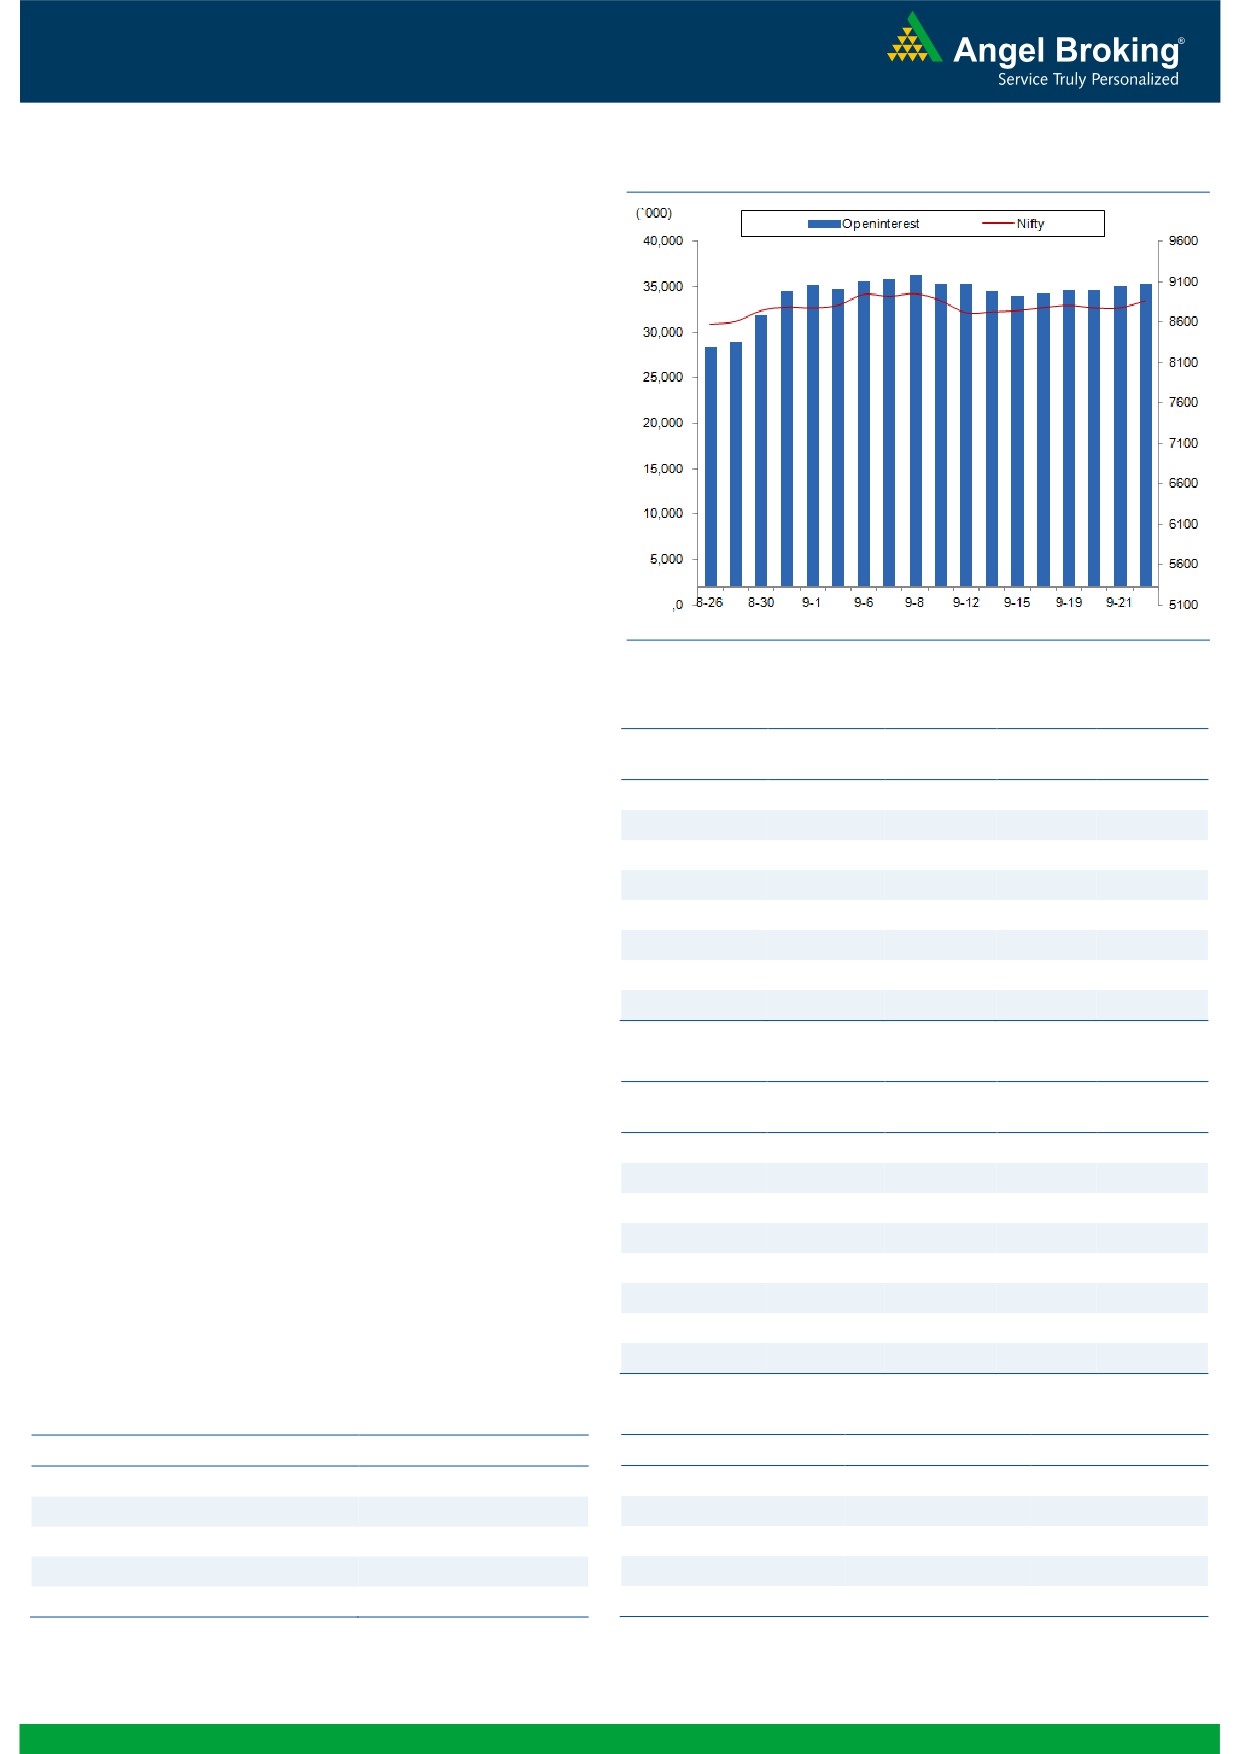
Exhibit 2: Nifty Bank Daily Chart
Nifty Bank Outlook - (20110)
In line with the benchmark indices, the Nifty Bank index too
opened with upside gap and rallied higher during the initial hour
of the trade. The index then traded with higher volatility and
ended the session with gains of 1.42 percent over its previous
session's close.
Since last few session's, we have been maintaining our cautious
stance on the index and yesterday was one of the move that we
had unlooked - for. On daily charts, the 'Parabolic SAR' is in 'Sell'
mode and thus there is a probability that the yesterday's upmove
may be just a retracement pullback. Hence, we still continue to
advise traders to stay cautious and wait for further development
on the charts. The intraday support for the index are placed
around 20000 and 19900 whereas resistances are seen around
20265 and 20450.
Key Levels
Support 1 - 20000
Resistance 1 - 20265
Support 2 - 19900
Resistance 2 - 20450
1
Technical & Derivatives Report
September 23, 2016
Comments
Nifty Vs OI
The Nifty futures open interest has increased by 0.50%
BankNifty futures open interest has increased by 0.84%
as market closed at 8867.45 levels.
The Nifty September future closed with a premium of
17.00 points against a premium of 29.80 points in
previous session. The October series closed at a
premium of 56.30 points.
The Implied Volatility of at the money options has
decreased from 15.64% to 11.17%. At the same time,
the PCR-OI of Nifty has increased from 1.12 to 1.16.
The total OI of the market is Rs. 3,29,493/- cr. and the
stock futures OI is Rs. 88,471/- cr.
Few of the liquid counters where we have seen high cost
of carry are JPASSOCIAT, SOUTHBANK, JINDALSTEL,
CENTURYTEX and ADANIPOWER.
Views
Yesterday, FIIs were net buyer in cash segment; they
OI Gainers
bought equities worth Rs. 337 crores. While, they were
OI
PRICE
net sellers worth Rs. 299 crores in index future with
SCRIP
OI
PRICE
CHG. (%)
CHG. (%)
marginal change in OI, indicating blend of long
AJANTPHARM
524800
22.62
2050.10
4.31
unwinding and some short formation in last trading
FEDERALBNK
34408000
18.31
73.50
3.09
session.
TVSMOTOR
6612000
18.28
349.30
4.60
On Index Options front, FIIs bought to the tune of Rs.ng.com
DABUR
6195000
16.94
286.35
-1.46
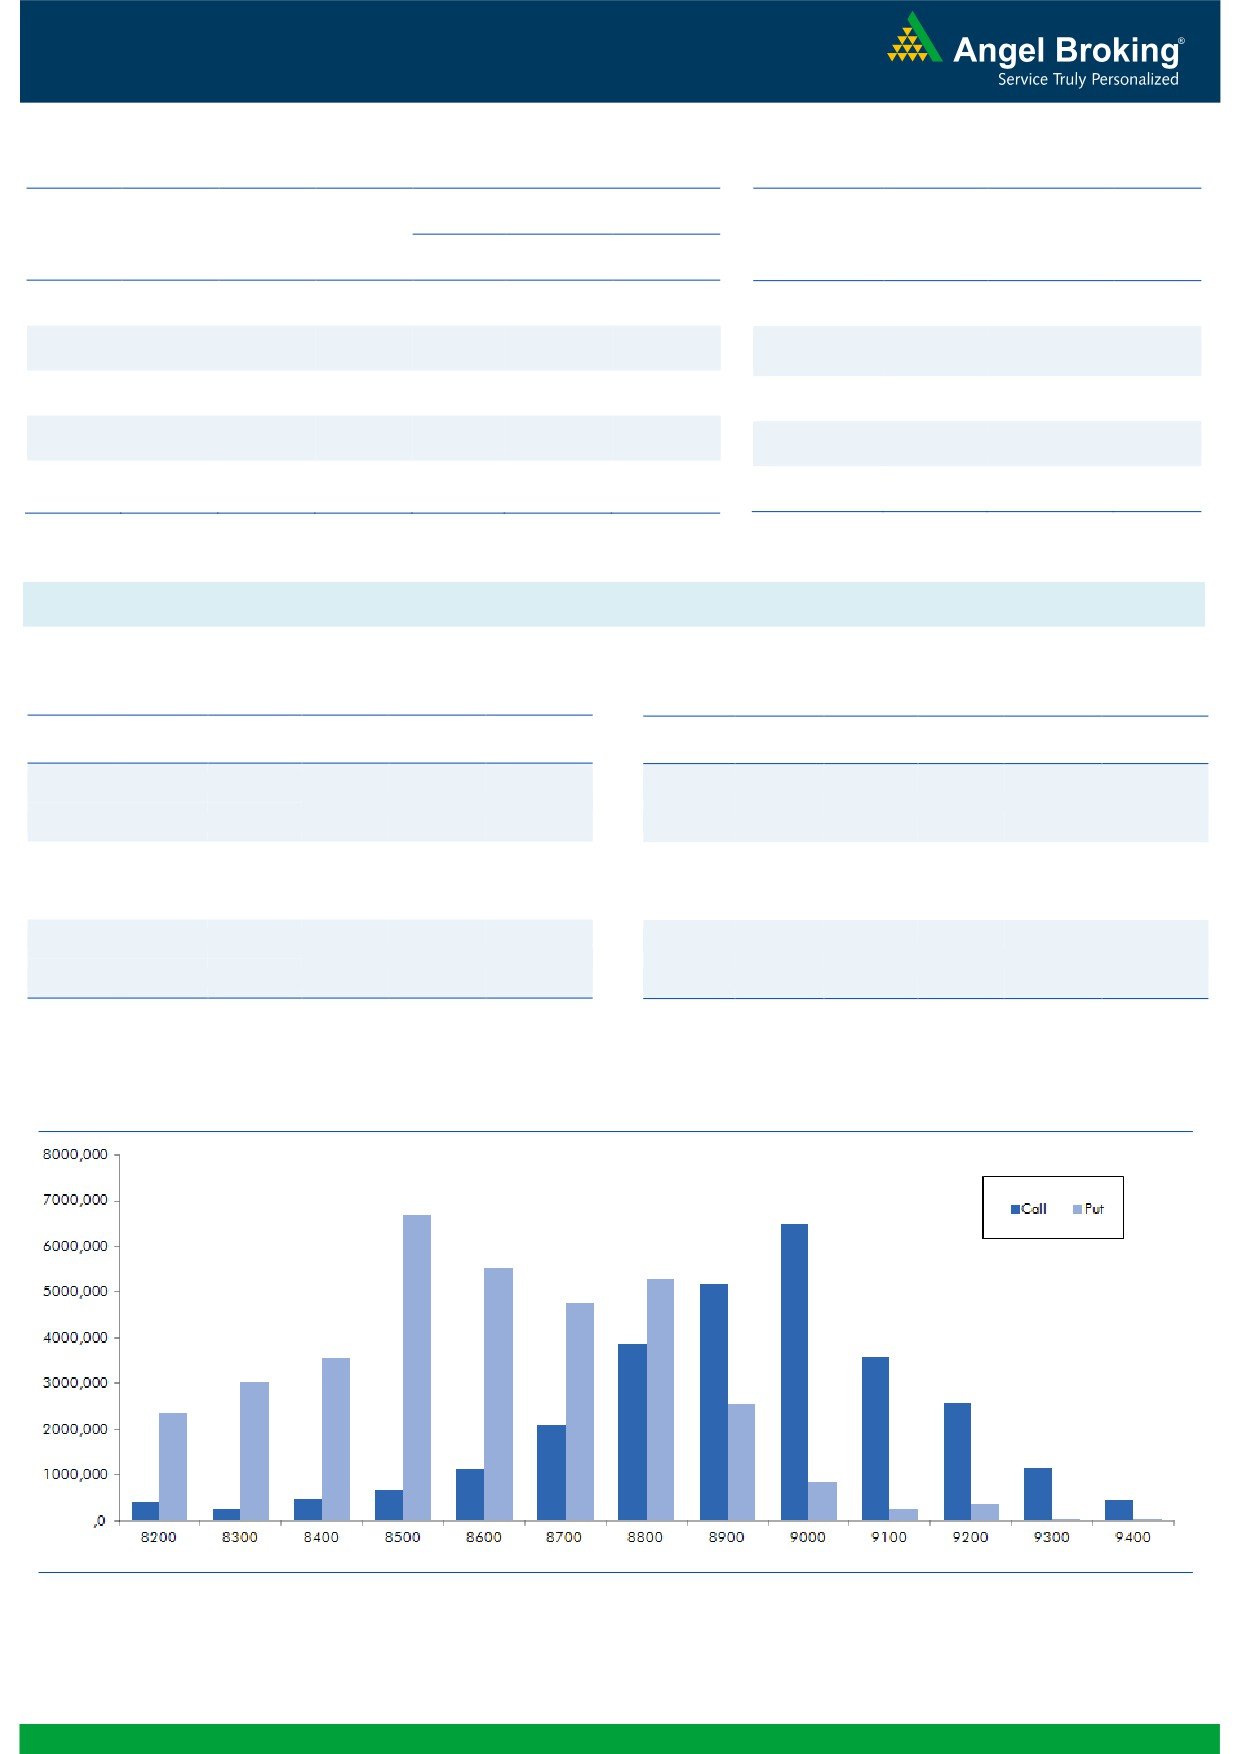
498 crores with rise in OI. In call options, we hardly saw
VOLTAS
4630000
16.33
381.05
0.32
any strike adding meaningful OI. Decent amount of
JSWENERGY
21840000
10.35
79.15
-0.50
unwinding was witness in 8800 call options. While in put
TECHM
8818700
9.10
456.30
-1.43
options, we witnessed some OI build-up in 8800-8900
BEL
2212200
8.45
1247.20
0.71
strikes; followed by decent amount of unwinding in 8600
and 8700 strikes. Highest OI in September series is
OI Losers
placed at 9000 call and 8500 put option.
OI
PRICE
Global market indicates we may start today’s session on
SCRIP
OI
PRICE
CHG. (%)
CHG. (%)
a flat note. Yesterday, Nifty bounced nearly 100 points
APOLLOHOSP
552000
-18.05
1341.95
2.28
but surprising no longs was visible. Thus, seeing the
JUBLFOOD
2526500
-8.58
978.75
3.00
derivatives data, we don’t see any signs of Index
TORNTPHARM
356000
-8.15
1652.40
2.06
sustaining at these higher levels.
SRTRANSFIN
3493200
-7.43
1188.00
3.67
Yesterday, large cap counters like HDFC, ACC,
YESBANK
12920600
-7.20
1246.75
2.09
TATAMOTORS and EICHERMOT have seen decent long
RELCAPITAL
10869000
-6.85
576.00
3.48
formation. While, counters like TECHM, LUPIN,
ANDHRABANK
17330000
-6.43
61.20
3.03
AXISBANK and TCS added good amount of short
PFC
22176000
-5.88
123.25
1.73
positions.
Historical Volatility
Put-Call Ratio
SCRIP
HV
SCRIP
PCR-OI
PCR-VOL
AUROPHARMA
42.39
NIFTY
1.16
1.24
AJANTPHARM
29.85
BANKNIFTY
1.08
0.98
BAJFINANCE
45.48
RELIANCE
0.66
0.63
SRTRANSFIN
35.72
YESBANK
0.62
0.61
TVSMOTOR
43.19
SBIN
0.52
0.52
2
Technical & Derivatives Report
September 23, 2016
FII Statistics for 22, September 2016
Turnover on 22, September 2016
Open Interest
No. of
Turnover
Change
Detail
Buy
Sell
Net
Instrument
Value
Contracts
( in Cr. )
(%)
Contracts
Change (%)
(in Cr.)
INDEX
INDEX
3143.17
3442.40
(299.22)
475380
32350.12
(0.39)
271568
19644.51
38.75
FUTURES
FUTURES
INDEX
INDEX
51635.79
51137.90
497.89
1381217
94270.26
1.21
6945045
520148.54
97.45
OPTIONS
OPTIONS
STOCK
7817.62
7945.01
(127.39)
938951
63284.77
(0.22)
STOCK
FUTURES
648931
46832.40
39.39
FUTURES
STOCK
STOCK
6099.75
6265.94
(166.19)
122396
8618.16
(3.20)
OPTIONS
447790
32554.90
46.72
OPTIONS
TOTAL
68696.34
68791.25
(94.91)
2917944
198523.31
0.29
TOTAL
8313334
619180.34
85.73
Nifty Spot = 8867.45
Lot Size = 75
Bull-Call Spreads
Bear-Put Spreads
Action
Strike
Price
Risk
Reward
BEP
Action
Strike
Price
Risk
Reward
BEP
Buy
8900
47.05
Buy
8900
62.00
32.20
67.80
8932.20
35.40
64.60
8864.60
Sell
9000
14.85
Sell
8800
26.60
Buy
8900
47.05
Buy
8900
62.00
43.15
156.85
8943.15
50.70
149.30
8849.30
Sell
9100
3.90
Sell
8700
11.30
Buy
9000
14.85
Buy
8800
26.60
10.95
89.05
9010.95
15.30
84.70
8784.70
Sell
9100
3.90
Sell
8700
11.30
Note: Above mentioned Bullish or Bearish Spreads in Nifty (September Series) are given as an information and not as a recommendation.
Nifty Put-Call Analysis
3
Technical & Derivatives Report
September 23, 2016
Daily Pivot Levels for Nifty Constituents
Scrips
S2
S1
PIVOT
R1
R2
ACC
1,628
1,647
1,659
1,678
1,690
ADANIPORTS
269
272
275
278
281
AMBUJACEM
261
263
266
268
271
ASIANPAINT
1,166
1,179
1,188
1,201
1,210
AUROPHARMA
794
826
843
874
891
AXISBANK
576
584
598
606
620
BAJAJ-AUTO
2,882
2,905
2,939
2,961
2,995
BANKBARODA
165
167
169
171
172
BHEL
145
146
147
148
149
BPCL
584
592
596
603
608
BHARTIARTL
321
324
326
329
331
INFRATEL
361
368
378
385
395
BOSCH
23,154
23,279
23,452
23,577
23,750
CIPLA
601
605
608
612
615
COALINDIA
322
325
329
332
336
DRREDDY
3,122
3,136
3,156
3,169
3,189
EICHERMOT
24,057
24,433
24,642
25,017
25,226
GAIL
385
388
391
393
396
GRASIM
4,856
4,892
4,916
4,951
4,975
HCLTECH
775
782
791
798
807
HDFCBANK
1,292
1,299
1,308
1,316
1,325
HDFC
1,394
1,404
1,412
1,421
1,429
HEROMOTOCO
3,463
3,501
3,539
3,577
3,615
HINDALCO
150
153
154
156
158
HINDUNILVR
896
903
910
918
925
ICICIBANK
270
273
275
278
281
IDEA
82
83
84
85
86
INDUSINDBK
1,187
1,203
1,215
1,231
1,243
INFY
1,048
1,054
1,057
1,063
1,066
ITC
252
254
255
257
259
KOTAKBANK
785
790
796
801
807
LT
1,467
1,483
1,494
1,510
1,521
LUPIN
1,490
1,510
1,535
1,554
1,579
M&M
1,400
1,407
1,415
1,421
1,429
MARUTI
5,530
5,563
5,599
5,632
5,668
NTPC
154
156
156
158
159
ONGC
256
258
260
261
263
POWERGRID
174
176
178
181
182
RELIANCE
1,071
1,080
1,088
1,097
1,105
SBIN
254
256
257
259
261
SUNPHARMA
781
784
786
789
792
TCS
2,335
2,357
2,392
2,414
2,449
TATAMTRDVR
349
352
355
358
361
TATAMOTORS
546
552
558
564
569
TATAPOWER
75
76
76
77
77
TATASTEEL
370
373
377
380
384
TECHM
445
450
458
463
471
ULTRACEMCO
3,934
3,957
3,983
4,006
4,032
WIPRO
477
479
482
485
488
YESBANK
1,217
1,232
1,245
1,260
1,274
ZEEL
517
521
528
533
539
4
Technical & Derivatives Report
September 23, 2016
Research Team Tel: 022 - 39357800
For Technical Queries
For Derivatives Queries
DISCLAIMER
Angel Broking Private Limited (hereinafter referred to as “Angel”) is a registered Member of National Stock Exchange of India Limited,
Bombay Stock Exchange Limited and Metropolitan Stock Exchange Limited. It is also registered as a Depository Participant with CDSL
and Portfolio Manager with SEBI. It also has registration with AMFI as a Mutual Fund Distributor. Angel Broking Private Limited is a
registered entity with SEBI for Research Analyst in terms of SEBI (Research Analyst) Regulations, 2014 vide registration number
INH000000164. Angel or its associates has not been debarred/ suspended by SEBI or any other regulatory authority for accessing
/dealing in securities Market. Angel or its associates/analyst has not received any compensation / managed or co-managed public
offering of securities of the company covered by Analyst during the past twelve months.
This document is solely for the personal information of the recipient, and must not be singularly used as the basis of any investment
decision. Nothing in this document should be construed as investment or financial advice. Each recipient of this document should
make such investigations as they deem necessary to arrive at an independent evaluation of an investment in the securities of the
companies referred to in this document (including the merits and risks involved), and should consult their own advisors to determine
the merits and risks of such an investment.
Reports based on technical and derivative analysis center on studying charts of a stock's price movement, outstanding positions and
trading volume, as opposed to focusing on a company's fundamentals and, as such, may not match with a report on a company's
fundamentals. Investors are advised to refer the Fundamental and Technical Research Reports available on our website to evaluate the
contrary view, if any.
The information in this document has been printed on the basis of publicly available information, internal data and other reliable
sources believed to be true, but we do not represent that it is accurate or complete and it should not be relied on as such, as this
document is for general guidance only. Angel Broking Pvt. Limited or any of its affiliates/ group companies shall not be in any way
responsible for any loss or damage that may arise to any person from any inadvertent error in the information contained in this report.
Angel Broking Pvt. Limited has not independently verified all the information contained within this document. Accordingly, we cannot
testify, nor make any representation or warranty, express or implied, to the accuracy, contents or data contained within this document.
While Angel Broking Pvt. Limited endeavors to update on a reasonable basis the information discussed in this material, there may be
regulatory, compliance, or other reasons that prevent us from doing so.
This document is being supplied to you solely for your information, and its contents, information or data may not be reproduced,
redistributed or passed on, directly or indirectly.
Neither Angel Broking Pvt. Limited, nor its directors, employees or affiliates shall be liable for any loss or damage that may arise from
or in connection with the use of this information.
5