Technical & Derivatives Report
June 23, 2016
Sensex (26813) / Nifty (8204)
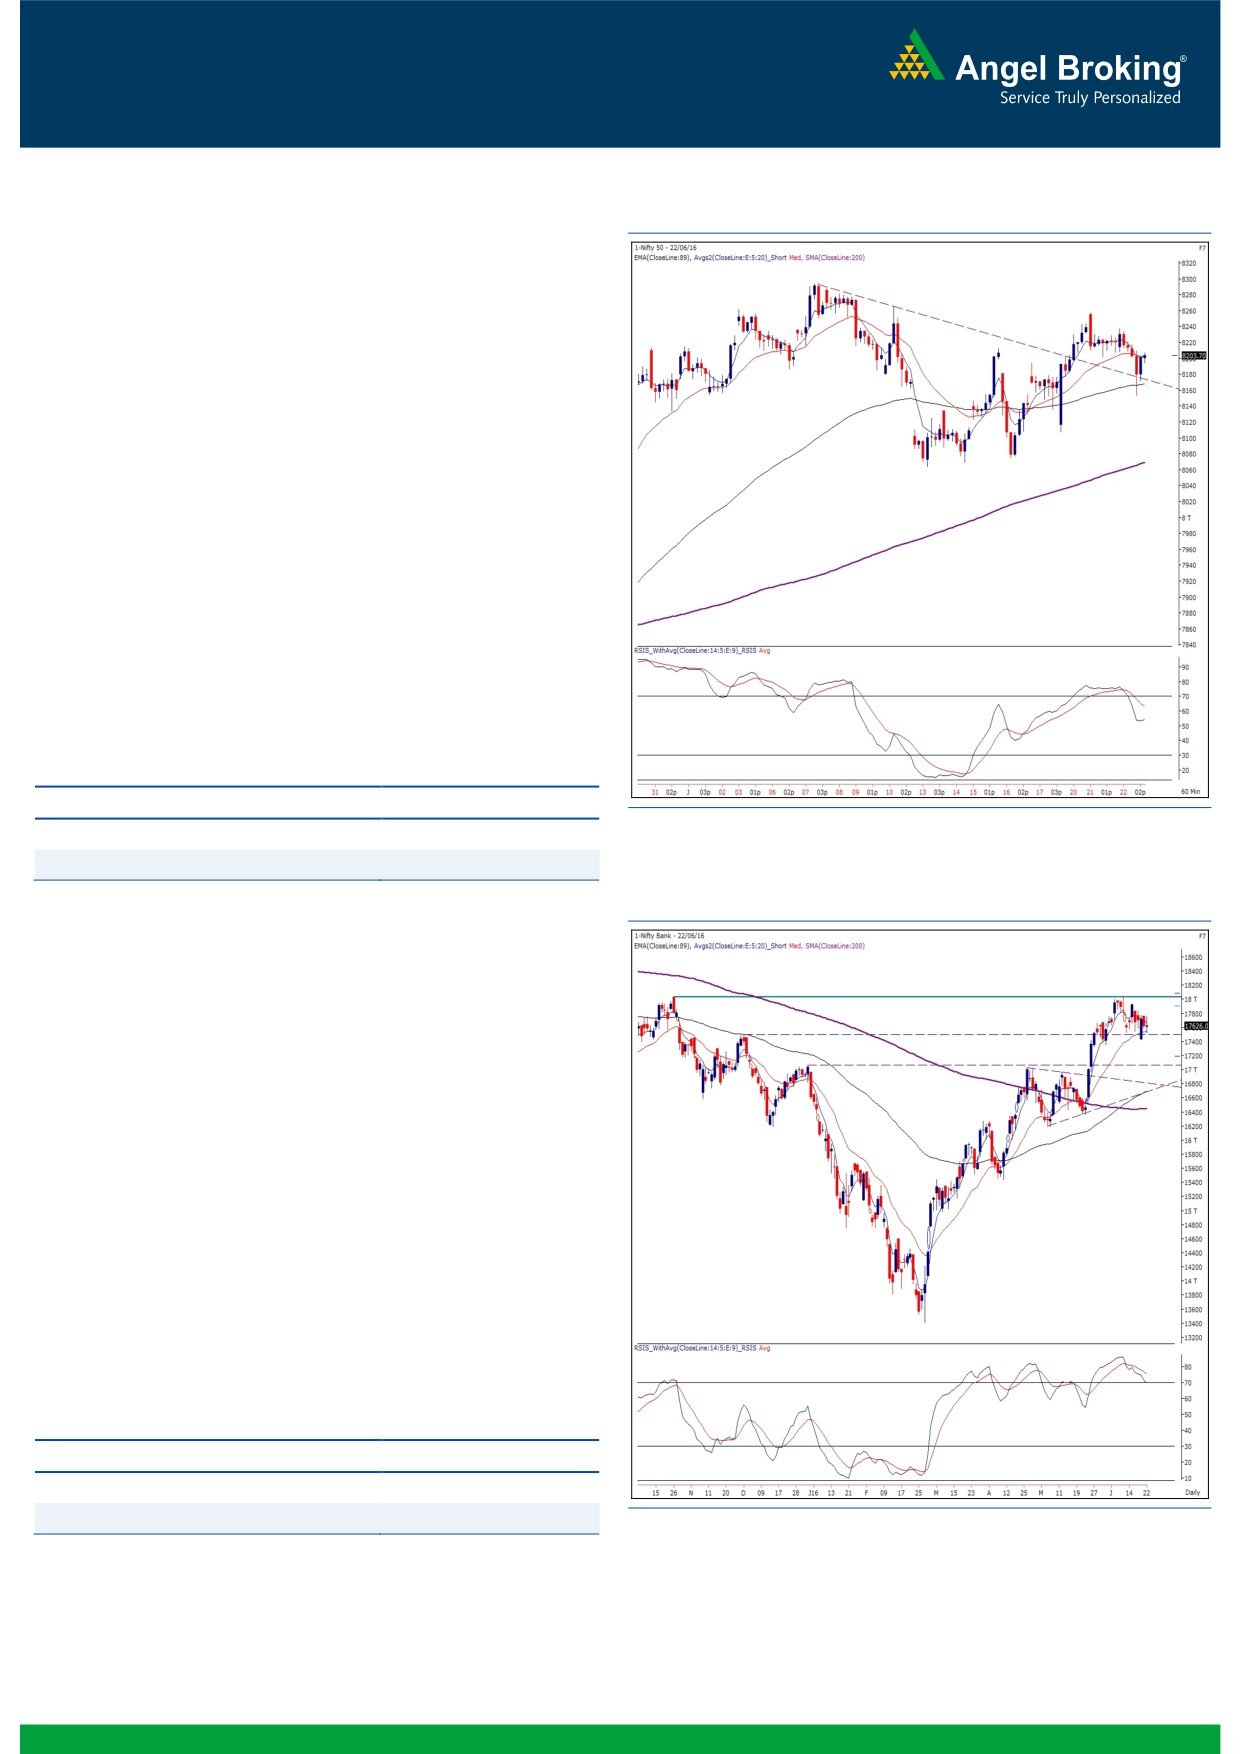
Exhibit 1: Nifty Hourly Chart
Yesterday’s session opened tad lower despite positive cues from
the Asian peers. The index maintained this pessimistic mood
throughout the session to conclude with a nominal cut of 0.20%
over it previous close.
The Nifty remained lethargic for the major part of the day.
However, a sharp cut in the penultimate hour caught most of the
intraday traders on a wrong foot. Fortunately, we witnessed a
smart recovery to reclaim the 8200 mark. If we meticulously
observe the hourly chart, the ‘Inverse Head and Shoulder’ formed
on Tuesday becomes clearly visible. Yesterday’s intraday dip
precisely tested the ‘Neckline’ level of 8160, which coincides with
’89 EMA’. Thus, this corrective move can be construed as a pull
back and going by this hypothesis; we maintain our positive
stance on the market and expect the index to move towards 8290
- 8336 levels. On the flipside, 8150 would be seen as immediate
support level. Traders should keep a note of a global event such
as ‘EU Referendum on Brexit’ and thus, it’s advisable to stay light
and avoid taking undue risks.
Key Levels
Support 1 - 8150
Resistance 1 - 8290
Support 2 - 8100
Resistance 2 - 8336
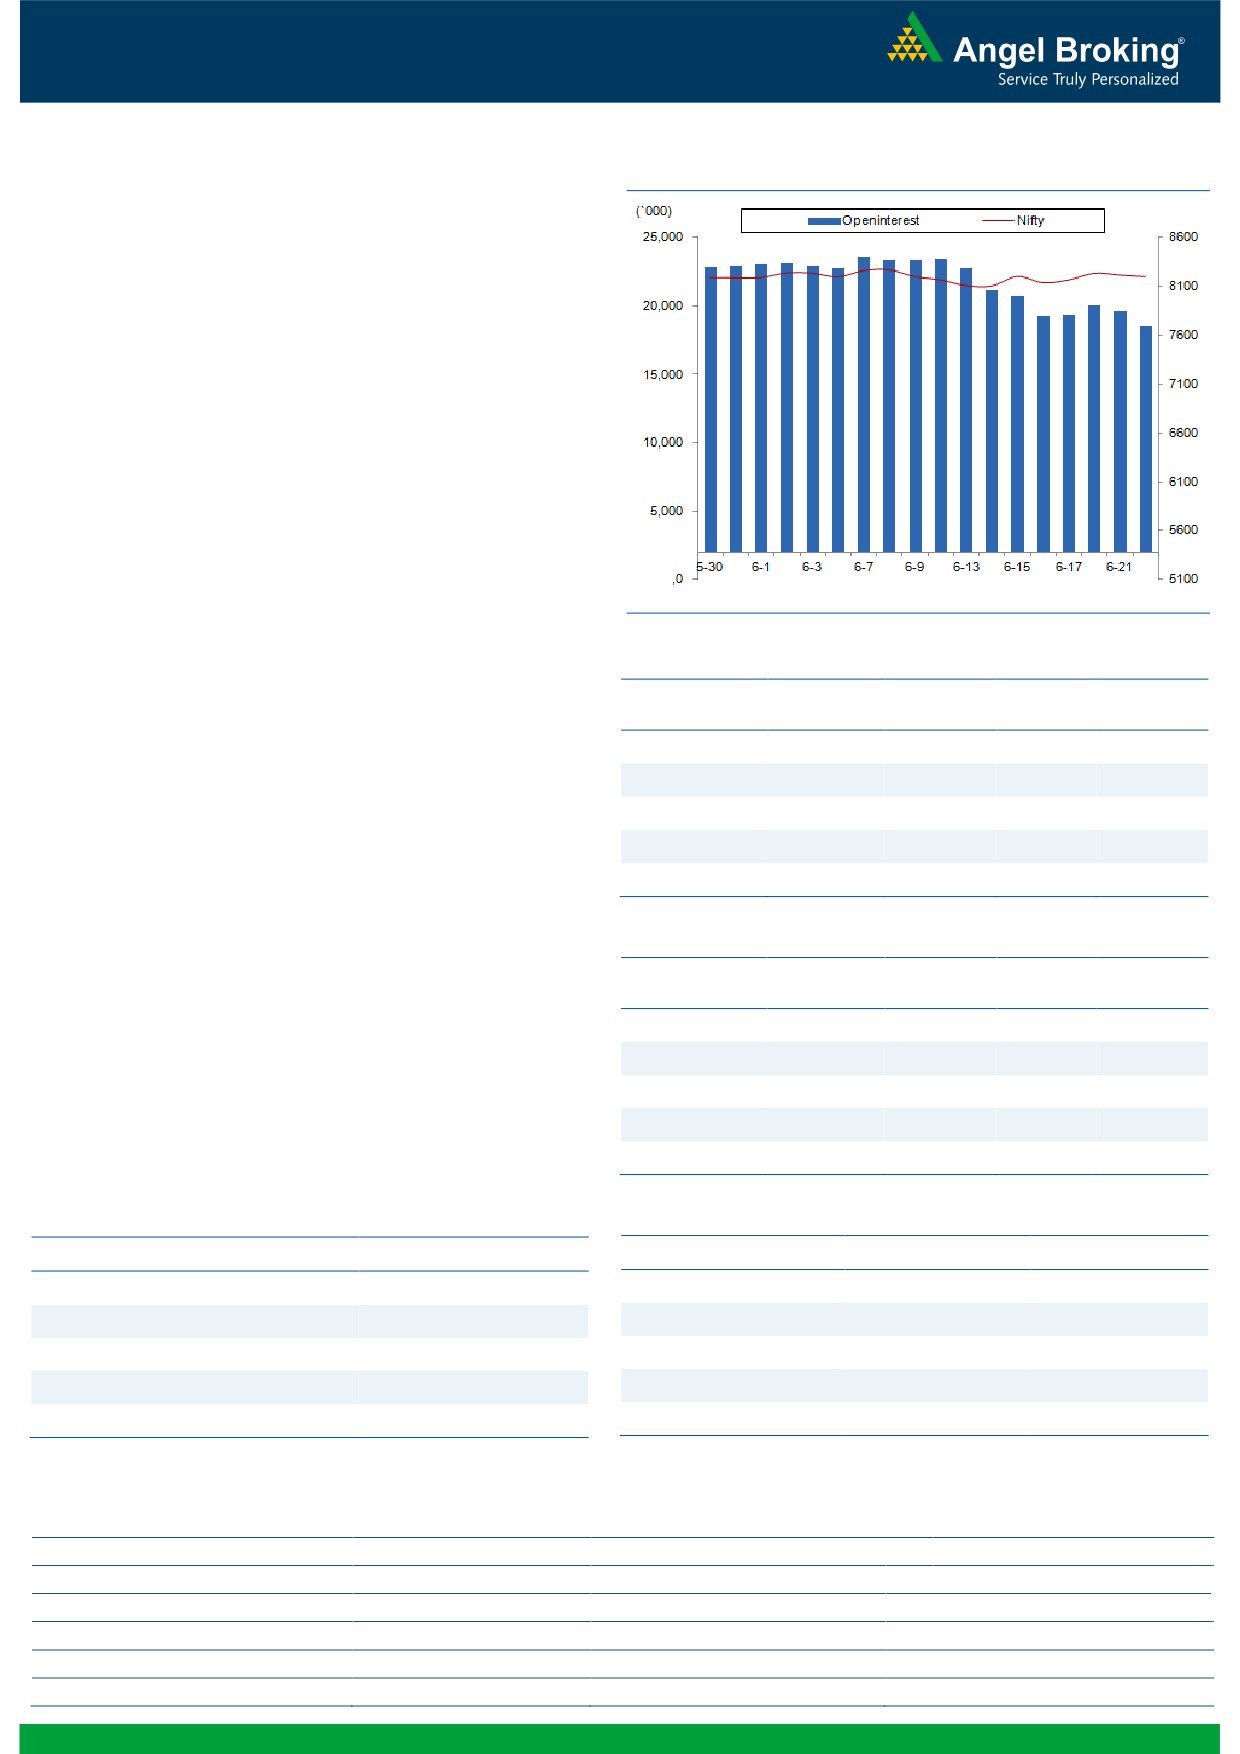
Exhibit 2: Nifty Bank Daily Chart
Nifty Bank Outlook - (17626)
Yesterday, the banking index too opened on a soft note and then
remained under pressure for the major part of the day. However,
a modest recovery towards the fag end led to a daily close
marginally in the positive territory.
Since last few trading sessions, the index is trading in a narrow
range and it seems that markets participants are waiting for the
development of Britain's EU referendum on 'Brexit', which is late in
the evening. Hence, we could see range bound trading sessions
with market participants waiting for the outcome, which may
dictate a near term direction for global markets. Technically, the
index has been trading in a range of 17350 - 18050 since last
few days and hence, unless it confirms a breakout from the
range, traders should focus on stock specific moves rather than
trading in the index. The near term support for the index is placed
around 17588 and 17350; whereas, resistances are seen around
17935 and 18050.
Key Levels
Support 1 - 17588
Resistance 1 - 17935
Support 2 - 17350
Resistance 2 - 18050
1
Technical & Derivatives Report
June 23, 2016
Comments
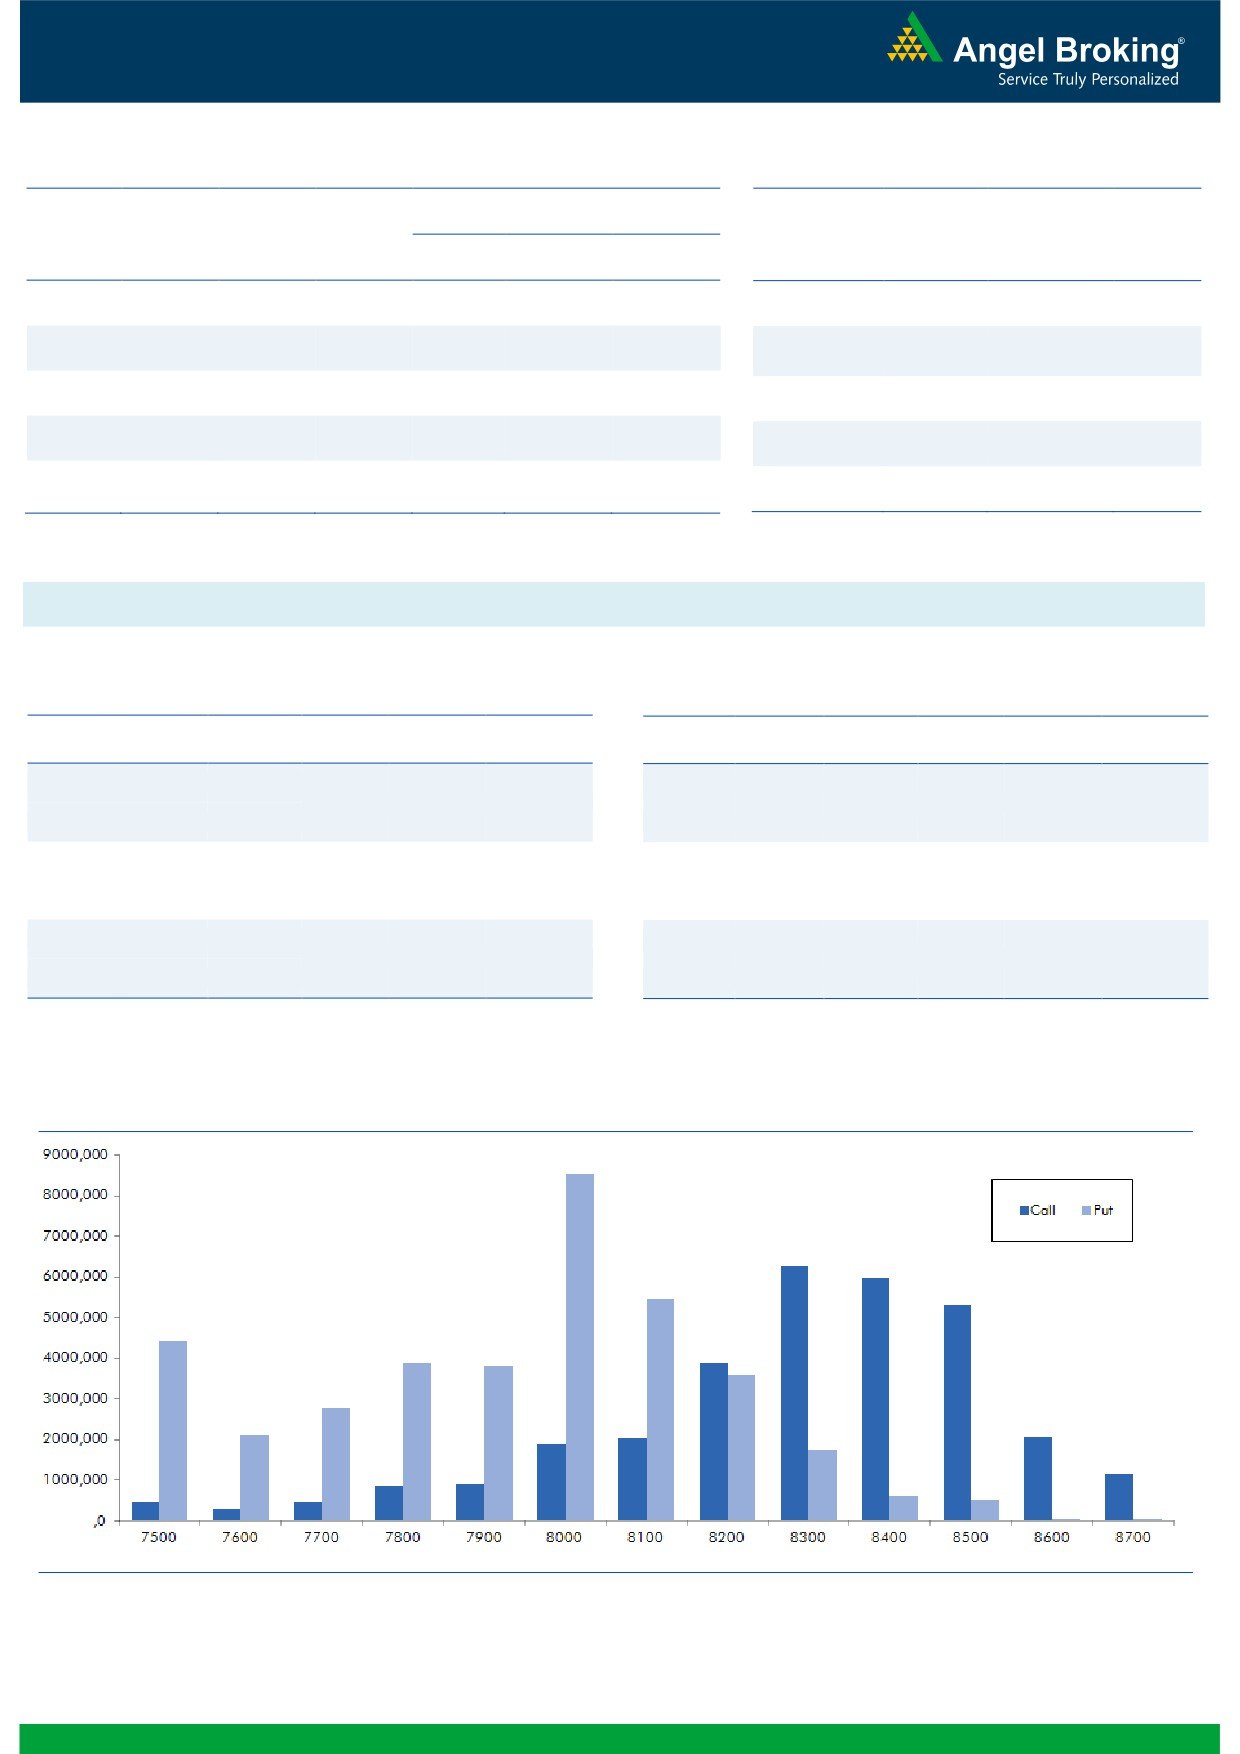
Nifty Vs OI
The Nifty futures open interest has decreased by 5.46%
BankNifty futures open interest has increased by 1.94%
as market closed at 8203.70 levels.
The Nifty June future closed with a premium of 1.35
points against a premium of 5.20 points in previous
session. The July series closed at a premium of 29.75
points.
The Implied Volatility of at the money options has
increased from 18.23% to 20.94%.
The total OI of the market is Rs. 2,58,237/- cr. and the
stock futures OI is Rs. 67,845/- cr.
Few of the liquid counters where we have seen high cost
of carry are JPASSOCIAT, UNITECH, GMRINFRA, IDFC
and AJANTPHARM.
Views
OI Gainers
Yesterday, FIIs were marginal sellers in cash market
OI
PRICE
segment. While in Index Futures, they sold worth Rs. 497
SCRIP
OI
PRICE
CHG. (%)
CHG. (%)
crores with fall in open interest, indicating continuation of
ARVIND
5766800
22.49
324.90
-0.95
long unwinding in last trading session.
JETAIRWAYS
6393800
13.69
564.60
-2.42
On Index Options front, FIIs sold worth Rs. 390 crores
STAR
1172400
10.84
1066.85
-2.10
with rise in open interest. In Call option, 8250 strike was
quite active and added fresh positions. While in Put
INFRATEL
7300900
7.05
339.75
-2.50
option, OI addition was seen in 8000 strike; followed by
PETRONET
4848000
6.74
290.70
2.27
some unwinding in 8100 - 8200 strikes. Maximum OI
in June series remains intact in 8300 call and 8000 put
OI Losers
options.
OI
PRICE
SCRIP
OI
PRICE
FIIs are continuously unwinding their long positions in
CHG. (%)
CHG. (%)
Index and thus most of the longs are now out of the
IOB
7280000
-9.72
26.95
-0.92
system. However, except a fresh short build-up on
HDIL
23636000
-6.53
106.00
0.38
Monday, we didn’t witness any meaningful shorting
VOLTAS
4630400
-5.95
323.00
-0.25
taking place in June series from FIIs. We advise traders
LUPIN
5249700
-5.18
1464.85
0.98
to remain light on positions and avoid taking undue risk
NHPC
26028000
-5.02
24.65
-1.20
ahead of ‘EU Referendum on Brexit’.
Historical Volatility
Put-Call Ratio
SCRIP
HV
SCRIP
PCR-OI
PCR-VOL
HEXAWARE
31.25
NIFTY
1.11
0.93
PETRONET
30.14
BANKNIFTY
0.93
0.88
JSWENERGY
59.60
SBIN
0.93
0.80
GAIL
26.36
RELIANCE
0.51
0.48
DRREDDY
24.54
SUNPHARMA
0.34
0.24
Strategy Date
Symbol
Strategy
Status
May 30, 2016
TCS
Ratio Bull Call Spread
Active
June 06, 2016
NIFTY
Long Call
Exited at Cost
June 13, 2016
ONGC
Ratio Bull Call Spread
Active
June 20, 2016
MARUTI
Long Call Ladder
Active
2
Technical & Derivatives Report
June 23, 2016
FII Statistics for 22-June 2016
Turnover on 22-June 2016
Open Interest
No. of
Turnover
Change
Detail
Buy
Sell
Net
Instrument
Value
Contracts
( in Cr. )
(%)
Contracts
Change (%)
(in Cr.)
INDEX
INDEX
1404.99
1902.16
(497.17)
227898
13663.89
(3.35)
256909
15006.76
38.67
FUTURES
FUTURES
INDEX
INDEX
20335.48
20725.55
(390.07)
1214346
73843.75
3.19
3467061
201527.77
44.82
OPTIONS
OPTIONS
STOCK
4706.65
4358.87
347.78
1092629
54641.37
0.18
STOCK
FUTURES
513229
27018.99
2.10
FUTURES
STOCK
STOCK
3173.09
3139.58
33.51
119178
6230.18
2.45
OPTIONS
322284
17572.16
15.48
OPTIONS
TOTAL
29620.21
30126.16
(505.95)
2654051
148379.20
1.31
TOTAL
4559483
261125.69
36.25
Nifty Spot = 8203.70
Lot Size = 75
Bull-Call Spreads
Bear-Put Spreads
Action
Strike
Price
Risk
Reward
BEP
Action
Strike
Price
Risk
Reward
BEP
Buy
8200
102.85
Buy
8200
98.80
47.30
52.70
8247.30
35.65
64.35
8164.35
Sell
8300
55.55
Sell
8100
63.15
Buy
8200
102.85
Buy
8200
98.80
77.30
122.70
8277.30
58.95
141.05
8141.05
Sell
8400
25.55
Sell
8000
39.85
Buy
8300
55.55
Buy
8100
63.15
30.00
70.00
8330.00
23.30
76.70
8076.70
Sell
8400
25.55
Sell
8000
39.85
Note: Above mentioned Bullish or Bearish Spreads in Nifty (June Series) are given as an information and not as a recommendation.
Nifty Put-Call Analysis
3
Technical & Derivatives Report
June 23, 2016
Daily Pivot Levels for Nifty Constituents
Scrips
S2
S1
PIVOT
R1
R2
ACC
1,552
1,561
1,568
1,578
1,585
ADANIPORTS
201
204
206
210
212
AMBUJACEM
238
240
242
245
246
ASIANPAINT
974
979
984
990
995
AUROPHARMA
702
712
723
732
744
AXISBANK
510
513
517
520
524
BAJAJ-AUTO
2,602
2,617
2,628
2,643
2,654
BANKBARODA
146
148
150
151
153
BHEL
121
122
122
123
124
BPCL
998
1,004
1,009
1,014
1,019
BHARTIARTL
357
360
364
366
370
INFRATEL
327
333
341
347
356
BOSCH
21,472
21,603
21,802
21,933
22,132
CIPLA
476
479
483
486
489
COALINDIA
310
314
316
320
322
DRREDDY
3,032
3,069
3,101
3,138
3,170
EICHERMOT
18,630
18,709
18,754
18,833
18,879
GAIL
366
371
378
382
389
GRASIM
4,234
4,256
4,290
4,311
4,346
HCLTECH
763
767
770
774
778
HDFCBANK
1,162
1,167
1,171
1,176
1,180
HDFC
1,218
1,228
1,235
1,245
1,252
HEROMOTOCO
3,004
3,039
3,059
3,094
3,114
HINDALCO
118
120
122
124
126
HINDUNILVR
851
855
861
866
872
ICICIBANK
233
236
239
242
246
IDEA
100
101
102
102
103
INDUSINDBK
1,080
1,085
1,091
1,097
1,103
INFY
1,176
1,188
1,200
1,212
1,224
ITC
349
352
355
358
362
KOTAKBANK
724
732
741
749
759
LT
1,469
1,480
1,492
1,503
1,514
LUPIN
1,437
1,450
1,458
1,471
1,479
M&M
1,331
1,345
1,363
1,377
1,395
MARUTI
4,097
4,124
4,152
4,180
4,208
NTPC
149
151
152
154
155
ONGC
215
216
218
220
221
POWERGRID
154
155
156
157
158
RELIANCE
972
976
981
985
990
SBIN
209
211
213
215
217
SUNPHARMA
728
734
738
744
748
TCS
2,613
2,640
2,659
2,686
2,705
TATAMTRDVR
306
310
316
321
327
TATAMOTORS
458
466
475
482
492
TATAPOWER
73
73
74
74
75
TATASTEEL
324
328
331
335
338
TECHM
524
528
535
540
547
ULTRACEMCO
3,257
3,284
3,327
3,354
3,397
WIPRO
558
560
562
565
567
YESBANK
1,061
1,070
1,076
1,085
1,091
ZEEL
442
445
449
452
456
4
Technical & Derivatives Report
June 23, 2016
Research Team Tel: 022 - 39357800
For Technical Queries
For Derivatives Queries
DISCLAIMER
Angel Broking Private Limited (hereinafter referred to as “Angel”) is a registered Member of National Stock Exchange of India Limited,
Bombay Stock Exchange Limited and MCX Stock Exchange Limited. It is also registered as a Depository Participant with CDSL and
Portfolio Manager with SEBI. It also has registration with AMFI as a Mutual Fund Distributor. Angel Broking Private Limited is a
registered entity with SEBI for Research Analyst in terms of SEBI (Research Analyst) Regulations, 2014 vide registration number
INH000000164. Angel or its associates has not been debarred/ suspended by SEBI or any other regulatory authority for accessing
/dealing in securities Market. Angel or its associates including its relatives/analyst do not hold any financial interest/beneficial
ownership of more than 1% in the company covered by Analyst. Angel or its associates/analyst has not received any compensation /
managed or co-managed public offering of securities of the company covered by Analyst during the past twelve months. Angel/analyst
has not served as an officer, director or employee of company covered by Analyst and has not been engaged in market making activity
of the company covered by Analyst.
This document is solely for the personal information of the recipient, and must not be singularly used as the basis of any investment
decision. Nothing in this document should be construed as investment or financial advice. Each recipient of this document should
make such investigations as they deem necessary to arrive at an independent evaluation of an investment in the securities of the
companies referred to in this document (including the merits and risks involved), and should consult their own advisors to determine
the merits and risks of such an investment.
Reports based on technical and derivative analysis center on studying charts of a stock's price movement, outstanding positions and
trading volume, as opposed to focusing on a company's fundamentals and, as such, may not match with a report on a company's
fundamentals.
The information in this document has been printed on the basis of publicly available information, internal data and other reliable
sources believed to be true, but we do not represent that it is accurate or complete and it should not be relied on as such, as this
document is for general guidance only. Angel Broking Pvt. Limited or any of its affiliates/ group companies shall not be in any way
responsible for any loss or damage that may arise to any person from any inadvertent error in the information contained in this report.
Angel Broking Pvt. Limited has not independently verified all the information contained within this document. Accordingly, we cannot
testify, nor make any representation or warranty, express or implied, to the accuracy, contents or data contained within this document.
While Angel Broking Pvt. Limited endeavors to update on a reasonable basis the information discussed in this material, there may be
regulatory, compliance, or other reasons that prevent us from doing so.
This document is being supplied to you solely for your information, and its contents, information or data may not be reproduced,
redistributed or passed on, directly or indirectly.
Neither Angel Broking Pvt. Limited, nor its directors, employees or affiliates shall be liable for any loss or damage that may arise from
or in connection with the use of this information.
Note: Please refer to the important ‘Stock Holding Disclosure' report on the Angel website (Research Section). Also, please refer to the
latest update on respective stocks for the disclosure status in respect of those stocks. Angel Broking Pvt. Limited and its affiliates may
have investment positions in the stocks recommended in this report.
5