Technical & Derivatives Report
May 23, 2016
Sensex (25302) / Nifty (7750)
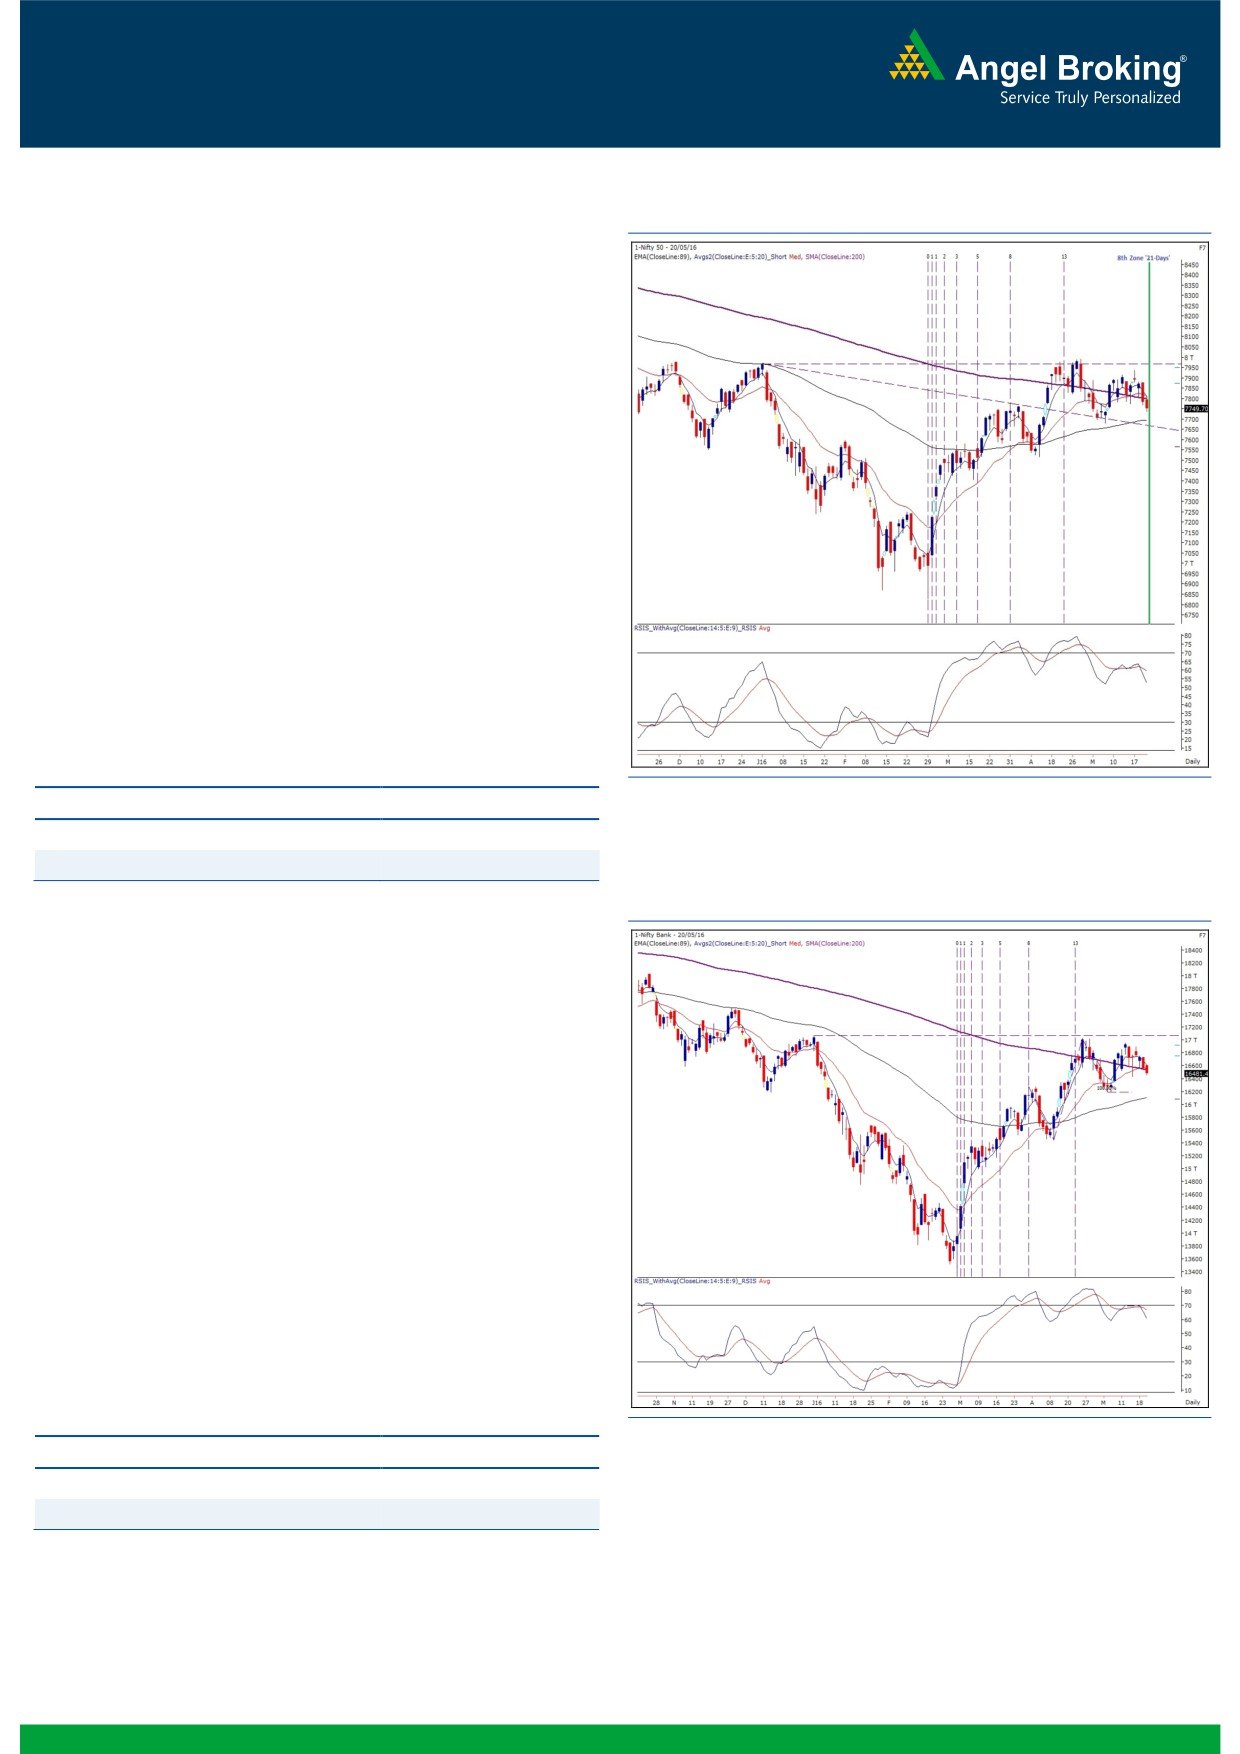
Exhibit 1: Nifty Daily Chart
The indecisiveness continued on Dalal Street in the week gone by;
however, it must be noted that the last two sessions of the week
were completely dominated by the bears.
Technically speaking, the Nifty is now trading slightly above the
recent swing low of 7678.35, which almost coincides with the
daily ’89 EMA’ as well as the ‘Parabolic SAR’ indicator. Going
forward, traders would be meticulously tracking this support zone
as it could act as a trend deciding level in the near term. A
sustainable move below it may lead to further correction towards
the April month low of 7516.85. At the current juncture, if we look
at the ‘Fibonacci Time Series’ from the bottom of 6825.80, the
Nifty will be completing its 8th Time zone (21 days) and will enter
the 9th time zone of ‘34 Days’ on Monday. Generally, such points
are seen as ‘Potential Reversal Zones’ and hence, as long as the
Nifty manages to hold 7678.35, we would hope for this new
‘Time Zone’ to turn positive for our markets. On the upside, 7940
- 8000 levels are seen as major hurdles for the index.
Key Levels
Support 1 - 7720
Resistance 1 - 7800
Support 2 - 7678
Resistance 2 - 7845
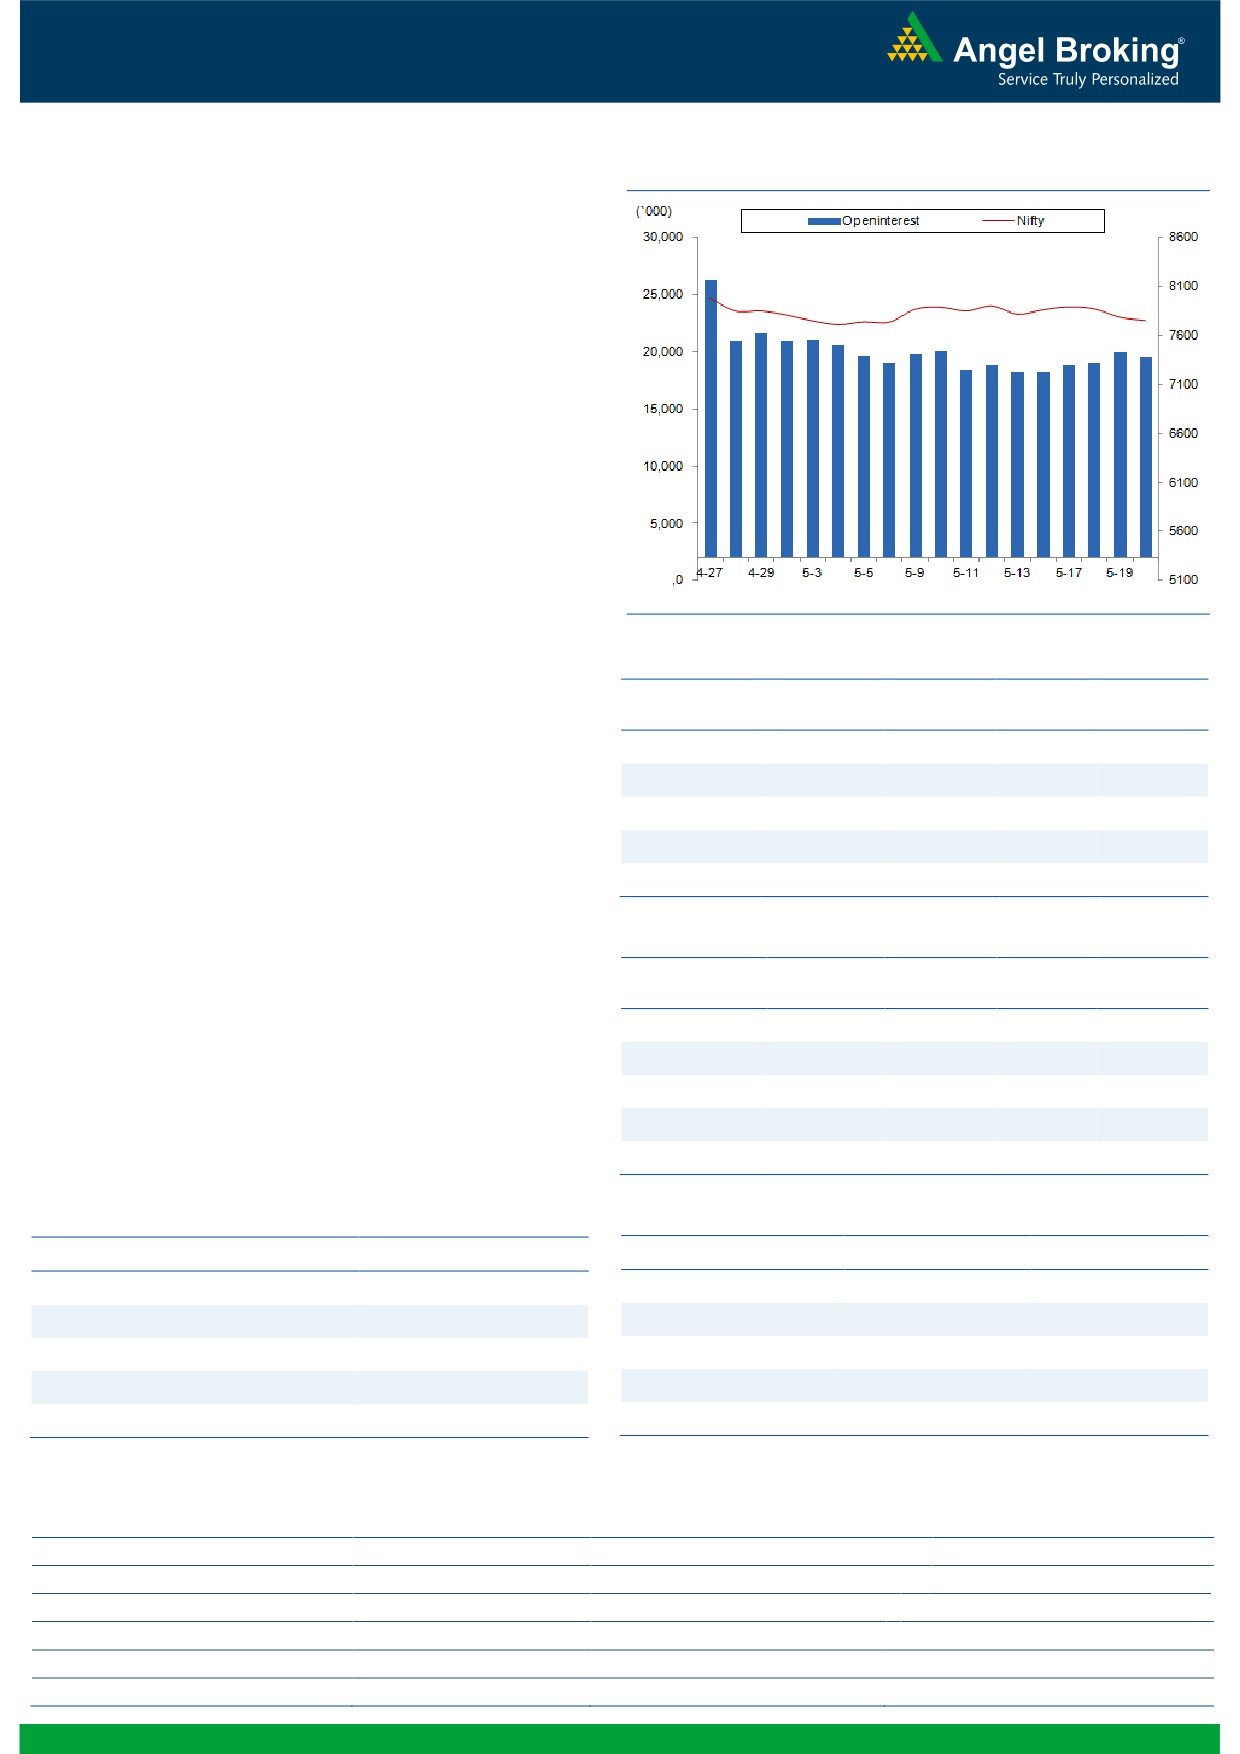
Exhibit 2: Nifty Bank Daily Chart
Nifty Bank Outlook - (16481)
The Nifty Bank index opened with marginal upside gap on Friday
and remained in a narrow range of 100 points in first half of the
sesison. However, we witnessed a selling pressure in concluding
hour and as a result, the banking index ended the session with a
loss of 0.51 percent over its previous close.
The banking index is currently trading above its previous swing
low of 16431.65 on hourly chat and thus, the uptrend is still
intact. On weekly chart, the Nifty Bank index traded within the
territory of previous week’s price action. Hence, the high (16962)
and low (16357) of previous week will be a trend deciding levels
for the index. Going forward, intraday support fot the index is
placed at 16431 and 16357 levels; while, resistance is seen at
16625 and 16780 levels. Traders are advised to remain light and
wait for further development on chart before initiating any
positional trade in the banking index.
Key Levels
Support 1 - 16431
Resistance 1 - 16625
Support 2 - 16357
Resistance 2 - 16780
1
Technical & Derivatives Report
May 23, 2016
Comments
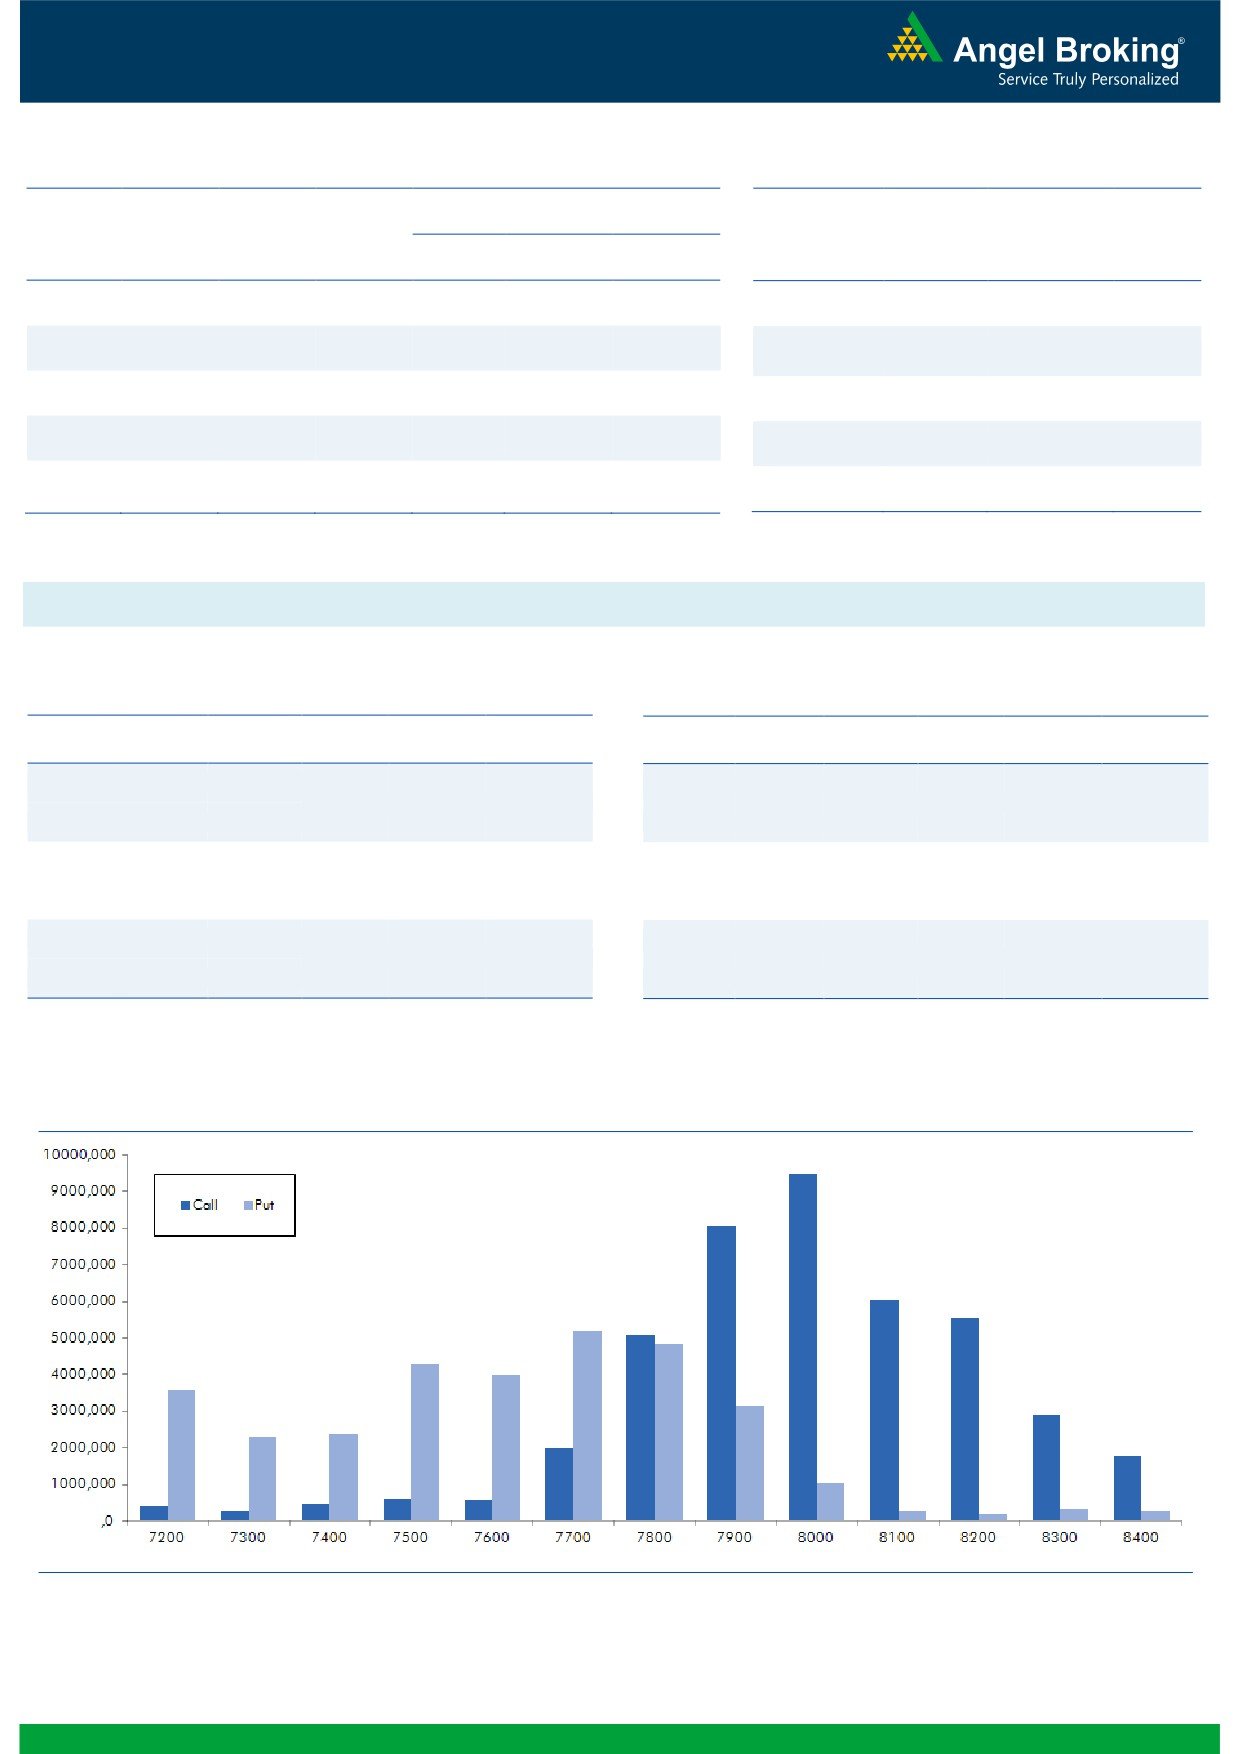
Nifty Vs OI
The Nifty futures open interest has decreased by 2.02%
BankNifty futures open interest has decreased by 2.42%
as market closed at 7749.70 levels.
The Nifty May future closed at a premium of 13.65
points against a premium of 1.70 points. The June series
closed at a premium of 18.25 points.
The Implied Volatility of at the money options has
decreased from 16.79% to 14.65%.
The total OI of the market is Rs. 2,46,929/- cr. and the
stock futures OI is Rs. 63,083/- cr.
Few of the liquid counters where we have seen high cost
of carry are UNITECH, ANDHRABANK, BOSCHLTD,
TATAPOWER and HEXAWARE.
Views
On Friday, the FIIs sold in equities worth Rs. 744 crores.
OI Gainers
While, they were marginal seller in index future with fall
OI
PRICE
in OI, indicating blend of long unwinding and short
SCRIP
OI
PRICE
CHG. (%)
CHG. (%)
covering.
ICIL
484500
14.27
913.70
-0.44
In Index Options front, FIIs were net seller worth Rs. 566
KTKBANK
14392000
13.50
120.45
7.31
crores with marginal rise in OI. In call options, 7800 -
HEXAWARE
6598000
12.86
209.40
-0.83
7850 strike were active and added fresh positions; while
ITC
29867200
12.74
330.75
1.57
unwinding was seen in 8200 and 8000 call options.
ADANIENT
14994000
9.94
69.05
-3.36
Whereas, in put options, some OI addition was seen in
7650 strike; followed by unwinding in 7700 strike.
Maximum OI in current series is seen at 8000 call and
OI Losers
7700 put options.
OI
PRICE
SCRIP
OI
PRICE
In last week, except a selling on Wednesday, we didn’t
CHG. (%)
CHG. (%)
HDIL
23622000
-12.80
93.75
1.74
witness any major activity in index future by FIIs. Their
activity remained subdued in index option segment too.
SUNTV
4816000
-7.21
375.80
0.95
Hence, it’s prudent to wait for noticeable data from FIIs
IBREALEST
24012000
-5.42
91.40
-1.72
to initiate any fresh positions in index. Rollover in Nifty
NMDC
8837000
-5.20
91.70
1.78
and BankNifty are 13.66% and 10.05% respectively.
UPL
8502000
-5.07
578.30
2.73
Historical Volatility
Put-Call Ratio
SCRIP
HV
SCRIP
PCR-OI
PCR-VOL
PIDILITIND
33.79
NIFTY
0.83
0.78
LUPIN
54.80
BANKNIFTY
0.82
0.73
KTKBANK
47.86
SBIN
0.39
0.30
TORNTPHARM
30.33
RELIANCE
0.36
0.46
JETAIRWAYS
42.96
ICICIBANK
0.42
0.57
Strategy Date
Symbol
Strategy
Status
02-05-2016
NIFTY
Long Strangle
Active
09-05-2016
RELIANCE
Long Put
Loss Booked on May 17, 2016
16-05-2016
LT
Short Strangle
Active
2
Technical & Derivatives Report
May 23, 2016
FII Statistics for 20-May 2016
Turnover on 20-May 2016
Open Interest
No. of
Turnover
Change
Detail
Buy
Sell
Net
Instrument
Value
Contracts
( in Cr. )
(%)
Contracts
Change (%)
(in Cr.)
INDEX
INDEX
1444.32
1489.24
(44.91)
264465
15027.18
(2.77)
281733
15610.08
-10.84
FUTURES
FUTURES
INDEX
INDEX
35348.55
35914.55
(566.00)
1289088
74047.54
1.70
4443375
256967.22
0.16
OPTIONS
OPTIONS
STOCK
5391.86
5251.94
139.93
1056343
49684.56
(0.58)
STOCK
FUTURES
608893
29193.87
-11.96
FUTURES
STOCK
STOCK
3580.04
3892.61
(312.57)
96224
4536.86
4.63
OPTIONS
408673
19952.62
-9.94
OPTIONS
TOTAL
45764.78
46548.34
(783.56)
2706120
143296.14
0.45
TOTAL
5742674
321723.80
-2.33
Nifty Spot = 7749.70
Lot Size = 75
Bull-Call Spreads
Bear-Put Spreads
Action
Strike
Price
Risk
Reward
BEP
Action
Strike
Price
Risk
Reward
BEP
Buy
7800
40.95
Buy
7700
33.60
26.80
73.20
7826.80
20.80
79.20
7679.20
Sell
7900
14.15
Sell
7600
12.80
Buy
7800
40.95
Buy
7700
33.60
36.30
163.70
7836.30
28.05
171.95
7671.95
Sell
8000
4.65
Sell
7500
5.55
Buy
7900
14.15
Buy
7600
12.80
9.50
90.50
7909.50
7.25
92.75
7592.75
Sell
8000
4.65
Sell
7500
5.55
Note: Above mentioned Bullish or Bearish Spreads in Nifty (May Series) are given as an information and not as a recommendation.
Nifty Put-Call Analysis
3
Technical & Derivatives Report
May 23, 2016
Daily Pivot Levels for Nifty Constituents
Scrips
S2
S1
PIVOT
R1
R2
ACC
1,372
1,383
1,401
1,411
1,430
ADANIPORTS
166
172
176
182
186
AMBUJACEM
203
206
210
213
218
ASIANPAINT
944
950
957
962
969
AUROPHARMA
755
763
769
776
782
AXISBANK
484
487
491
495
499
BAJAJ-AUTO
2,413
2,433
2,447
2,467
2,482
BANKBARODA
132
133
136
138
140
BHEL
118
119
120
120
121
BPCL
899
910
929
939
958
BHARTIARTL
335
339
343
346
350
INFRATEL
368
373
380
385
392
BOSCH
20,770
20,910
21,080
21,220
21,390
CIPLA
494
500
508
515
522
COALINDIA
276
278
279
281
282
DRREDDY
3,011
3,022
3,034
3,045
3,057
EICHERMOT
18,027
18,154
18,252
18,379
18,477
GAIL
366
369
373
376
380
GRASIM
4,169
4,188
4,219
4,238
4,269
HCLTECH
724
730
735
741
746
HDFCBANK
1,126
1,134
1,141
1,148
1,156
HDFC
1,160
1,170
1,182
1,192
1,203
HEROMOTOCO
2,854
2,875
2,893
2,914
2,931
HINDALCO
85
86
87
88
89
HINDUNILVR
798
805
813
820
828
ICICIBANK
215
218
222
224
229
IDEA
105
107
109
111
113
INDUSINDBK
1,051
1,061
1,069
1,078
1,086
INFY
1,188
1,195
1,207
1,214
1,227
ITC
317
324
331
338
345
KOTAKBANK
694
698
704
708
715
LT
1,233
1,244
1,262
1,273
1,291
LUPIN
1,420
1,462
1,540
1,583
1,661
M&M
1,267
1,280
1,301
1,314
1,335
MARUTI
3,850
3,898
3,928
3,976
4,006
NTPC
134
136
137
138
139
ONGC
209
211
213
215
217
POWERGRID
143
144
145
145
146
RELIANCE
917
926
940
949
963
SBIN
168
170
172
174
176
SUNPHARMA
785
788
793
796
801
TCS
2,496
2,513
2,539
2,556
2,582
TATAMTRDVR
258
261
265
267
271
TATAMOTORS
378
381
387
390
396
TATAPOWER
68
69
69
70
71
TATASTEEL
318
320
324
326
330
TECHM
465
471
480
485
495
ULTRACEMCO
3,071
3,102
3,153
3,184
3,235
WIPRO
539
541
545
547
550
YESBANK
958
968
975
985
992
ZEEL
428
431
436
439
445
4
Technical & Derivatives Report
May 23, 2016
Research Team Tel: 022 - 39357800
For Technical Queries
For Derivatives Queries
DISCLAIMER
Angel Broking Private Limited (hereinafter referred to as “Angel”) is a registered Member of National Stock Exchange of India Limited,
Bombay Stock Exchange Limited and MCX Stock Exchange Limited. It is also registered as a Depository Participant with CDSL and
Portfolio Manager with SEBI. It also has registration with AMFI as a Mutual Fund Distributor. Angel Broking Private Limited is a
registered entity with SEBI for Research Analyst in terms of SEBI (Research Analyst) Regulations, 2014 vide registration number
INH000000164. Angel or its associates has not been debarred/ suspended by SEBI or any other regulatory authority for accessing
/dealing in securities Market. Angel or its associates including its relatives/analyst do not hold any financial interest/beneficial
ownership of more than 1% in the company covered by Analyst. Angel or its associates/analyst has not received any compensation /
managed or co-managed public offering of securities of the company covered by Analyst during the past twelve months. Angel/analyst
has not served as an officer, director or employee of company covered by Analyst and has not been engaged in market making activity
of the company covered by Analyst.
This document is solely for the personal information of the recipient, and must not be singularly used as the basis of any investment
decision. Nothing in this document should be construed as investment or financial advice. Each recipient of this document should
make such investigations as they deem necessary to arrive at an independent evaluation of an investment in the securities of the
companies referred to in this document (including the merits and risks involved), and should consult their own advisors to determine
the merits and risks of such an investment.
Reports based on technical and derivative analysis center on studying charts of a stock's price movement, outstanding positions and
trading volume, as opposed to focusing on a company's fundamentals and, as such, may not match with a report on a company's
fundamentals.
The information in this document has been printed on the basis of publicly available information, internal data and other reliable
sources believed to be true, but we do not represent that it is accurate or complete and it should not be relied on as such, as this
document is for general guidance only. Angel Broking Pvt. Limited or any of its affiliates/ group companies shall not be in any way
responsible for any loss or damage that may arise to any person from any inadvertent error in the information contained in this report.
Angel Broking Pvt. Limited has not independently verified all the information contained within this document. Accordingly, we cannot
testify, nor make any representation or warranty, express or implied, to the accuracy, contents or data contained within this document.
While Angel Broking Pvt. Limited endeavors to update on a reasonable basis the information discussed in this material, there may be
regulatory, compliance, or other reasons that prevent us from doing so.
This document is being supplied to you solely for your information, and its contents, information or data may not be reproduced,
redistributed or passed on, directly or indirectly.
Neither Angel Broking Pvt. Limited, nor its directors, employees or affiliates shall be liable for any loss or damage that may arise from
or in connection with the use of this information.
Note: Please refer to the important ‘Stock Holding Disclosure' report on the Angel website (Research Section). Also, please refer to the
latest update on respective stocks for the disclosure status in respect of those stocks. Angel Broking Pvt. Limited and its affiliates may
have investment positions in the stocks recommended in this report.
5