Technical & Derivatives Report
February 23, 2016
Sensex (23789) / Nifty (7235)
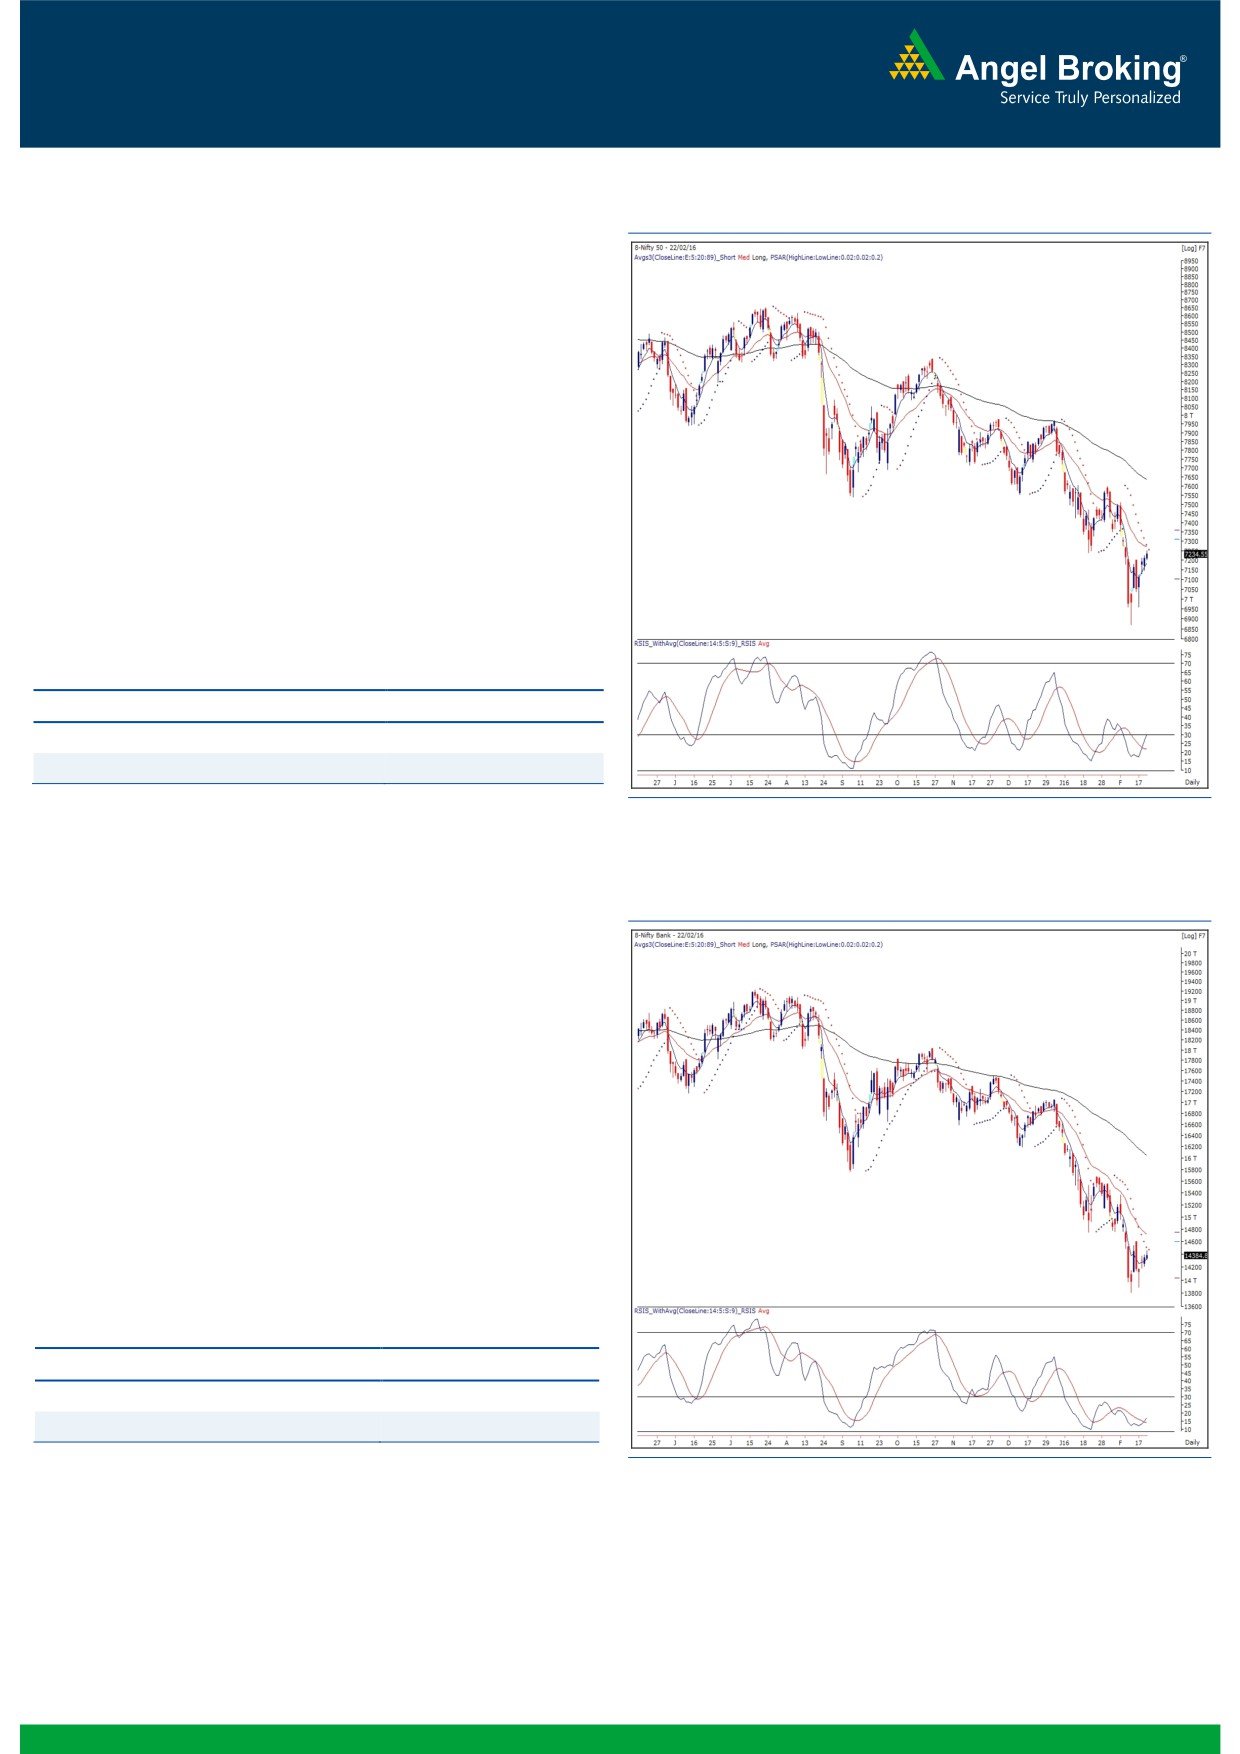
Exhibit 1: Nifty Daily Chart
The opening session of the week began marginally in the
positive territory citing positive global cues. During the
remaining part of the day, the Nifty maintained its positive
bias; but, the overall intraday range was quite narrow.
Eventually, the Nifty ended the session with the gains of one
third of a percent over its previous session.
Going forward, we expect this momentum to continue and in
the process, the Nifty may gradually move towards the 7280
mark. In the coming session, we may expect similar movement
in the index; but, lots of individual stocks are likely to
outperform. Thus, traders should maintain their stock centric
approach by following strict stop losses. Immediate support for
the indx is placed at 7190 and 7127 levels; while, resistance is
seen at 7280 and 7350 levels.
Key Levels
Support 1 - 7190
Resistance 1 - 7280
Support 2 - 7127
Resistance 2 -
7350
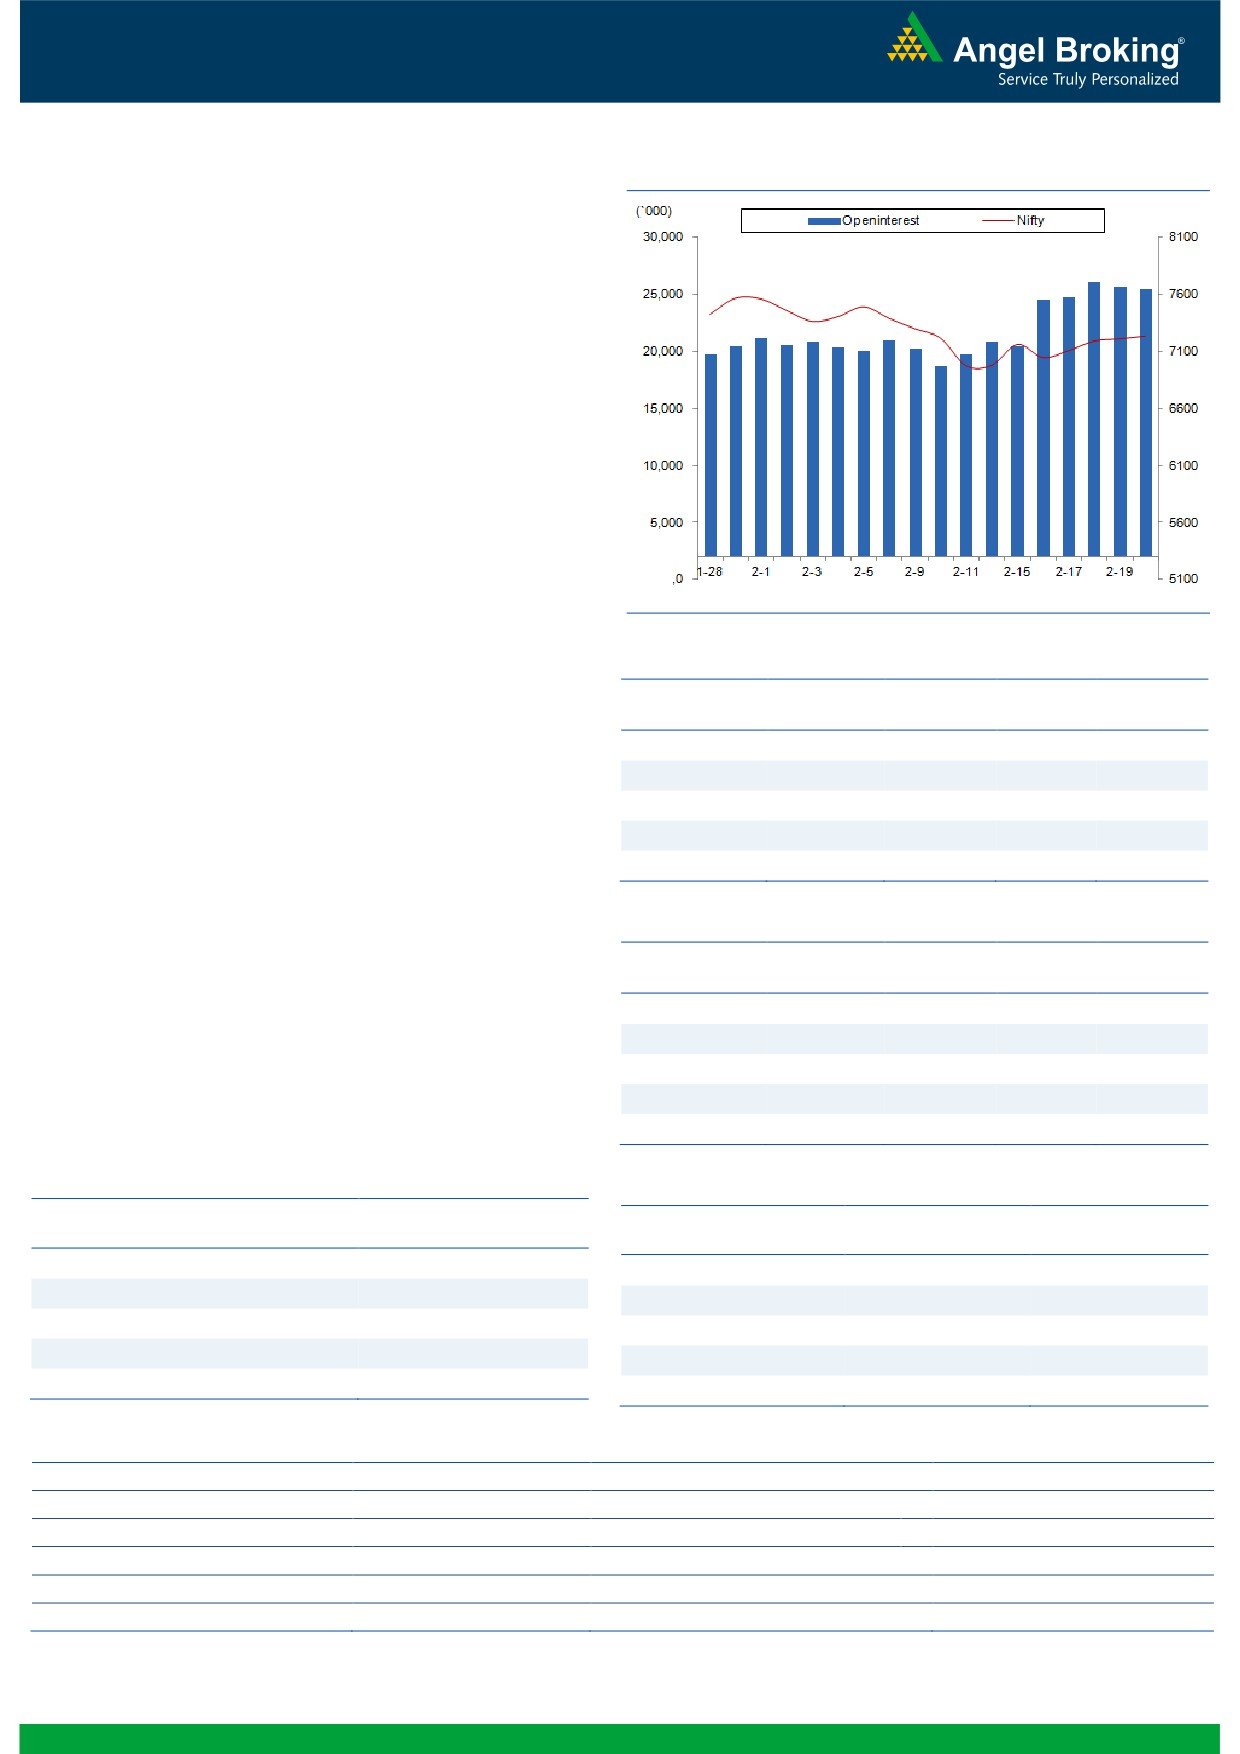
Exhibit 2: Bank Nifty Weekly Chart
Bank Nifty Outlook - (14385)
In yesterday's trading session too, the Nifty Bank index traded
in a narrow range and had formed a small body candle to
end the session with marginal gains of about 0.28% over its
previous session.
Last three trading sessions have been range bound and have
not changed any set ups; thus we continue with our view of a
possibility of bounce in the index upto 14570-14600 in near
term. Traders can take stock specific approach in stocks within
the sector and trade with proper risk management strategy.
The near term support for index is placed around 14120 and
13890; whereas, resistances are seen around 14525 and
14600.
Key Levels
Support 1 - 14120
Resistance 1 - 14525
Support 2 - 13890
Resistance 2 - 14600
1
Technical & Derivatives Report
February 23, 2016
Comments
Nifty Vs OI
The Nifty futures open interest has decreased by 1.04%
BankNifty futures open interest has increased by 7.91%
as market closed at 7234.55 levels.
The Nifty February future closed at a premium of 6.15
points against a premium of 1.70 points. The March
series closed at a premium of 23.70 points.
The Implied Volatility of at the money options has
increased from 16.13% to 16.74%.
The total OI of the market is Rs. 2,51,586/- cr. and the
stock futures OI is Rs. 62,429/- cr.
Few of the liquid counters where we have seen high cost
of carry are GMRINFRA, JPASSOCIAT, ALBK, BHEL and
IDFC.
Views
OI Gainers
OI
PRICE
FIIs were net sellers in both index future and cash market
SCRIP
OI
PRICE
CHG. (%)
CHG. (%)
segment yesterday. They sold equities to the tune of Rs.
BAJFINANCE
228875
21.99
6023.90
-0.80
656 crores. While in Index Futures, they sold worth Rs.
OFSS
183900
14.47
3264.50
0.04
378 crores with rise in open interest, indicating fresh
TV18BRDCST
74154000
13.95
37.10
0.95
short formation in last trading session.
BEML
690000
12.29
1039.45
6.57
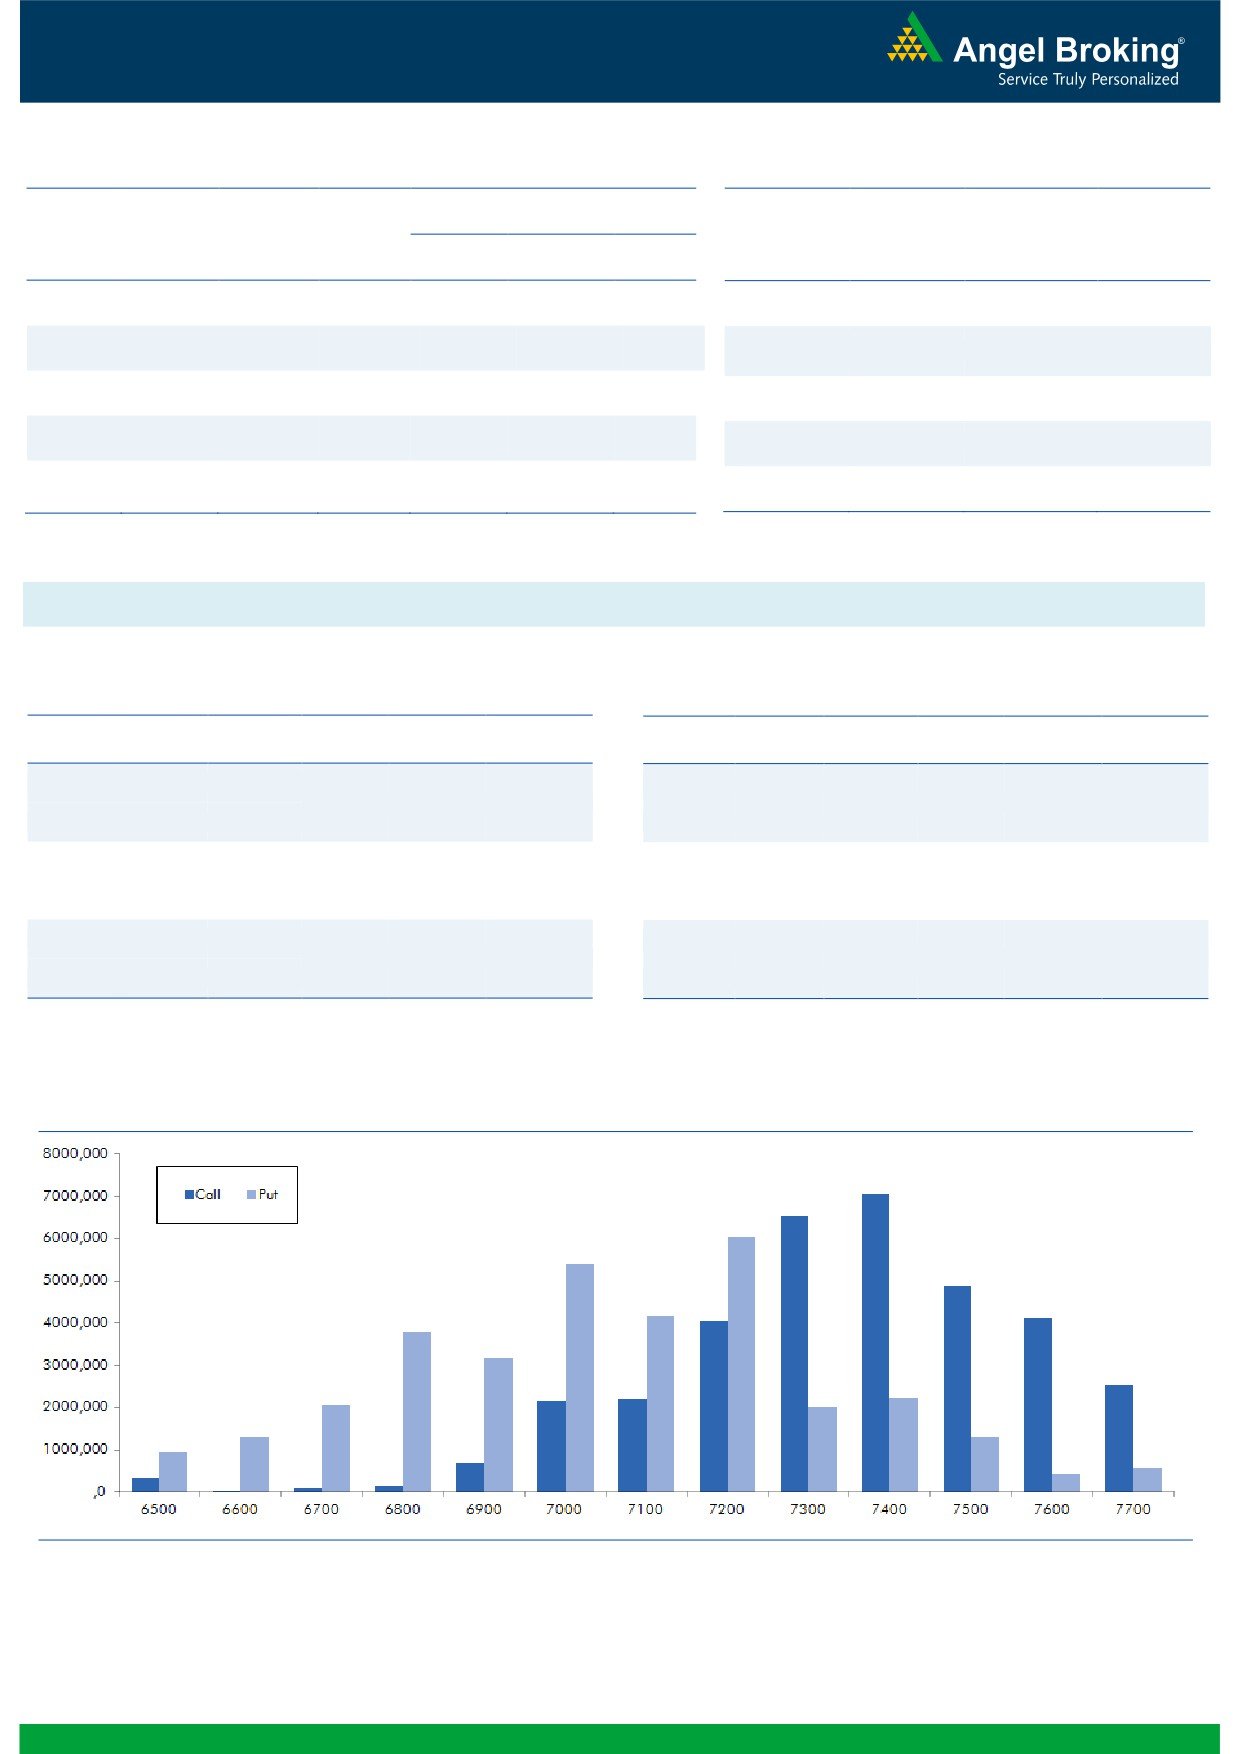
In Index Options front, the overall activity was subdued.
IDFC
86862600
11.87
40.85
-0.85
In call options, 7300 and 7400 strike added some OI.
Whereas, in put options, some build-up was visible in
OI Losers
7200 strike. Maximum OI in current series is visible in
OI
PRICE
7400 call and 7200 put options. Rollover in Nifty and
SCRIP
OI
PRICE
CHG. (%)
CHG. (%)
BankNifty is at 26.89% and 23.16% respectively. Large
UNITECH
254331000
-10.80
3.90
2.63
cap counters that added good amount of OI are
WIPRO
8043000
-10.79
542.05
-1.08
MARUTI, COALINDIA, HEROMOTOCO, BPCL and
SBIN
83092000
-8.98
164.90
0.24
NTPC.
AMARAJABAT
561000
-7.79
889.75
0.20
ACC
2280000
-7.54
1283.65
0.75
Historical Volatility
Put-Call Ratio
SCRIP
HV
SCRIP
PCR-OI
PCR-VOL
HINDUNILVR
34.21
NIFTY
0.78
0.91
MARICO
36.32
BANKNIFTY
0.77
0.87
ULTRACEMCO
30.42
SBIN
0.54
0.43
BOSCHLTD
37.79
ICICIBANK
0.40
0.42
GRASIM
21.68
MARUTI
0.41
0.54
Strategy Date
Symbol
Strategy
Status
February 01, 2016
BHEL
Bull Call Spread
Active
February 08, 2016
NIFTY
Short Strangle
Marginal loss booked on 22-02-2016
February 15, 2016
AXISBANK
Bull Call Spread
Active
February 22, 2016
HINDUNILVR
Long Call
Not Activated
2
Technical & Derivatives Report
February 23, 2016
FII Statistics for 22-February 2016
Turnover on 22-February 2016
Open Interest
No. of
Turnover
Change
Detail
Buy
Sell
Net
Instrument
Value
Change
Contracts
( in Cr. )
(%)
Contracts
(in Cr.)
(%)
INDEX
INDEX
3504.57
3882.89
(378.32)
343810
17826.59
4.50
305607
15230.96
-1.96
FUTURES
FUTURES
INDEX
INDEX
25380.82
25300.46
80.36
1468069
78041.07
(0.54)
3997625
210281.49
-11.09
OPTIONS
OPTIONS
STOCK
16773.86
16420.07
353.80
1207833
51988.29
2.41
STOCK
FUTURES
1029042
44775.35
70.16
FUTURES
STOCK
STOCK
1851.03
1918.06
(67.02)
91989
3855.65
1.02
OPTIONS
291062
12751.62
-8.50
OPTIONS
TOTAL
47510.29
47521.48
(11.18)
3111701
151711.60
1.18
TOTAL
5623336
283039.41
-3.17
Nifty Spot = 7234.55
Lot Size = 75
Bull-Call Spreads
Bear-Put Spreads
Action
Strike
Price
Risk
Reward
BEP
Action
Strike
Price
Risk
Reward
BEP
Buy
7300
17.00
Buy
7200
26.15
13.50
86.50
7313.50
17.90
82.10
7182.10
Sell
7400
3.50
Sell
7100
8.25
Buy
7300
17.00
Buy
7200
26.15
15.90
184.10
7315.90
23.30
176.70
7176.70
Sell
7500
1.10
Sell
7000
2.85
Buy
7400
3.50
Buy
7100
8.25
2.40
97.60
7402.40
5.40
94.60
7094.60
Sell
7500
1.10
Sell
7000
2.85
Note: Above mentioned Bullish or Bearish Spreads in Nifty (Feb. Series) are given as an information and not as a recommendation.
Nifty Put-Call Analysis
3
Technical & Derivatives Report
February 23, 2016
Daily Pivot Levels for Nifty 50 Stocks
Scrips
S2
S1
PIVOT
R1
R2
ACC
1,259
1,270
1,279
1,290
1,298
ADANIPORTS
200
203
207
210
215
AMBUJACEM
194
195
196
197
198
ASIANPAINT
847
859
866
878
885
AXISBANK
388
393
396
400
403
BAJAJ-AUTO
2,437
2,457
2,471
2,491
2,505
BANKBARODA
134
137
139
142
144
BHARTIARTL
316
322
329
335
342
BHEL
99
100
102
103
104
BOSCHLTD
16,634
16,974
17,231
17,571
17,828
BPCL
739
749
760
770
780
CAIRN
129
130
132
133
134
CIPLA
522
526
529
533
536
COALINDIA
308
311
313
317
319
DRREDDY
3,047
3,078
3,098
3,128
3,148
GAIL
311
316
323
328
335
GRASIM
3,405
3,444
3,469
3,508
3,533
HCLTECH
836
841
845
850
855
HDFC
1,041
1,050
1,057
1,065
1,073
HDFCBANK
976
983
989
996
1,002
HEROMOTOCO
2,648
2,675
2,702
2,729
2,756
HINDALCO
68
69
70
70
71
HINDUNILVR
812
837
851
876
891
ICICIBANK
194
196
199
201
204
IDEA
107
108
110
111
112
INDUSINDBK
832
838
847
853
862
INFY
1,105
1,116
1,125
1,136
1,145
ITC
289
295
299
304
308
KOTAKBANK
628
634
638
644
648
LT
1,125
1,137
1,153
1,165
1,181
LUPIN
1,766
1,789
1,803
1,825
1,840
M&M
1,222
1,230
1,239
1,247
1,256
MARUTI
3,466
3,493
3,519
3,547
3,573
NTPC
122
124
129
131
135
ONGC
209
212
213
216
218
PNB
73
74
76
77
79
POWERGRID
137
138
140
141
143
RELIANCE
934
948
958
972
982
SBIN
162
164
165
167
168
VEDL
71
73
74
75
77
SUNPHARMA
861
872
879
890
897
TATAMOTORS
308
314
319
324
329
TATAPOWER
58
58
59
59
60
TATASTEEL
249
252
255
258
261
TCS
2,283
2,300
2,321
2,338
2,359
TECHM
418
425
433
440
449
ULTRACEMCO
2,817
2,870
2,900
2,953
2,983
WIPRO
531
537
542
548
554
YESBANK
703
708
714
719
725
ZEEL
378
386
390
398
402
4
Technical & Derivatives Report
February 23, 2016
Research Team Tel: 022 - 39357800
For Technical Queries
For Derivatives Queries
DISCLAIMER
Angel Broking Private Limited (hereinafter referred to as “Angel”) is a registered Member of National Stock Exchange of India Limited,
Bombay Stock Exchange Limited and MCX Stock Exchange Limited. It is also registered as a Depository Participant with CDSL and
Portfolio Manager with SEBI. It also has registration with AMFI as a Mutual Fund Distributor. Angel Broking Private Limited is a
registered entity with SEBI for Research Analyst in terms of SEBI (Research Analyst) Regulations, 2014 vide registration number
INH000000164. Angel or its associates has not been debarred/ suspended by SEBI or any other regulatory authority for accessing
/dealing in securities Market. Angel or its associates including its relatives/analyst do not hold any financial interest/beneficial
ownership of more than 1% in the company covered by Analyst. Angel or its associates/analyst has not received any compensation /
managed or co-managed public offering of securities of the company covered by Analyst during the past twelve months. Angel/analyst
has not served as an officer, director or employee of company covered by Analyst and has not been engaged in market making activity
of the company covered by Analyst.
This document is solely for the personal information of the recipient, and must not be singularly used as the basis of any investment
decision. Nothing in this document should be construed as investment or financial advice. Each recipient of this document should
make such investigations as they deem necessary to arrive at an independent evaluation of an investment in the securities of the
companies referred to in this document (including the merits and risks involved), and should consult their own advisors to determine
the merits and risks of such an investment.
Reports based on technical and derivative analysis center on studying charts of a stock's price movement, outstanding positions and
trading volume, as opposed to focusing on a company's fundamentals and, as such, may not match with a report on a company's
fundamentals.
The information in this document has been printed on the basis of publicly available information, internal data and other reliable
sources believed to be true, but we do not represent that it is accurate or complete and it should not be relied on as such, as this
document is for general guidance only. Angel Broking Pvt. Limited or any of its affiliates/ group companies shall not be in any way
responsible for any loss or damage that may arise to any person from any inadvertent error in the information contained in this report.
Angel Broking Pvt. Limited has not independently verified all the information contained within this document. Accordingly, we cannot
testify, nor make any representation or warranty, express or implied, to the accuracy, contents or data contained within this document.
While Angel Broking Pvt. Limited endeavors to update on a reasonable basis the information discussed in this material, there may be
regulatory, compliance, or other reasons that prevent us from doing so.
This document is being supplied to you solely for your information, and its contents, information or data may not be reproduced,
redistributed or passed on, directly or indirectly.
Neither Angel Broking Pvt. Limited, nor its directors, employees or affiliates shall be liable for any loss or damage that may arise from
or in connection with the use of this information.
Note: Please refer to the important ‘Stock Holding Disclosure' report on the Angel website (Research Section). Also, please refer to the
latest update on respective stocks for the disclosure status in respect of those stocks. Angel Broking Pvt. Limited and its affiliates may
have investment positions in the stocks recommended in this report.
5