Technical & Derivatives Report
December 22, 2015
Sensex (25736) / Nifty (7834)
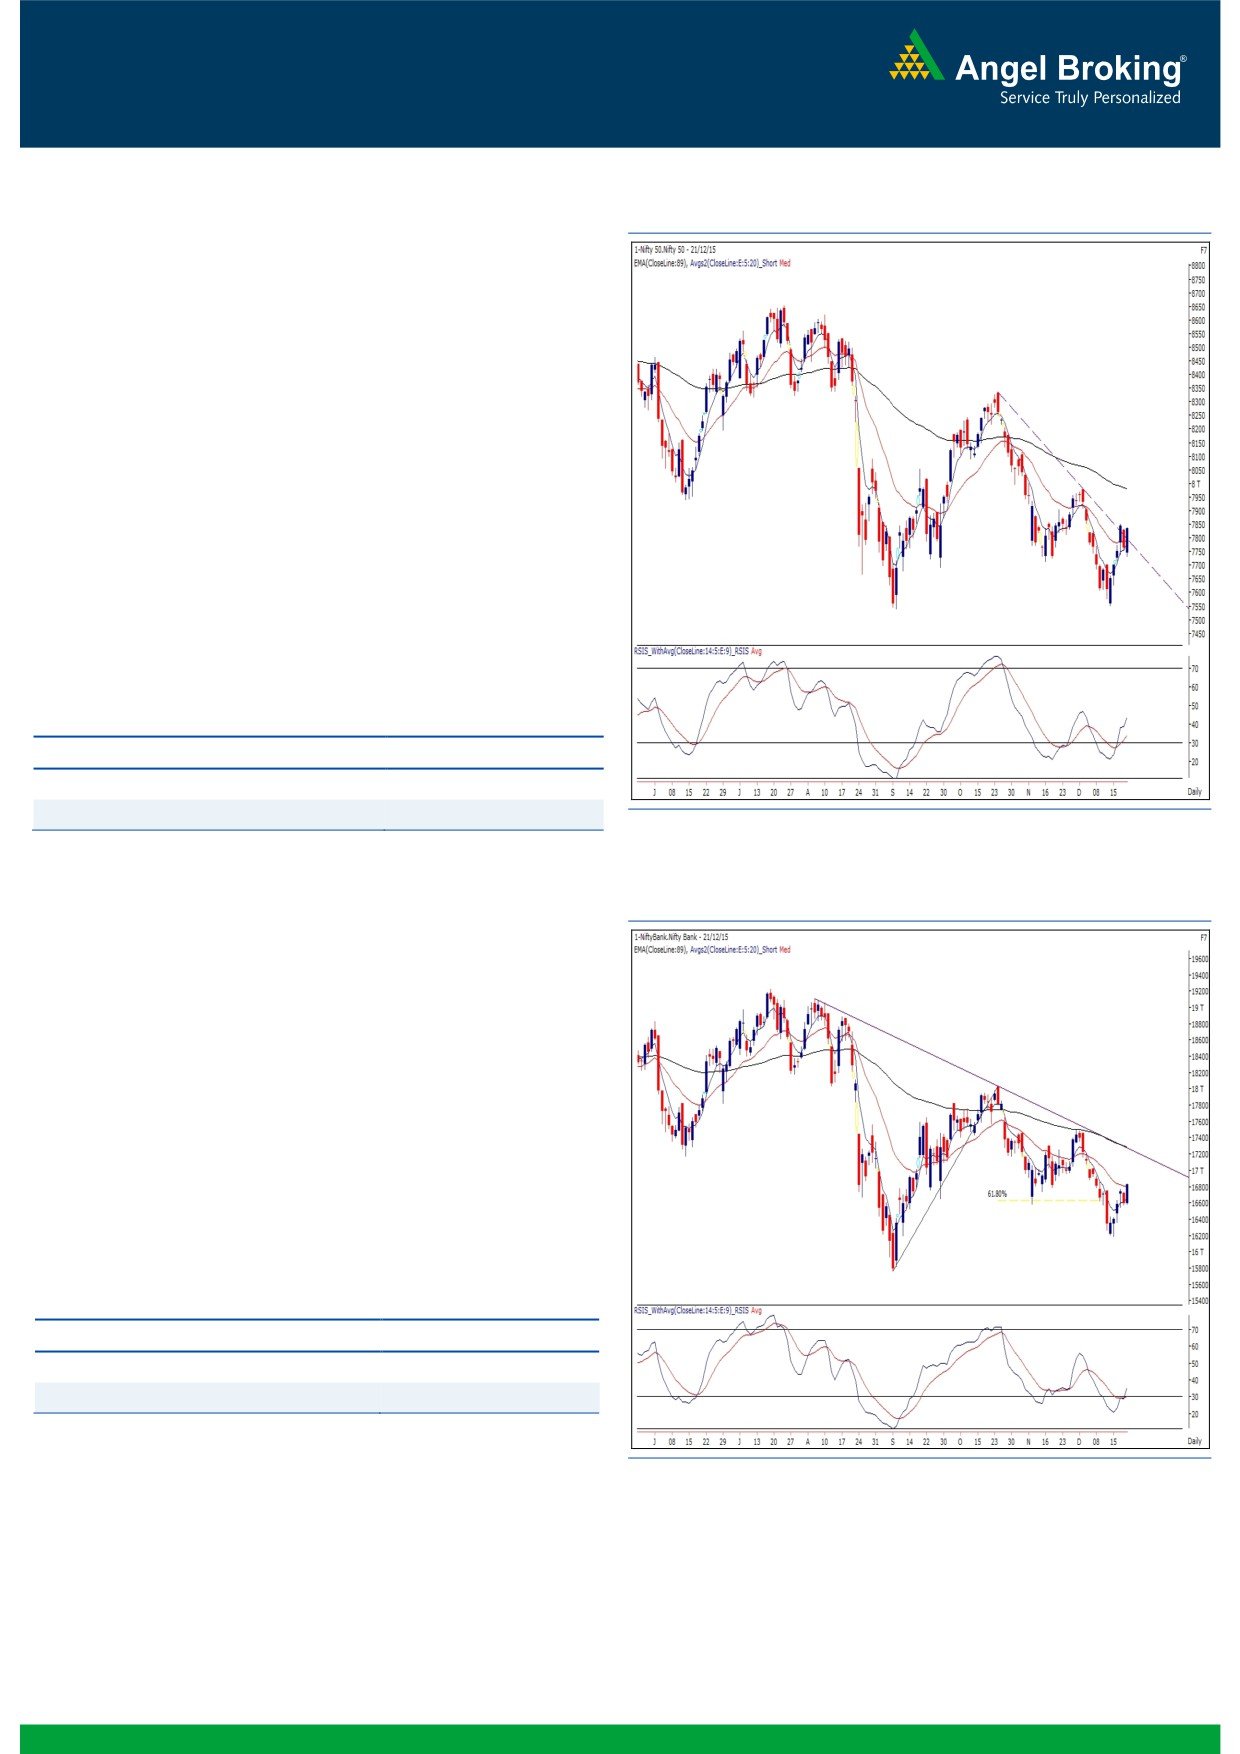
Exhibit 1: Nifty Daily Chart
Trading for the week began on a soft note despite extremely
negative cues from US bourses. The index managed to recover
steadily in the initial hour and kept on ascending throughout the
remaining part of the day. As a result, the Nifty eventually ended
the session with nearly a percent gains.
Our markets completely outperformed its peers across the globe
as we witnessed a good traction throughout the session. After a
modest profit booking on Friday, the Nifty managed to regain the
7800 mark. As mentioned in our previous report, the Nifty has
now closed above 7800 and thus, has unfolded further up move
towards 7920 - 7970 levels. On the flipside, yesterday’s low of
7733.45 would now be seen an important support level. We
believe that the index may overall remain range bound in coming
sessions and thus, due to lack of trade set up in the index, it’s
advisable to focus on individual stocks. We continue to
recommend trading with a proper exit strategy and avoiding
undue risks.
Key Levels
Support 1 - 7760
Resistance 1 - 7920
Support 2 - 7733
Resistance 2 - 7970
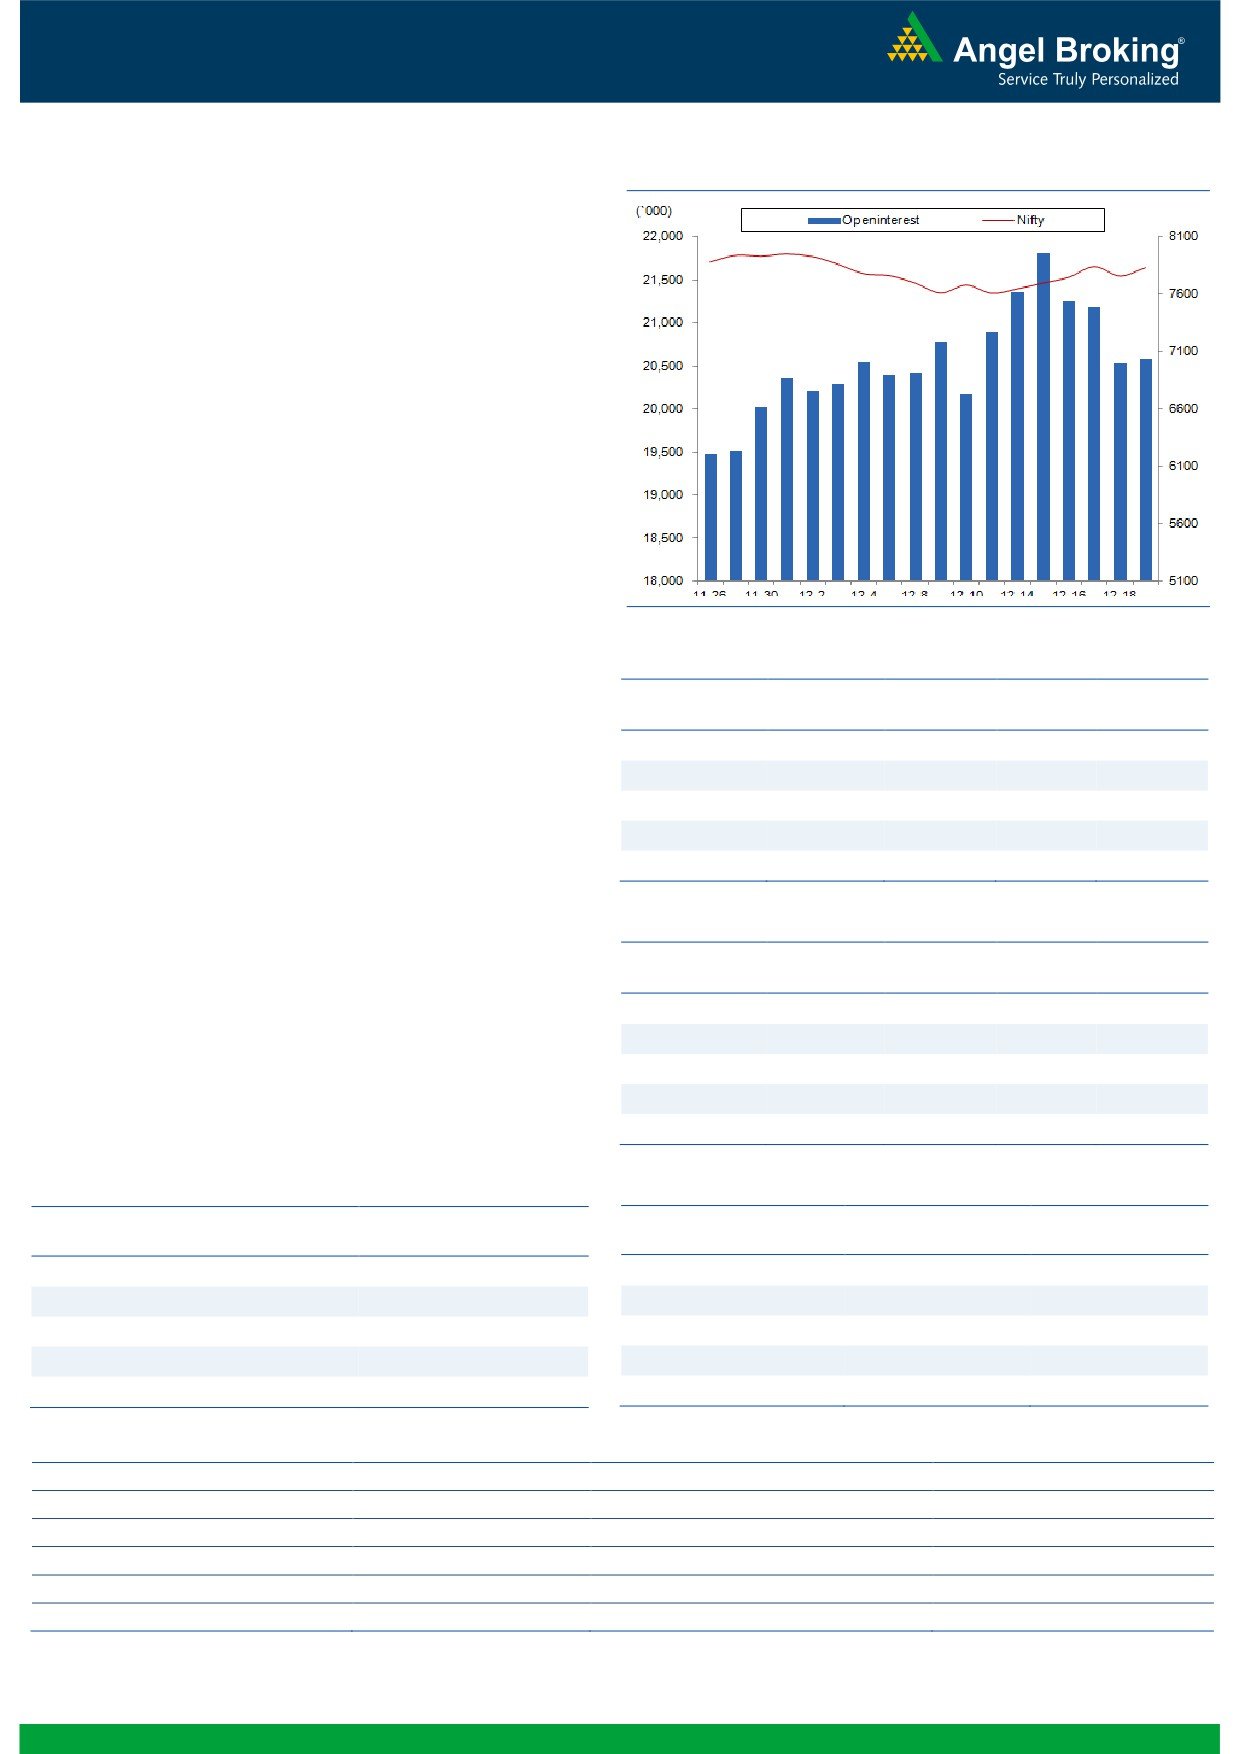
Exhibit 2: Bank Nifty Daily Chart
Bank Nifty Outlook - (16825)
Post flat opening, the Bank Nifty index moved up in first hour
of the day and crept higher till the end of session. The index
ended with a positive bias with gains of 1.39% over its
previous session's close. The lower time frame charts are
indicating that the index could continue its upmove further in
near term and hence it is advisable to trade with a positive
bias. The index could move higher upto its next resistance
zone of 17030-17080 (gap resistance zone). On the flipside,
on any corrections, the index is likely to find support near
16730 and 16565.
Key Levels
Support 1 - 16730
Resistance 1 - 17030
Support 2 - 16565
Resistance 2 - 17080
1
Technical & Derivatives Report
December 22, 2015
Comments
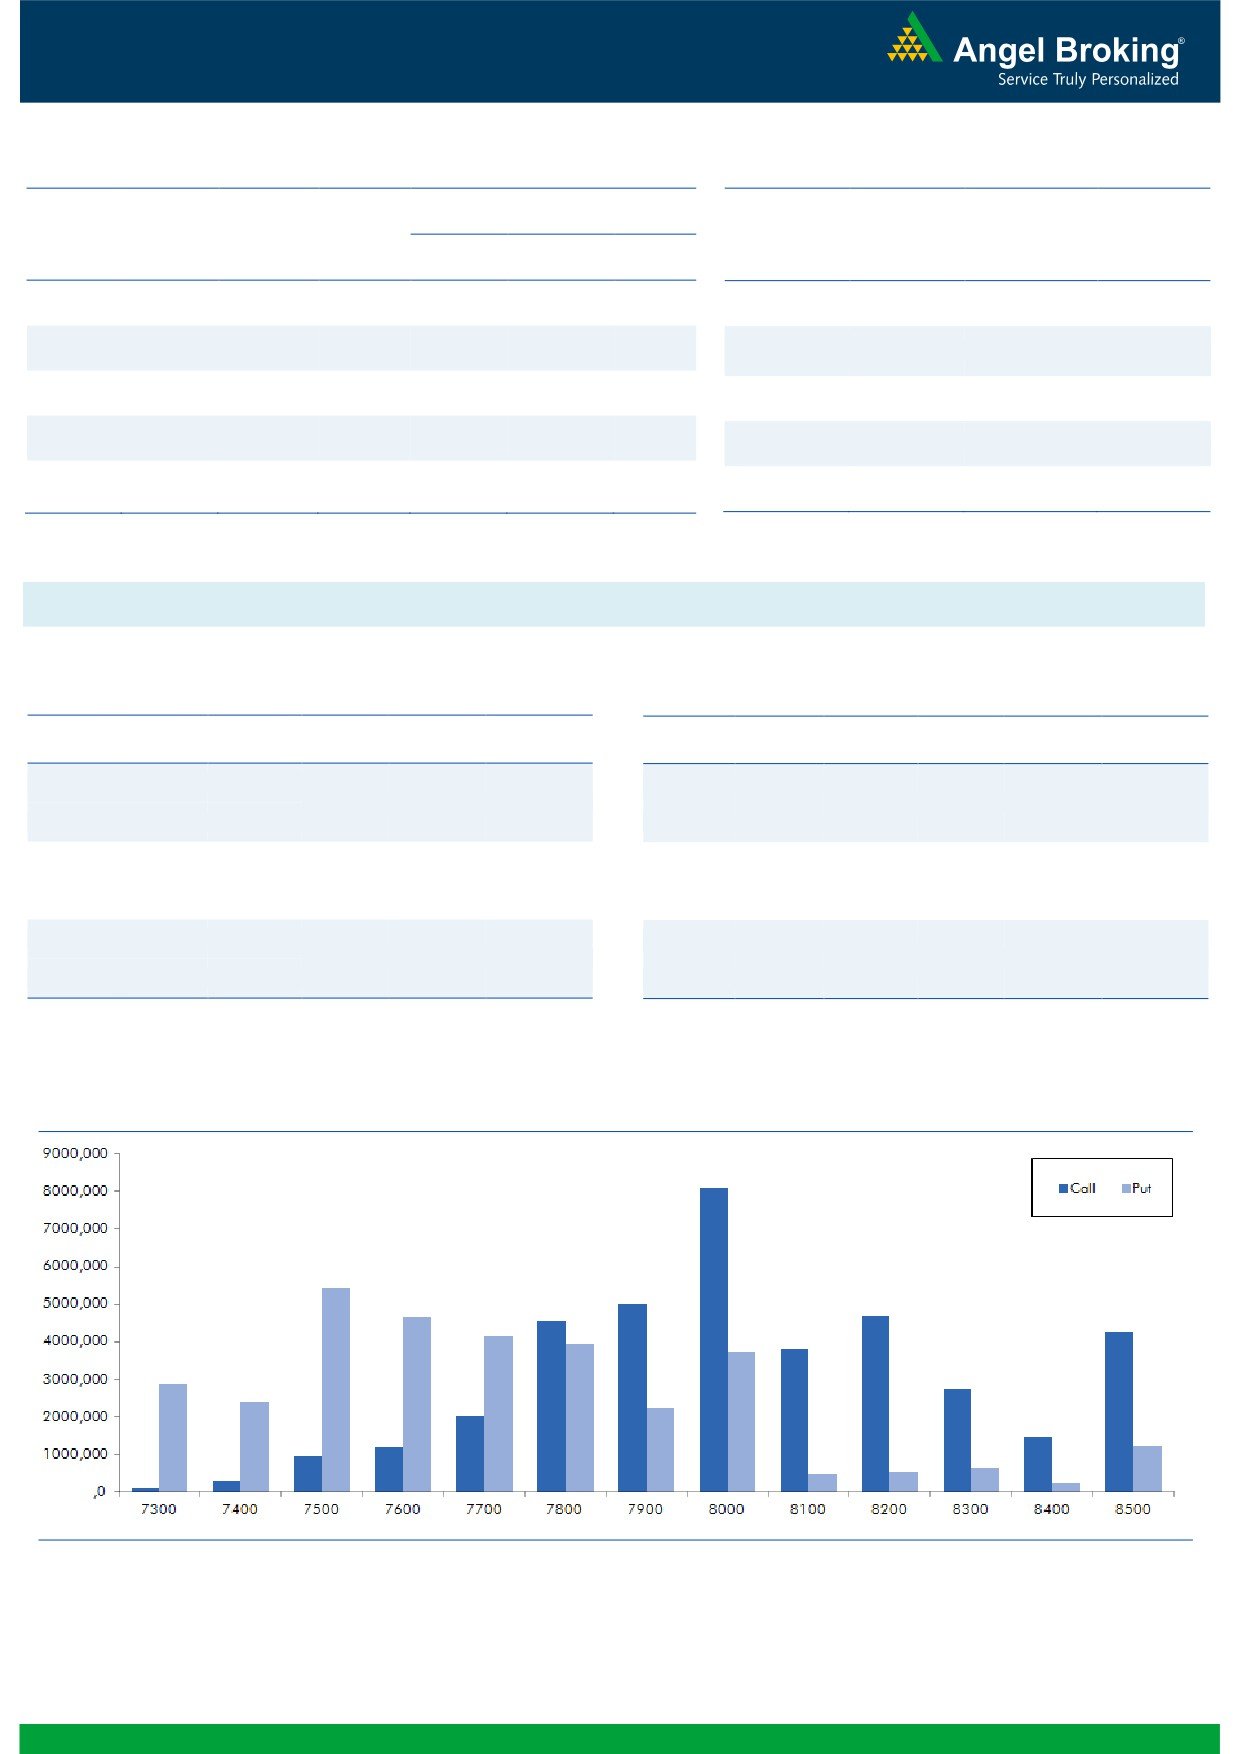
Nifty Vs OI
The Nifty futures open interest has increased by 0.25%
BankNifty futures open interest has decreased by 4.31%
as market closed at 7834.45 levels.
The Nifty December future closed at a premium of 7.00
points against a premium of 28.15 points. The January
series closed at a premium of 36.65 points.
The Implied Volatility of at the money options remained
unchanged at 12.57%.
The total OI of the market is Rs. 2,45,259/- cr. and the
stock futures OI is Rs. 67,480/- cr.
Few of the liquid counters where we have seen high cost
of carry are UNITECH, GMRINFRA, NCC, TV18BRDCST
and JINDALSTEL.
OI Gainers
Views
OI
PRICE
SCRIP
OI
PRICE
CHG. (%)
CHG. (%)
FIIs activity in equity segment was muted. While in Index
KSCL
3054000
53.26
353.30
-8.91
Futures, they were marginal buyers with decent fall in
MARICO
8574800
36.39
445.80
2.51
open interest, covering of shorts in last trading session.
TV18BRDCST
59585000
19.06
46.00
6.98
In Index Options front, FIIs bought of worth Rs. 735
NHPC
28971000
9.16
20.55
3.53
crores with good amount of rise in open interest. In call
HDIL
20778000
6.36
70.75
6.39
options we hardly saw any fresh OI buildup yesterday;
some profit booking was witness in 7800-8000 call
OI Losers
options. In put options, 7800 strike added decent build-
OI
PRICE
up with IV’s being unchanged. Maximum build-up in
SCRIP
OI
PRICE
CHG. (%)
CHG. (%)
current series in seen in 8000 call and 7500 put options.
IDBI
36632000
-6.55
91.25
2.70
Seeing the above data we believe one should avoid
SRTRANSFIN
3022800
-4.49
843.60
2.43
forming any shorts in Nifty at current levels, Nifty may
BEL
2182500
-4.23
1255.80
1.44
breach 8000-8050 levels.
HINDUNILVR
3641400
-4.20
854.60
-0.68
INDIACEM
31332000
-3.80
88.15
-1.01
Historical Volatility
Put-Call Ratio
SCRIP
HV
SCRIP
PCR-OI
PCR-VOL
KSCL
70.25
NIFTY
0.81
0.90
ADANIPOWER
69.37
BANKNIFTY
0.91
0.90
SUNPHARMA
40.97
SBIN
0.48
0.31
POWERGRID
27.21
RELIANCE
0.82
0.57
HDIL
57.79
LT
0.48
0.28
Strategy Date
Symbol
Strategy
Status
November 30, 2015
LT
Long Put
Profit Booked on Dec 11, 2015
December 07, 2015
BANKNIFTY
Raito Bear Put Spread
Active
December 14, 2015
HINDALCO
Long Call
Active
December 21, 2015
RELIANCE
Raito Bull Call Spread
Active
2
Technical & Derivatives Report
December 22, 2015
FII Statistics for 21-December 2015
Turnover on 21-December 2015
Open Interest
No. of
Turnover
Change
Detail
Buy
Sell
Net
Instrument
Value
Change
Contracts
( in Cr. )
(%)
Contracts
(in Cr.)
(%)
INDEX
INDEX
875.20
822.32
52.89
252625
14417.56
(1.52)
200846
11078.36
-21.47
FUTURES
FUTURES
INDEX
INDEX
13006.16
12270.99
735.16
1291957
75191.57
1.70
2341946
135379.37
-20.01
OPTIONS
OPTIONS
STOCK
2784.41
3178.78
(394.37)
1066591
52972.62
0.49
STOCK
FUTURES
395017
19685.09
-17.12
FUTURES
STOCK
STOCK
1581.64
1613.80
(32.17)
86067
4213.97
3.09
OPTIONS
224420
11346.56
-18.58
OPTIONS
TOTAL
18247.41
17885.89
361.52
2697240
146795.72
0.95
TOTAL
3162229
177489.38
-19.70
Nifty Spot = 7834.45
Lot Size = 25
Bull-Call Spreads
Bear-Put Spreads
Action
Strike
Price
Risk
Reward
BEP
Action
Strike
Price
Risk
Reward
BEP
Buy
7900
37.75
Buy
7800
45.95
24.25
75.75
7924.25
25.35
74.65
7774.65
Sell
8000
13.50
Sell
7700
20.60
Buy
7900
37.75
Buy
7800
45.95
32.25
167.75
7932.25
36.15
163.85
7763.85
Sell
8100
5.50
Sell
7600
9.80
Buy
8000
13.50
Buy
7700
20.60
8.00
92.00
8008.00
10.80
89.20
7689.20
Sell
8100
5.50
Sell
7600
9.80
Note: Above mentioned Bullish or Bearish Spreads in Nifty (Dec. Series) are given as an information and not as a recommendation.
Nifty Put-Call Analysis
3
Technical & Derivatives Report
December 22, 2015
Daily Pivot Levels for Nifty 50 Stocks
Scrips
S2
S1
PIVOT
R1
R2
ACC
1,337
1,345
1,351
1,359
1,365
ADANIPORTS
256
258
260
263
265
AMBUJACEM
196
199
200
203
205
ASIANPAINT
857
865
875
883
892
AXISBANK
428
435
439
446
450
BAJAJ-AUTO
2,456
2,473
2,490
2,507
2,524
BANKBARODA
156
158
159
161
162
BHARTIARTL
314
318
320
324
327
BHEL
165
166
167
168
170
BOSCHLTD
18,129
18,208
18,304
18,383
18,479
BPCL
882
890
900
908
918
CAIRN
126
130
132
137
139
CIPLA
636
640
645
649
654
COALINDIA
312
315
320
324
328
DRREDDY
2,934
2,972
3,001
3,038
3,067
GAIL
330
333
338
341
346
GRASIM
3,666
3,687
3,709
3,729
3,751
HCLTECH
837
846
852
861
867
HDFC
1,208
1,220
1,230
1,242
1,252
HDFCBANK
1,064
1,070
1,075
1,081
1,086
HEROMOTOCO
2,613
2,656
2,680
2,723
2,747
HINDALCO
80
80
81
82
83
HINDUNILVR
842
847
854
859
867
ICICIBANK
246
252
256
262
265
IDEA
131
135
137
140
142
INDUSINDBK
927
939
946
958
965
INFY
1,051
1,077
1,092
1,119
1,134
ITC
313
320
324
330
334
KOTAKBANK
695
701
704
710
713
LT
1,278
1,284
1,291
1,297
1,304
LUPIN
1,768
1,785
1,799
1,816
1,830
M&M
1,224
1,251
1,268
1,295
1,312
MARUTI
4,595
4,617
4,638
4,661
4,682
NTPC
134
135
136
138
139
ONGC
218
224
228
234
237
PNB
121
122
123
123
124
POWERGRID
134
137
138
141
143
RELIANCE
977
985
992
999
1,006
SBIN
225
228
229
232
234
VEDL
83
85
86
88
89
SUNPHARMA
722
738
747
764
773
TATAMOTORS
375
378
380
383
385
TATAPOWER
64
64
65
66
66
TATASTEEL
251
255
258
262
265
TCS
2,391
2,419
2,434
2,462
2,478
TECHM
510
516
520
526
530
ULTRACEMCO
2,765
2,785
2,803
2,823
2,842
WIPRO
544
550
555
561
565
YESBANK
711
715
721
725
730
ZEEL
410
413
416
420
422
4
Technical & Derivatives Report
December 22, 2015
Research Team Tel: 022 - 39357800
For Technical Queries
For Derivatives Queries
DISCLAIMER
Angel Broking Private Limited (hereinafter referred to as “Angel”) is a registered Member of National Stock Exchange of India Limited,
Bombay Stock Exchange Limited and MCX Stock Exchange Limited. It is also registered as a Depository Participant with CDSL and
Portfolio Manager with SEBI. It also has registration with AMFI as a Mutual Fund Distributor. Angel Broking Private Limited is a
registered entity with SEBI for Research Analyst in terms of SEBI (Research Analyst) Regulations, 2014 vide registration number
INH000000164. Angel or its associates has not been debarred/ suspended by SEBI or any other regulatory authority for accessing
/dealing in securities Market. Angel or its associates including its relatives/analyst do not hold any financial interest/beneficial
ownership of more than 1% in the company covered by Analyst. Angel or its associates/analyst has not received any compensation /
managed or co-managed public offering of securities of the company covered by Analyst during the past twelve months. Angel/analyst
has not served as an officer, director or employee of company covered by Analyst and has not been engaged in market making activity
of the company covered by Analyst.
This document is solely for the personal information of the recipient, and must not be singularly used as the basis of any investment
decision. Nothing in this document should be construed as investment or financial advice. Each recipient of this document should
make such investigations as they deem necessary to arrive at an independent evaluation of an investment in the securities of the
companies referred to in this document (including the merits and risks involved), and should consult their own advisors to determine
the merits and risks of such an investment.
Reports based on technical and derivative analysis center on studying charts of a stock's price movement, outstanding positions and
trading volume, as opposed to focusing on a company's fundamentals and, as such, may not match with a report on a company's
fundamentals.
The information in this document has been printed on the basis of publicly available information, internal data and other reliable
sources believed to be true, but we do not represent that it is accurate or complete and it should not be relied on as such, as this
document is for general guidance only. Angel Broking Pvt. Limited or any of its affiliates/ group companies shall not be in any way
responsible for any loss or damage that may arise to any person from any inadvertent error in the information contained in this report.
Angel Broking Pvt. Limited has not independently verified all the information contained within this document. Accordingly, we cannot
testify, nor make any representation or warranty, express or implied, to the accuracy, contents or data contained within this document.
While Angel Broking Pvt. Limited endeavors to update on a reasonable basis the information discussed in this material, there may be
regulatory, compliance, or other reasons that prevent us from doing so.
This document is being supplied to you solely for your information, and its contents, information or data may not be reproduced,
redistributed or passed on, directly or indirectly.
Neither Angel Broking Pvt. Limited, nor its directors, employees or affiliates shall be liable for any loss or damage that may arise from
or in connection with the use of this information.
Note: Please refer to the important ‘Stock Holding Disclosure' report on the Angel website (Research Section). Also, please refer to the
latest update on respective stocks for the disclosure status in respect of those stocks. Angel Broking Pvt. Limited and its affiliates may
have investment positions in the stocks recommended in this report.
5