Technical & Derivatives Report
December 21, 2016
Sensex (26308) / Nifty (8082)
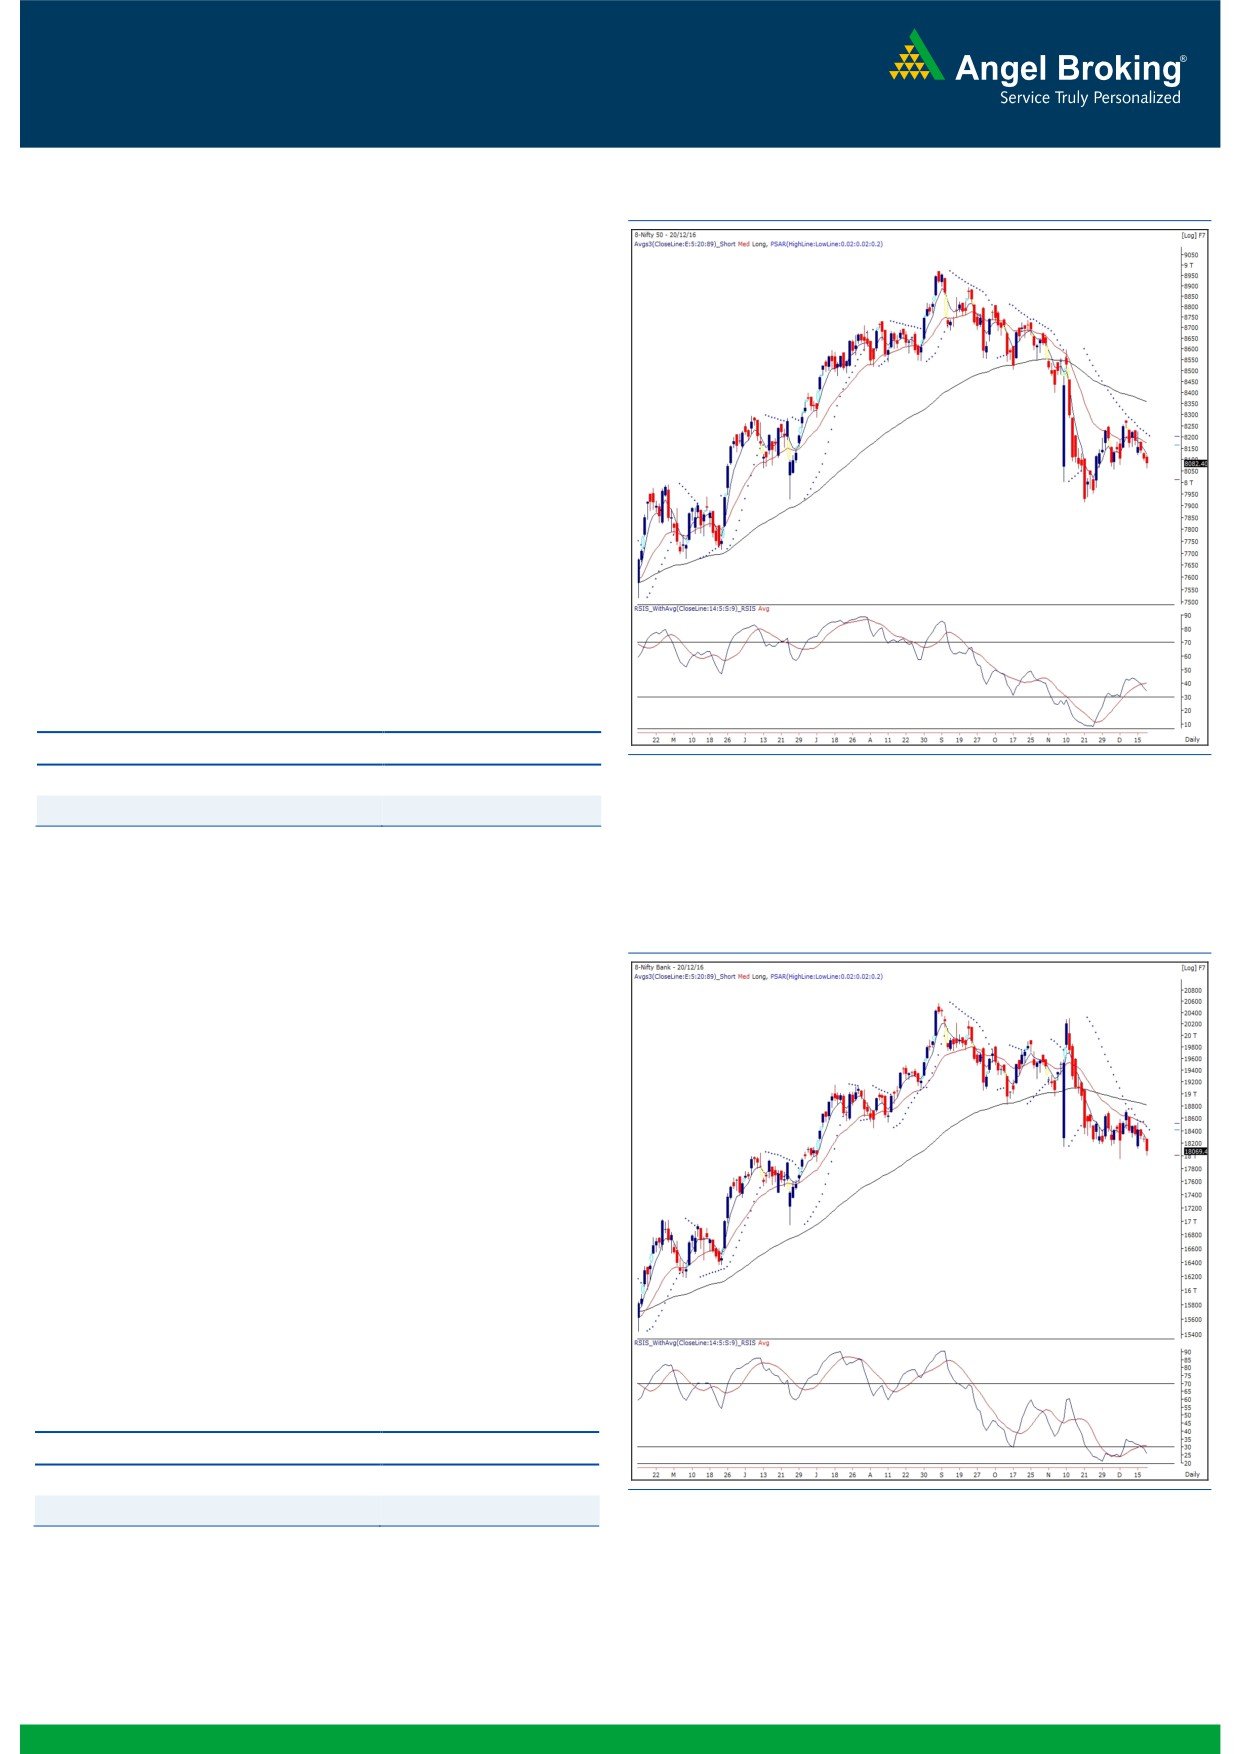
Exhibit 1: Nifty Daily Chart
It was yet another day of consolidation with a slightly negative
bias for our markets. The Nifty started on a flat note and then saw
some selling pressure at the midst of the day to sneak below the
8100 mark. However, a modest recovery during the penultimate
hour trimmed some of their losses.
The market has been experiencing decent selling pressure at
higher levels since last few days. Due to yesterday’s corrective
move the Nifty almost rested the recent swing low of 8056.85.
However, the hope is still alive for bulls as the Nifty managed to
gain some lost ground in the latter half. Since the important level
(8056.85) is still unbroken, we would maintain our optimistic
stance on the market and interpret this as a buying opportunity.
On the flipside, 8133 - 8179 would be seen as immediate
hurdles. Since, there is no major action seen in key indices,
traders are advised to continue with their stock centric approach.
Key Levels
Support 1 - 8056
Resistance 1 - 8133
Support 2 - 8000
Resistance 2 - 8179
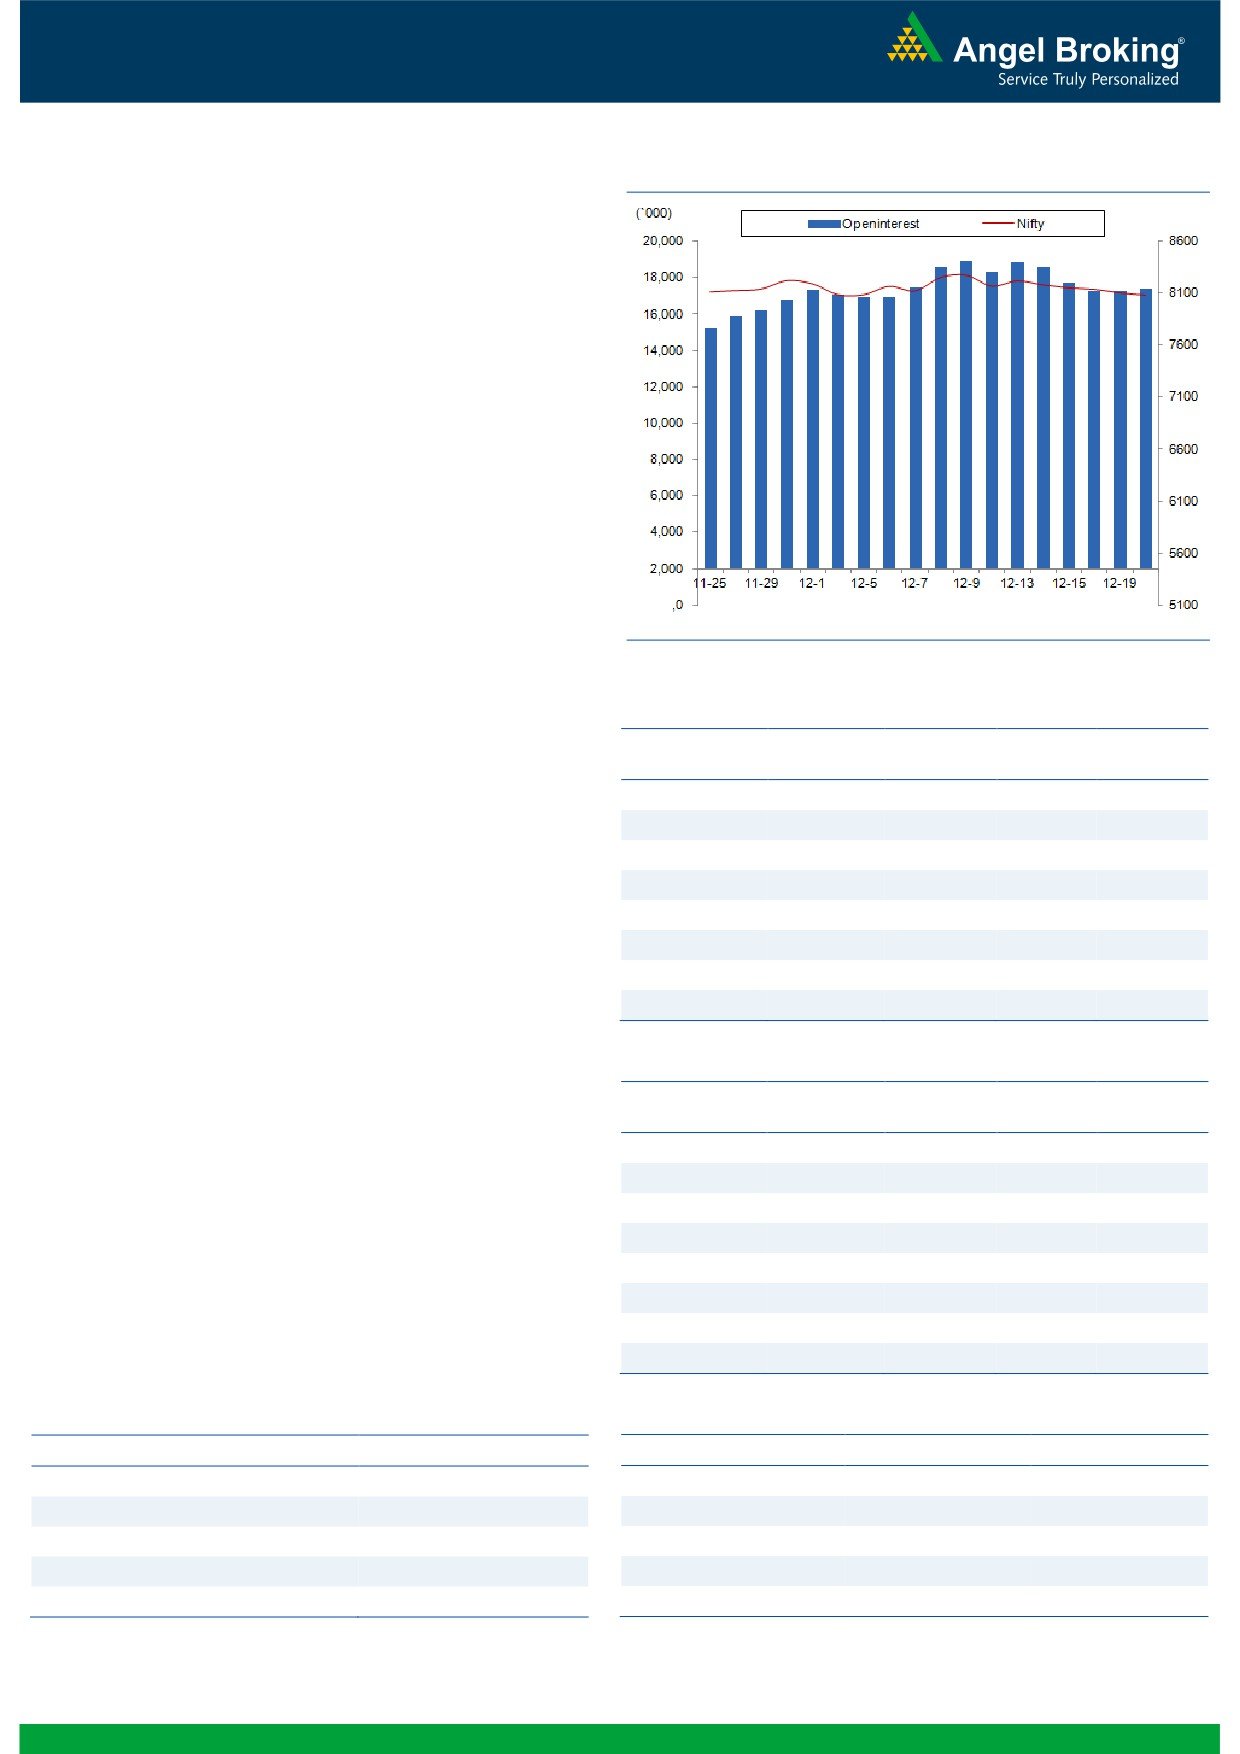
Nifty Bank Outlook - (18069)
Exhibit 2: Nifty Bank Daily Chart
Post opening on a flat note, the Nifty Bank index corrected
yesterday and ended the session with a loss of 1.03 percent.
Amongst the individual stocks, the PSU Bank corrected sharply as
the Nifty PSU Bank index corrected by 2.53 percent yesterday.
The Nifty Bank index has closed tad above its crucial support of
'200 SMA' on daily charts, which is considered as a long term
support. The index has not closed below the mentioned average
since 25th May, 2016. It would hence be prudent to watch the
move in next few days as only a closing below the average would
favor the bears in near term. Thus, we continue with our last few
day's of advice to stay light on the index and focus more on stock
specific moves. The intraday support for the Nifty Bank index is
placed in range of 18000-17951 whereas resistance is seen in
range of 18200-18251.
Key Levels
Support 1 - 18000
Resistance 1 - 18200
Support 2 - 17951
Resistance 2 - 18251
1
Technical & Derivatives Report
December 21, 2016
Comments
Nifty Vs OI
The Nifty futures open interest has increased by 0.85%
BankNifty futures open interest has increased by 14.30%
as market closed at 8082.40 levels.
The Nifty December future closed with a premium of
17.50 against the premium of 19.80 points in last
trading session. The January series closed at a premium
of 50.70 points.
The Implied Volatility of at the money options has
decreased from 12.48% to 10.67%. At the same time,
the PCR-OI of Nifty has decreased from 1.01 to 0.97
levels.
The total OI of the market is Rs. 2,66,158/- cr. and the
stock futures OI is Rs. 69,667/- cr.
Few of the liquid counters where we have seen high cost
of carry are GMRINFRA, ASHOKLEY, RECLTD,
SOUTHBANK and IDFC.
Views
OI Gainers
Yesterday, FIIs were net sellers in cash market segment to
OI
PRICE
SCRIP
OI
PRICE
the tune of Rs. 686 crores. While in index futures, they
CHG. (%)
CHG. (%)
were net buyers to worth Rs. 188 crores with marginal
BHARATFIN
12502000
15.77
582.70
-3.59
rise in open interest, suggesting formation of some long
AUROPHARMA
11092900
10.56
674.00
-3.71
positions in previous trading session.
BAJFINANCE
8553500
8.73
803.45
-2.54
www.angelbroking.com
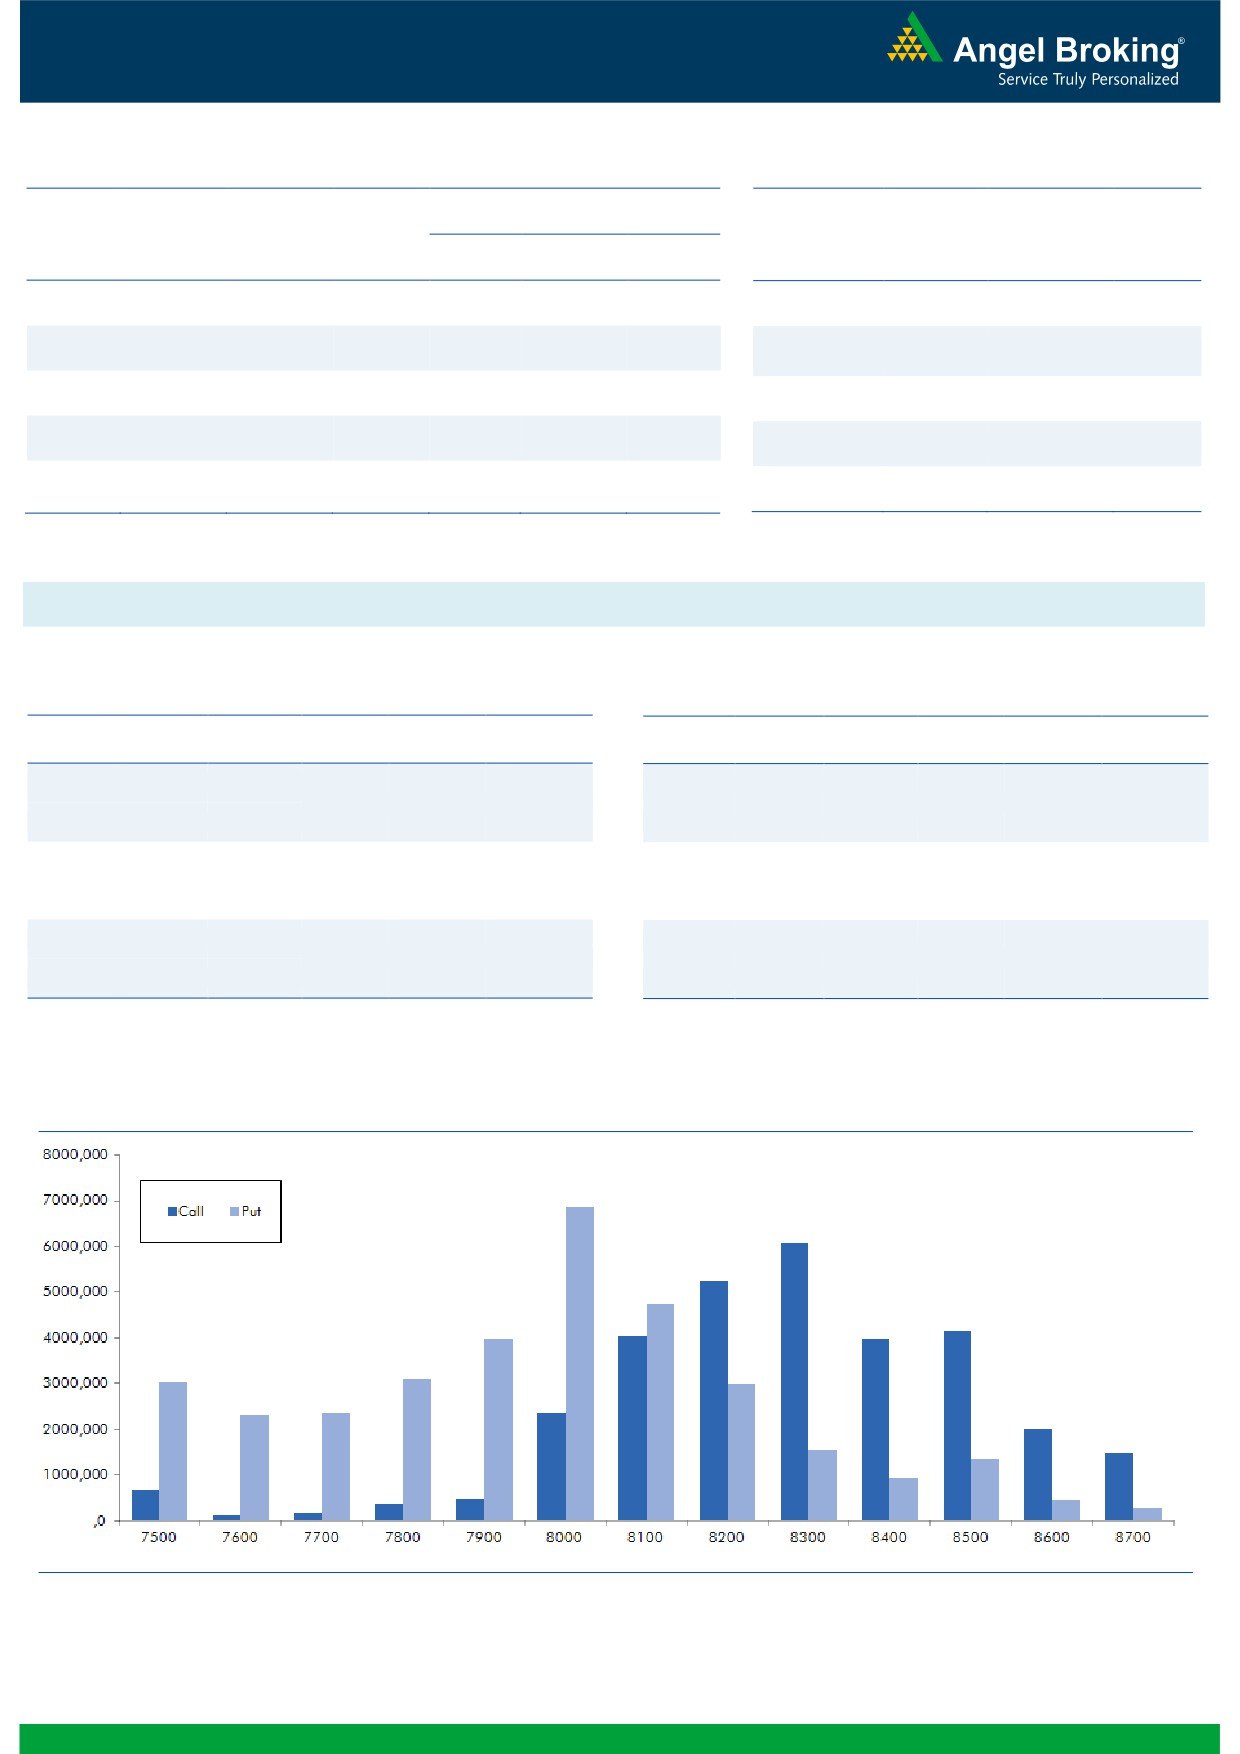
In Index options segment, FIIs bought of Rs. 276 crores
ALBK
16260000
8.11
63.00
-4.33
with marginal fall in open interest. In call options, 8100
M&MFIN
11395000
8.04
251.40
-3.42
and
8200 strikes added decent amount of fresh
IDEA
78604000
7.35
72.90
-4.08
positions; followed by unwinding in 8500 strike. While, in
CANBK
13668000
7.12
291.65
-2.25
put options, except 7900 strike, we hardly witnessed any
JUSTDIAL
4656800
6.55
352.75
-5.03
relevant build-up. However, reduction of positions was
seen in 8000 and 8200 strikes. Highest OI in current
OI Losers
series is placed at 8300 call and 8000 put option.
OI
PRICE
SCRIP
OI
PRICE
From last couple of sessions, we are witnessing some
CHG. (%)
CHG. (%)
long build in Index Futures from FIIs desk. However
SUNTV
7706000
-5.66
493.25
1.25
quantam is quite low. Also, the longs formed during
IGL
1636800
-5.46
898.40
-1.72
start of December series are still intact. But, the major
APOLLOTYRE
8646000
-5.07
195.15
-0.13
concern at current juncture is FII’s selling figure in Stock
KSCL
2649000
-4.85
398.95
-1.59
Future segment. Currently, Nifty is hovering around its
TATACHEM
4258500
-4.57
487.95
-0.16
strong support of 8050-8100 levels and thus we advise
PIDILITIND
1601000
-4.30
601.00
-0.25
traders to remain light on positions and focus more on
BEML
722700
-4.19
906.85
-1.16
stock specific moves.
ZEEL
9699300
-3.98
448.80
1.63
Historical Volatility
Put-Call Ratio
SCRIP
HV
SCRIP
PCR-OI
PCR-VOL
JUSTDIAL
43.05
NIFTY
0.97
0.78
ALBK
43.01
BANKNIFTY
0.81
0.83
GRANULES
46.64
SUNPHARMA
0.43
0.49
UBL
27.72
SBIN
0.55
0.48
AUROPHARMA
39.02
RELIANCE
1.02
0.75
2
Technical & Derivatives Report
December 21, 2016
FII Statistics for December 20, 2016
Turnover on December 20, 2016
Open Interest
No. of
Turnover
Change
Detail
Buy
Sell
Net
Instrument
Value
Change
Contracts
( in Cr. )
(%)
Contracts
(in Cr.)
(%)
INDEX
INDEX
1519.08
1331.12
187.96
173816
10956.94
1.00
204083
13422.95
74.89
FUTURES
FUTURES
INDEX
INDEX
34705.77
34981.37
(275.59)
1138343
70251.25
0.89
4203684
280475.98
73.59
OPTIONS
OPTIONS
STOCK
5732.04
6673.79
(941.75)
902650
53975.59
0.68
STOCK
FUTURES
463841
29639.28
30.80
FUTURES
STOCK
STOCK
3604.75
3678.31
(73.56)
90298
5696.14
3.17
OPTIONS
342717
23241.05
40.20
OPTIONS
TOTAL
45561.65
46664.60
(1102.94)
2305107
140879.92
0.90
TOTAL
5214325
346779.25
66.33
Nifty Spot = 8082.40
Lot Size = 75
Bull-Call Spreads
Bear-Put Spreads
Action
Strike
Price
Risk
Reward
BEP
Action
Strike
Price
Risk
Reward
BEP
Buy
8100
52.60
Buy
8100
55.85
34.80
65.20
8134.80
30.30
69.70
8069.70
Sell
8200
17.80
Sell
8000
25.55
Buy
8100
52.60
Buy
8100
55.85
46.55
153.45
8146.55
43.75
156.25
8056.25
Sell
8300
6.05
Sell
7900
12.10
Buy
8200
17.80
Buy
8000
25.55
11.75
88.25
8211.75
13.45
86.55
7986.55
Sell
8300
6.05
Sell
7900
12.10
Note: Above mentioned Bullish or Bearish Spreads in Nifty (December Series) are given as an information and not as a recommendation.
Nifty Put-Call Analysis
3
Technical & Derivatives Report
December 21, 2016
Daily Pivot Levels for Nifty Constituents
Scrips
S2
S1
PIVOT
R1
R2
ACC
1,262
1,278
1,289
1,305
1,316
ADANIPORTS
265
269
272
276
280
AMBUJACEM
199
202
204
207
209
ASIANPAINT
847
857
869
878
891
AUROPHARMA
654
663
679
688
704
AXISBANK
455
458
464
467
473
BAJAJ-AUTO
2,521
2,554
2,608
2,640
2,695
BANKBARODA
152
154
157
159
162
BHEL
120
120
121
122
123
BPCL
604
608
613
617
622
BHARTIARTL
295
299
303
307
310
INFRATEL
338
342
346
349
353
BOSCH
18,780
19,008
19,379
19,607
19,978
CIPLA
555
559
566
571
578
COALINDIA
287
289
291
292
294
DRREDDY
3,005
3,026
3,057
3,078
3,109
EICHERMOT
20,685
20,921
21,335
21,571
21,985
GAIL
420
425
429
434
437
GRASIM
814
821
827
835
841
HCLTECH
820
825
830
835
839
HDFCBANK
1,166
1,174
1,180
1,187
1,193
HDFC
1,212
1,224
1,240
1,252
1,268
HEROMOTOCO
3,002
3,031
3,073
3,102
3,144
HINDALCO
163
165
167
169
172
HINDUNILVR
790
796
804
810
819
ICICIBANK
246
249
253
255
259
IDEA
71
72
74
76
78
INDUSINDBK
1,054
1,063
1,076
1,085
1,098
INFY
993
1,003
1,011
1,020
1,029
ITC
226
228
229
231
233
KOTAKBANK
713
716
719
722
726
LT
1,337
1,346
1,354
1,363
1,371
LUPIN
1,419
1,434
1,461
1,476
1,503
M&M
1,162
1,170
1,178
1,186
1,194
MARUTI
5,034
5,071
5,109
5,146
5,185
NTPC
160
161
162
163
164
ONGC
196
198
200
202
204
POWERGRID
180
181
183
184
185
RELIANCE
1,050
1,054
1,057
1,062
1,065
SBIN
247
251
257
261
267
SUNPHARMA
613
621
629
637
645
TCS
2,266
2,303
2,324
2,361
2,382
TATAMTRDVR
296
297
298
300
301
TATAMOTORS
467
470
472
476
478
TATAPOWER
74
75
77
78
80
TATASTEEL
393
398
406
411
419
TECHM
470
473
477
480
484
ULTRACEMCO
3,074
3,110
3,140
3,176
3,205
WIPRO
458
462
466
470
474
YESBANK
1,118
1,133
1,158
1,173
1,198
ZEEL
436
442
446
452
456
4
Technical & Derivatives Report
December 21, 2016
Research Team Tel: 022 - 39357800
For Technical Queries
For Derivatives Queries
DISCLAIMER
Angel Broking Private Limited (hereinafter referred to as “Angel”) is a registered Member of National Stock Exchange of India Limited,
Bombay Stock Exchange Limited and Metropolitan Stock Exchange Limited. It is also registered as a Depository Participant with CDSL
and Portfolio Manager with SEBI. It also has registration with AMFI as a Mutual Fund Distributor. Angel Broking Private Limited is a
registered entity with SEBI for Research Analyst in terms of SEBI (Research Analyst) Regulations, 2014 vide registration number
INH000000164. Angel or its associates has not been debarred/ suspended by SEBI or any other regulatory authority for accessing
/dealing in securities Market. Angel or its associates/analyst has not received any compensation / managed or co-managed public
offering of securities of the company covered by Analyst during the past twelve months.
This document is solely for the personal information of the recipient, and must not be singularly used as the basis of any investment
decision. Nothing in this document should be construed as investment or financial advice. Each recipient of this document should
make such investigations as they deem necessary to arrive at an independent evaluation of an investment in the securities of the
companies referred to in this document (including the merits and risks involved), and should consult their own advisors to determine
the merits and risks of such an investment.
Reports based on technical and derivative analysis center on studying charts of a stock's price movement, outstanding positions and
trading volume, as opposed to focusing on a company's fundamentals and, as such, may not match with a report on a company's
fundamentals. Investors are advised to refer the Fundamental and Technical Research Reports available on our website to evaluate the
contrary view, if any.
The information in this document has been printed on the basis of publicly available information, internal data and other reliable
sources believed to be true, but we do not represent that it is accurate or complete and it should not be relied on as such, as this
document is for general guidance only. Angel Broking Pvt. Limited or any of its affiliates/ group companies shall not be in any way
responsible for any loss or damage that may arise to any person from any inadvertent error in the information contained in this report.
Angel Broking Pvt. Limited has not independently verified all the information contained within this document. Accordingly, we cannot
testify, nor make any representation or warranty, express or implied, to the accuracy, contents or data contained within this document.
While Angel Broking Pvt. Limited endeavors to update on a reasonable basis the information discussed in this material, there may be
regulatory, compliance, or other reasons that prevent us from doing so.
This document is being supplied to you solely for your information, and its contents, information or data may not be reproduced,
redistributed or passed on, directly or indirectly.
Neither Angel Broking Pvt. Limited, nor its directors, employees or affiliates shall be liable for any loss or damage that may arise from
or in connection with the use of this information.
5