Technical & Derivatives Report
July 21, 2016
Sensex (27916) / Nifty (8566)
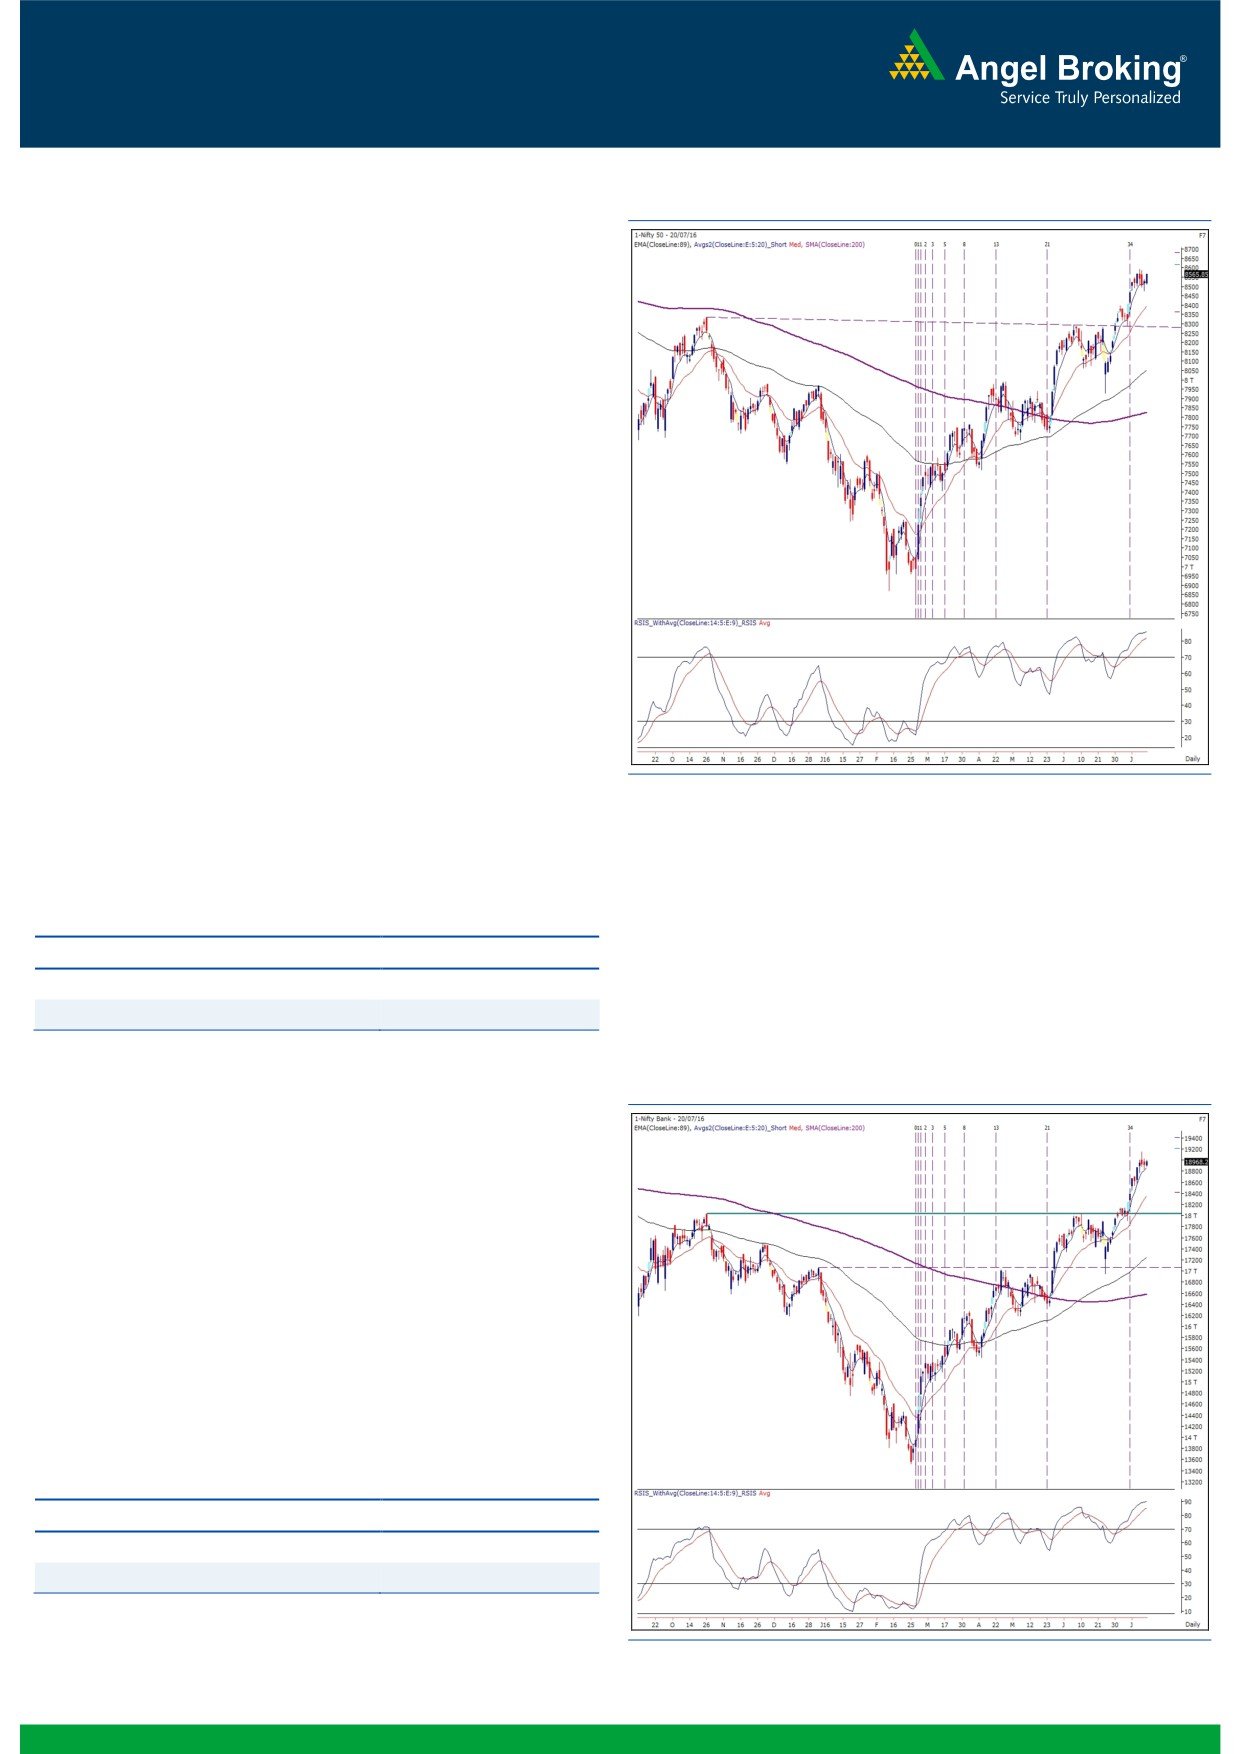
Exhibit 1: Nifty Daily Chart
Yesterday too our markets opened on a flat note owing to mixed
global cues. However, despite negative start from IT
conglomerates (on the back of weak set of 1QFY2017 numbers
from ‘Wipro’), our markets managed to gain momentum in the
upward direction and then traded with a strong positive bias to
end the session with nearly half a percent gains.
It was a reasonably good trading session for our markets,
especially we saw encouraging moves across the broader market.
As mentioned in the earlier report, the Nifty halted its upward
rally after entering the intraday resistance zone of 8550 - 8580.
Going forward, purely with an intraday perspective, 8580 would
be the important level to watch out for. We may see an extension
of yesterday’s move only if Nifty manages to sustain above 8580.
In this scenario, the Nifty may move higher to test 8630 - 8655
levels. On the flipside, a failure to do so may result into loss of
momentum. On the downside, intraday support levels are seen at
8540 - 8512 levels. We reiterate that the index has slipped into a
consolidation mode after giving a stupendous rally in the recent
weeks and thus, it would be very difficult for traders to find clear
trade in the index. It’s advisable to use dips to initiate directional
long positions and meanwhile, trade with a stock centric
approach.
Key Levels
Support 1 - 8540
Resistance 1 - 8630
Support 2 - 8512
Resistance 2 - 8655
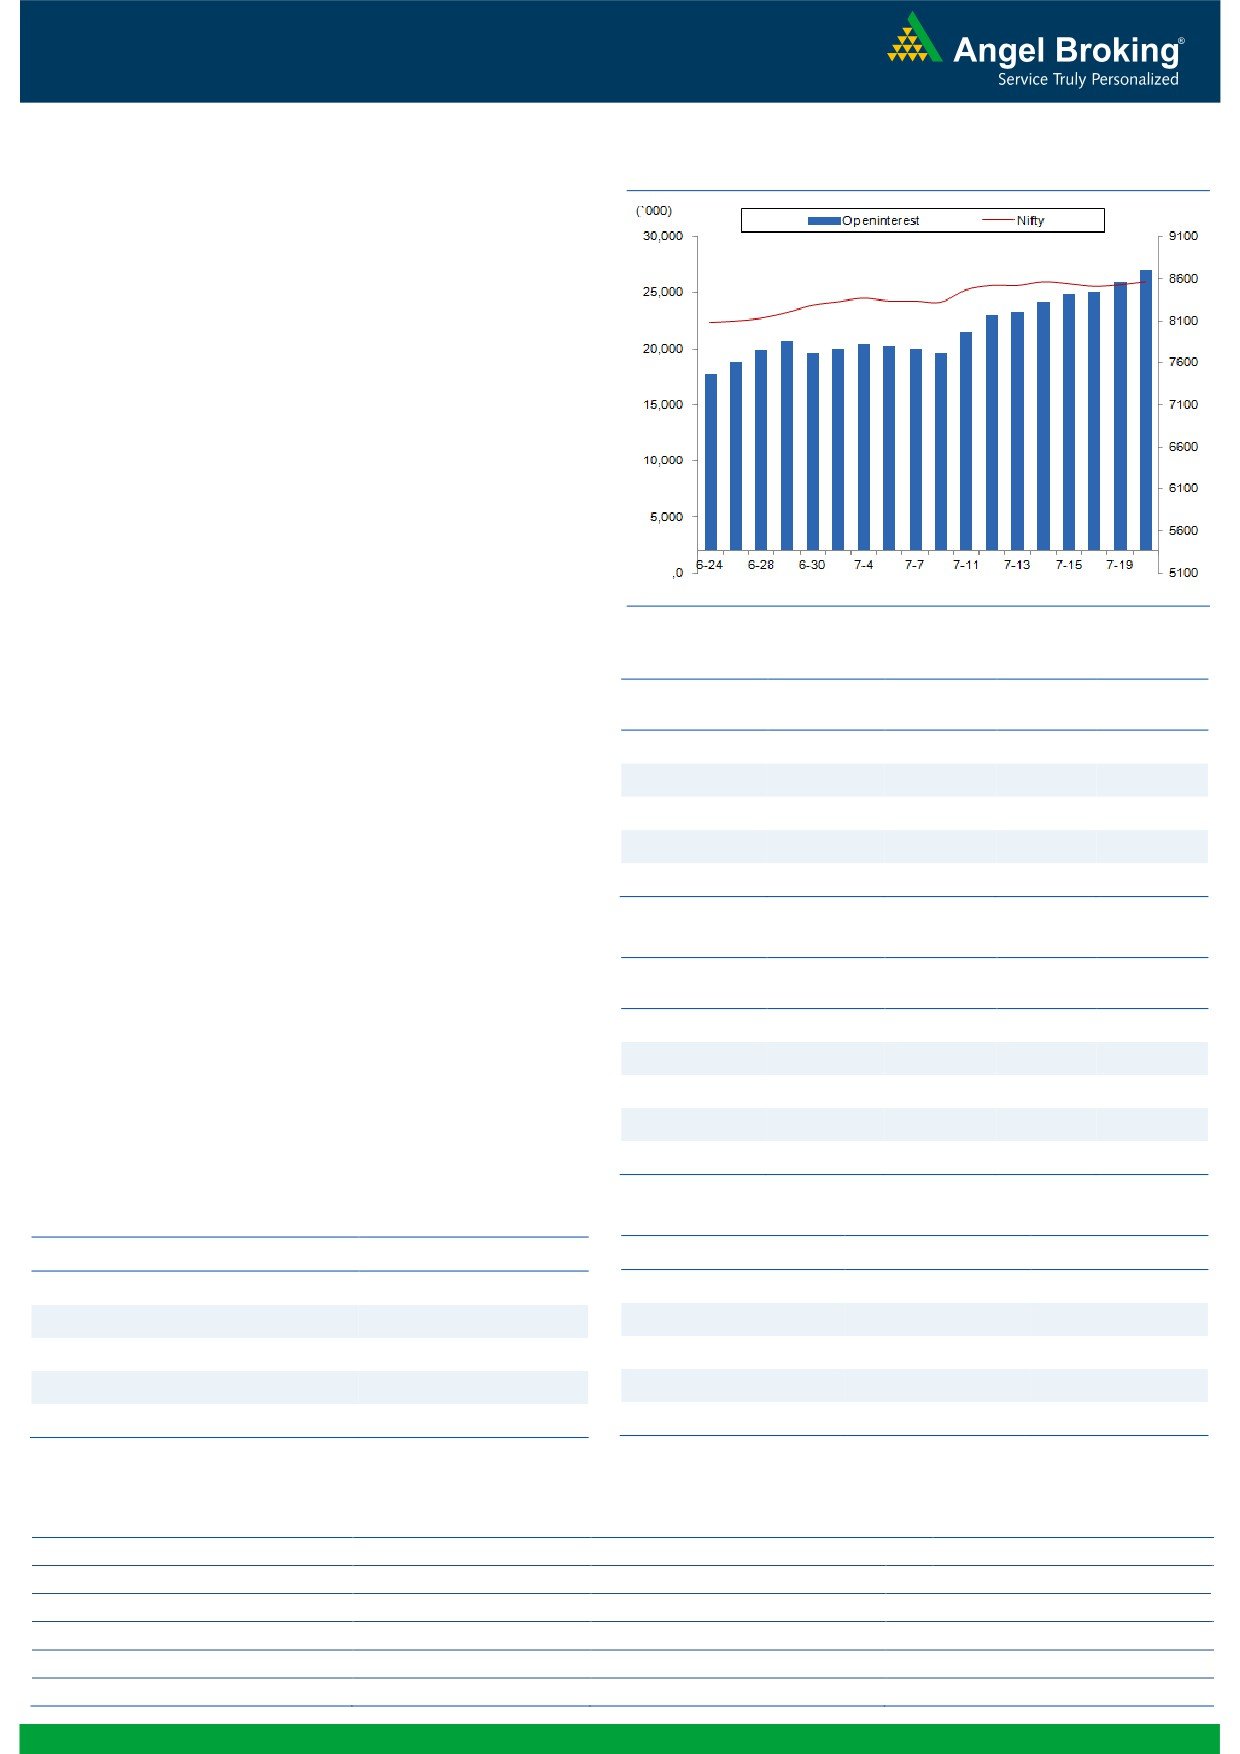
Nifty Bank Outlook - (18968)
Exhibit 2: Nifty Bank Daily Chart
The Nifty Bank index continued its range bound movement and
ended yesterday's session with minor gains of 0.33 percent over
its previous session's close.
During the consolidation move in last four trading sessions, the
index has not given any reversal signs and thus the broader trend
continues to remain up. Traders should hence continue to trade
with positive bias and not create any contra trade in anticipation
of reversal. In fact, intraday corrections in recent past have
proved to be buying opportunities. The intraday support for the
index is placed around 18825 and 18772 whereas resistances
are seen around 19150 and 19229.
Key Levels
Support 1 - 18825
Resistance 1 - 19150
Support 2 - 18772
Resistance 2 - 19229
1
Technical & Derivatives Report
July 21, 2016
Comments
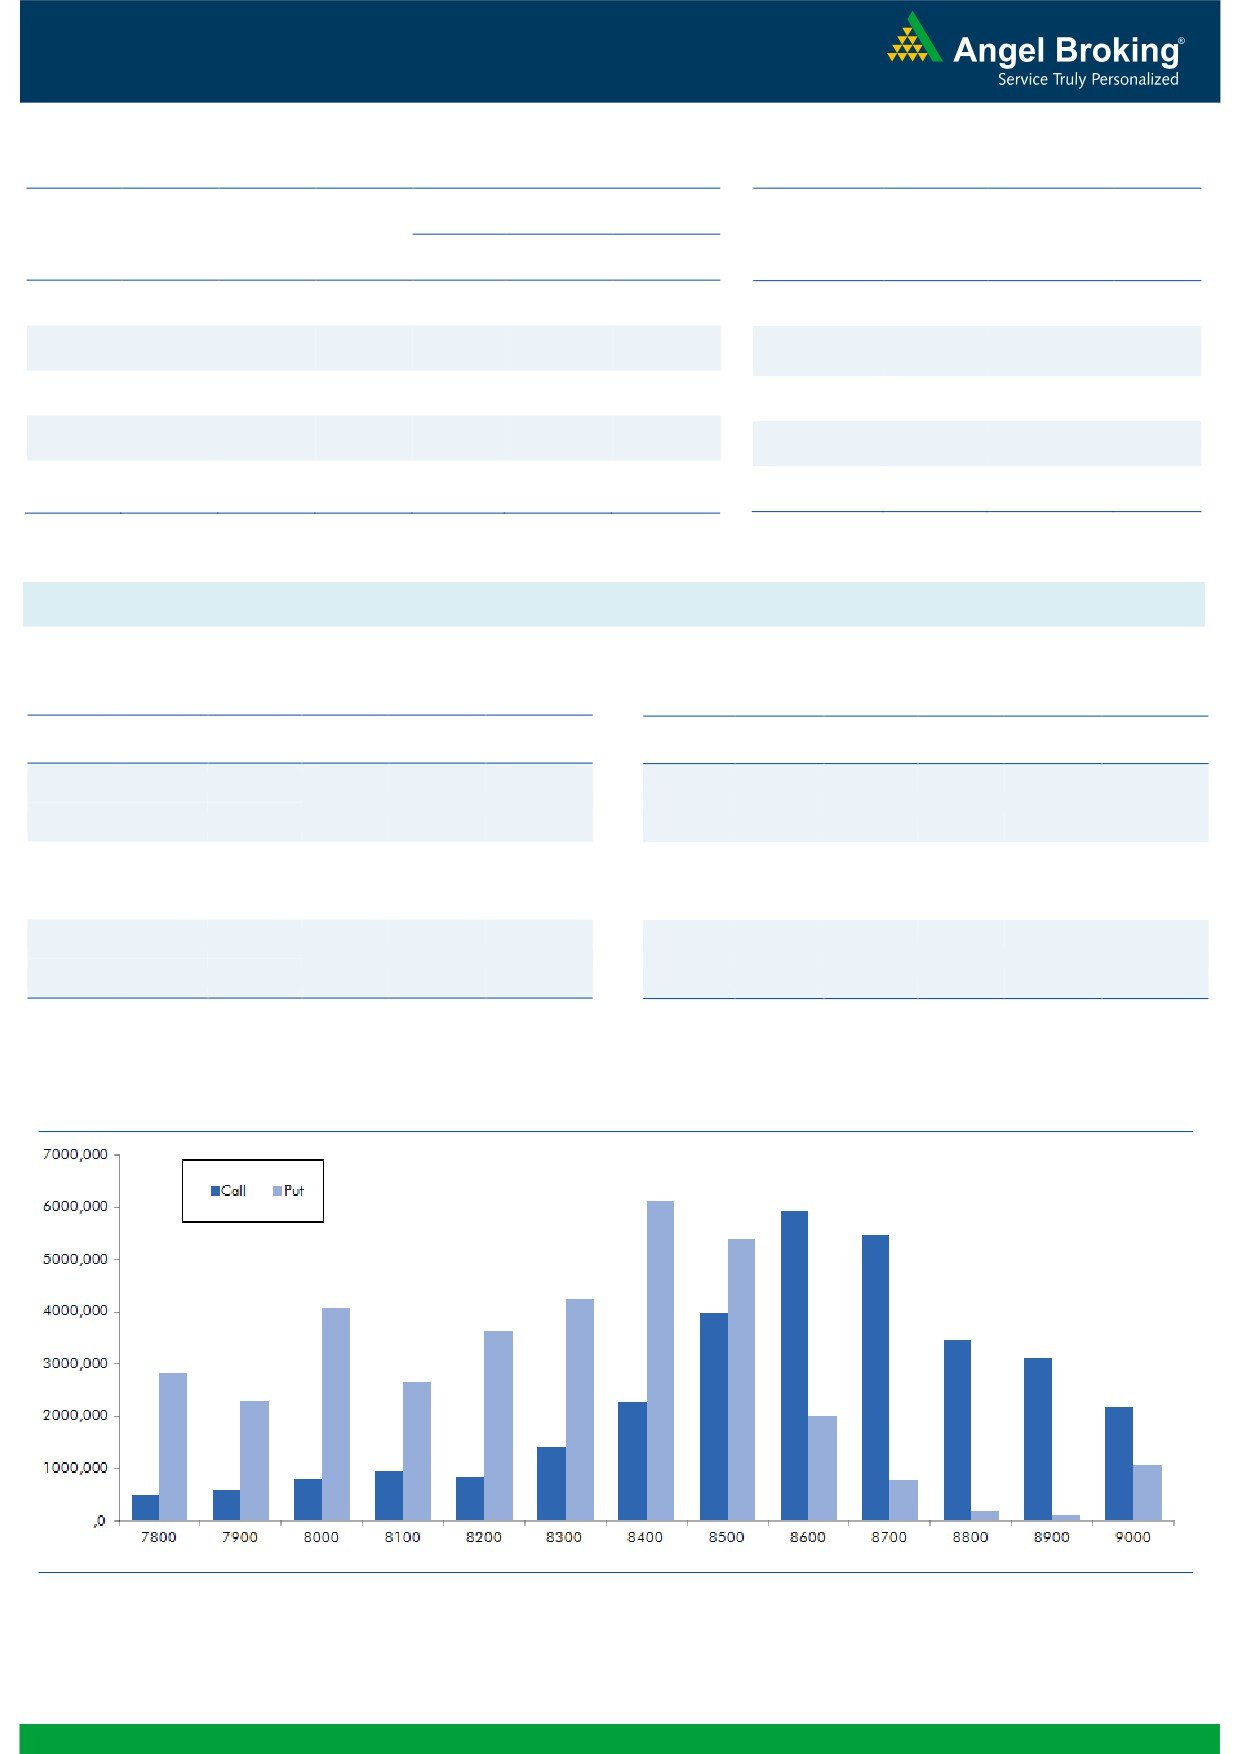
Nifty Vs OI
The Nifty futures open interest has increased by 3.80%
BankNifty futures open interest has increased by 0.81%
as market closed at 8565.85 levels.
The Nifty July future closed with a premium of 18.30
points against a premium of 11.90 points in previous
session. The August series closed at a premium of 55.70
points.
The Implied Volatility of at the money options has
increased from 12.30% to 13.80%.
The total OI of the market is Rs. 2,80,362/- cr. and the
stock futures OI is Rs. 73,347/- cr.
Few of the liquid counters where we have seen high cost
of carry are JPASSOCIAT, GMRINFRA, TATAPOWER,
UNITECH and NHPC.
Views
OI Gainers
OI
PRICE
Yesterday, FIIs were net buyer in both cash market and
SCRIP
OI
PRICE
CHG. (%)
CHG. (%)
Index Futures segment. They bought equities to the tune
GLENMARK
2525600
15.05
856.55
2.65
of Rs. 215 crores. While, they were marginal buyer in
SIEMENS
1243000
12.74
1349.90
3.18
Index Futures with rise in open interest, indicating blend
HAVELLS
5444000
12.48
367.80
2.08
of both long and short build-up in last trading session.
In Index Options segment, FIIs were net seller worth
WOCKPHARMA
3214200
11.91
1041.60
12.77
Rs. 199 crores with rise in open interest. In call options,
SUNTV
10156000
10.68
402.35
4.74
marginal OI addition was seen in 8700 strike; followed
by decent unwinding in 8500 strike. On the other hand,
OI Losers
in put options, good amount of build-up was seen in
OI
PRICE
SCRIP
OI
PRICE
8500, 8600 and 8550 strikes. Highest OI in current
CHG. (%)
CHG. (%)
series is placed at 8600 call and 8400 put options.
PNB
55769000
-8.45
129.70
-1.07
After the continuous buying in index futures, we saw a
IOC
10161000
-7.24
513.20
3.60
pause in buying momentum by FIIs in yesterday’s
ORIENTBANK
16428000
-6.20
115.95
-0.13
session. Though, our positional view remains positive on
PETRONET
4029000
-4.68
292.75
2.25
market; we may see a sideways movement in upcoming
NIITTECH
928000
-3.83
461.25
-0.59
sessions.
Historical Volatility
Put-Call Ratio
SCRIP
HV
SCRIP
PCR-OI
PCR-VOL
WOCKPHARMA
62.46
NIFTY
1.09
1.07
AUROPHARMA
37.56
BANKNIFTY
1.17
0.96
STAR
34.61
INFY
0.48
0.46
SIEMENS
25.22
RELIANCE
0.48
0.52
CADILAHC
38.15
SBIN
0.82
0.83
Strategy Date
Symbol
Strategy
Status
04-07-2016
RCOM
Ratio Bull Call Spread
Active
11-07-2016
BANKNIFTY
Bull Call Spread
Didn’t trigger
18-07-2016
TCS
Long Put
Active
2
Technical & Derivatives Report
July 21, 2016
FII Statistics for 20-July 2016
Turnover on 20-July 2016
Open Interest
No. of
Turnover
Change
Detail
Buy
Sell
Net
Instrument
Value
Contracts
( in Cr. )
(%)
Contracts
Change (%)
(in Cr.)
INDEX
INDEX
1301.38
1254.99
46.39
330448
21718.33
1.90
156755
10677.96
-35.29
FUTURES
FUTURES
INDEX
INDEX
22192.05
22390.71
(198.66)
1043231
67760.93
1.93
2928510
202451.92
-19.09
OPTIONS
OPTIONS
STOCK
4764.75
5639.28
(874.53)
855795
54903.91
1.12
STOCK
FUTURES
522317
34147.60
-3.95
FUTURES
STOCK
STOCK
3956.86
3956.86
(0.00)
108712
7090.80
1.49
OPTIONS
373399
24232.06
-8.81
OPTIONS
TOTAL
32215.04
33241.84
(1026.80)
2338186
151473.96
1.61
TOTAL
3980981
271509.53
-17.44
Nifty Spot = 8565.85
Lot Size = 75
Bull-Call Spreads
Bear-Put Spreads
Action
Strike
Price
Risk
Reward
BEP
Action
Strike
Price
Risk
Reward
BEP
Buy
8600
60.60
Buy
8600
76.35
36.40
63.60
8636.40
36.85
63.15
8563.15
Sell
8700
24.20
Sell
8500
39.50
Buy
8600
60.60
Buy
8600
76.35
53.05
146.95
8653.05
57.20
142.80
8542.80
Sell
8800
7.55
Sell
8400
19.15
Buy
8700
24.20
Buy
8500
39.50
16.65
83.35
8716.65
20.35
79.65
8479.65
Sell
8800
7.55
Sell
8400
19.15
Note: Above mentioned Bullish or Bearish Spreads in Nifty (July Series) are given as an information and not as a recommendation.
Nifty Put-Call Analysis
3
Technical & Derivatives Report
July 21, 2016
Daily Pivot Levels for Nifty Constituents
Scrips
S2
S1
PIVOT
R1
R2
ACC
1,594
1,613
1,626
1,645
1,659
ADANIPORTS
217
219
221
223
225
AMBUJACEM
255
259
263
266
270
ASIANPAINT
1,012
1,020
1,028
1,037
1,045
AUROPHARMA
760
780
790
810
821
AXISBANK
549
553
561
565
573
BAJAJ-AUTO
2,726
2,753
2,773
2,799
2,820
BANKBARODA
156
157
158
159
160
BHEL
138
141
143
146
148
BPCL
563
569
576
582
589
BHARTIARTL
359
361
364
367
370
INFRATEL
348
352
356
360
364
BOSCH
24,041
24,470
24,730
25,159
25,419
CIPLA
500
509
514
523
528
COALINDIA
316
323
326
333
337
DRREDDY
3,552
3,614
3,652
3,714
3,752
EICHERMOT
19,564
19,707
19,798
19,941
20,032
GAIL
384
390
393
399
402
GRASIM
4,737
4,789
4,826
4,878
4,914
HCLTECH
711
721
726
736
742
HDFCBANK
1,214
1,223
1,231
1,240
1,248
HDFC
1,315
1,325
1,335
1,345
1,356
HEROMOTOCO
3,217
3,246
3,265
3,294
3,313
HINDALCO
132
134
137
139
142
HINDUNILVR
892
899
905
912
918
ICICIBANK
264
266
267
269
270
IDEA
104
104
106
107
108
INDUSINDBK
1,093
1,106
1,114
1,127
1,135
INFY
1,061
1,072
1,081
1,092
1,101
ITC
246
248
250
252
254
KOTAKBANK
775
778
781
785
788
LT
1,557
1,563
1,575
1,581
1,592
LUPIN
1,682
1,702
1,713
1,732
1,743
M&M
1,450
1,456
1,464
1,469
1,477
MARUTI
4,418
4,442
4,476
4,500
4,534
NTPC
154
156
157
158
159
ONGC
218
221
223
226
227
POWERGRID
165
167
168
170
171
RELIANCE
1,011
1,017
1,023
1,029
1,034
SBIN
227
229
231
233
235
SUNPHARMA
776
786
792
803
809
TCS
2,428
2,461
2,482
2,516
2,536
TATAMTRDVR
317
318
321
322
324
TATAMOTORS
486
490
496
500
506
TATAPOWER
70
71
72
74
75
TATASTEEL
363
366
369
372
376
TECHM
501
503
506
509
512
ULTRACEMCO
3,484
3,522
3,546
3,584
3,608
WIPRO
510
524
533
548
556
YESBANK
1,138
1,149
1,159
1,169
1,179
ZEEL
453
458
464
469
475
4
Technical & Derivatives Report
July 21, 2016
Research Team Tel: 022 - 39357800
For Technical Queries
For Derivatives Queries
DISCLAIMER
Angel Broking Private Limited (hereinafter referred to as “Angel”) is a registered Member of National Stock Exchange of India Limited,
Bombay Stock Exchange Limited and Metropolitan Stock Exchange Limited. It is also registered as a Depository Participant with CDSL
and Portfolio Manager with SEBI. It also has registration with AMFI as a Mutual Fund Distributor. Angel Broking Private Limited is a
registered entity with SEBI for Research Analyst in terms of SEBI (Research Analyst) Regulations, 2014 vide registration number
INH000000164. Angel or its associates has not been debarred/ suspended by SEBI or any other regulatory authority for accessing
/dealing in securities Market. Angel or its associates/analyst has not received any compensation / managed or co-managed public
offering of securities of the company covered by Analyst during the past twelve months.
This document is solely for the personal information of the recipient, and must not be singularly used as the basis of any investment
decision. Nothing in this document should be construed as investment or financial advice. Each recipient of this document should
make such investigations as they deem necessary to arrive at an independent evaluation of an investment in the securities of the
companies referred to in this document (including the merits and risks involved), and should consult their own advisors to determine
the merits and risks of such an investment.
Reports based on technical and derivative analysis center on studying charts of a stock's price movement, outstanding positions and
trading volume, as opposed to focusing on a company's fundamentals and, as such, may not match with a report on a company's
fundamentals. Investors are advised to refer the Fundamental and Technical Research Reports available on our website to evaluate the
contrary view, if any.
The information in this document has been printed on the basis of publicly available information, internal data and other reliable
sources believed to be true, but we do not represent that it is accurate or complete and it should not be relied on as such, as this
document is for general guidance only. Angel Broking Pvt. Limited or any of its affiliates/ group companies shall not be in any way
responsible for any loss or damage that may arise to any person from any inadvertent error in the information contained in this report.
Angel Broking Pvt. Limited has not independently verified all the information contained within this document. Accordingly, we cannot
testify, nor make any representation or warranty, express or implied, to the accuracy, contents or data contained within this document.
While Angel Broking Pvt. Limited endeavors to update on a reasonable basis the information discussed in this material, there may be
regulatory, compliance, or other reasons that prevent us from doing so.
This document is being supplied to you solely for your information, and its contents, information or data may not be reproduced,
redistributed or passed on, directly or indirectly.
Neither Angel Broking Pvt. Limited, nor its directors, employees or affiliates shall be liable for any loss or damage that may arise from
or in connection with the use of this information.
5