Technical & Derivatives Report
June 21, 2016
Sensex (26867) / Nifty (8239)
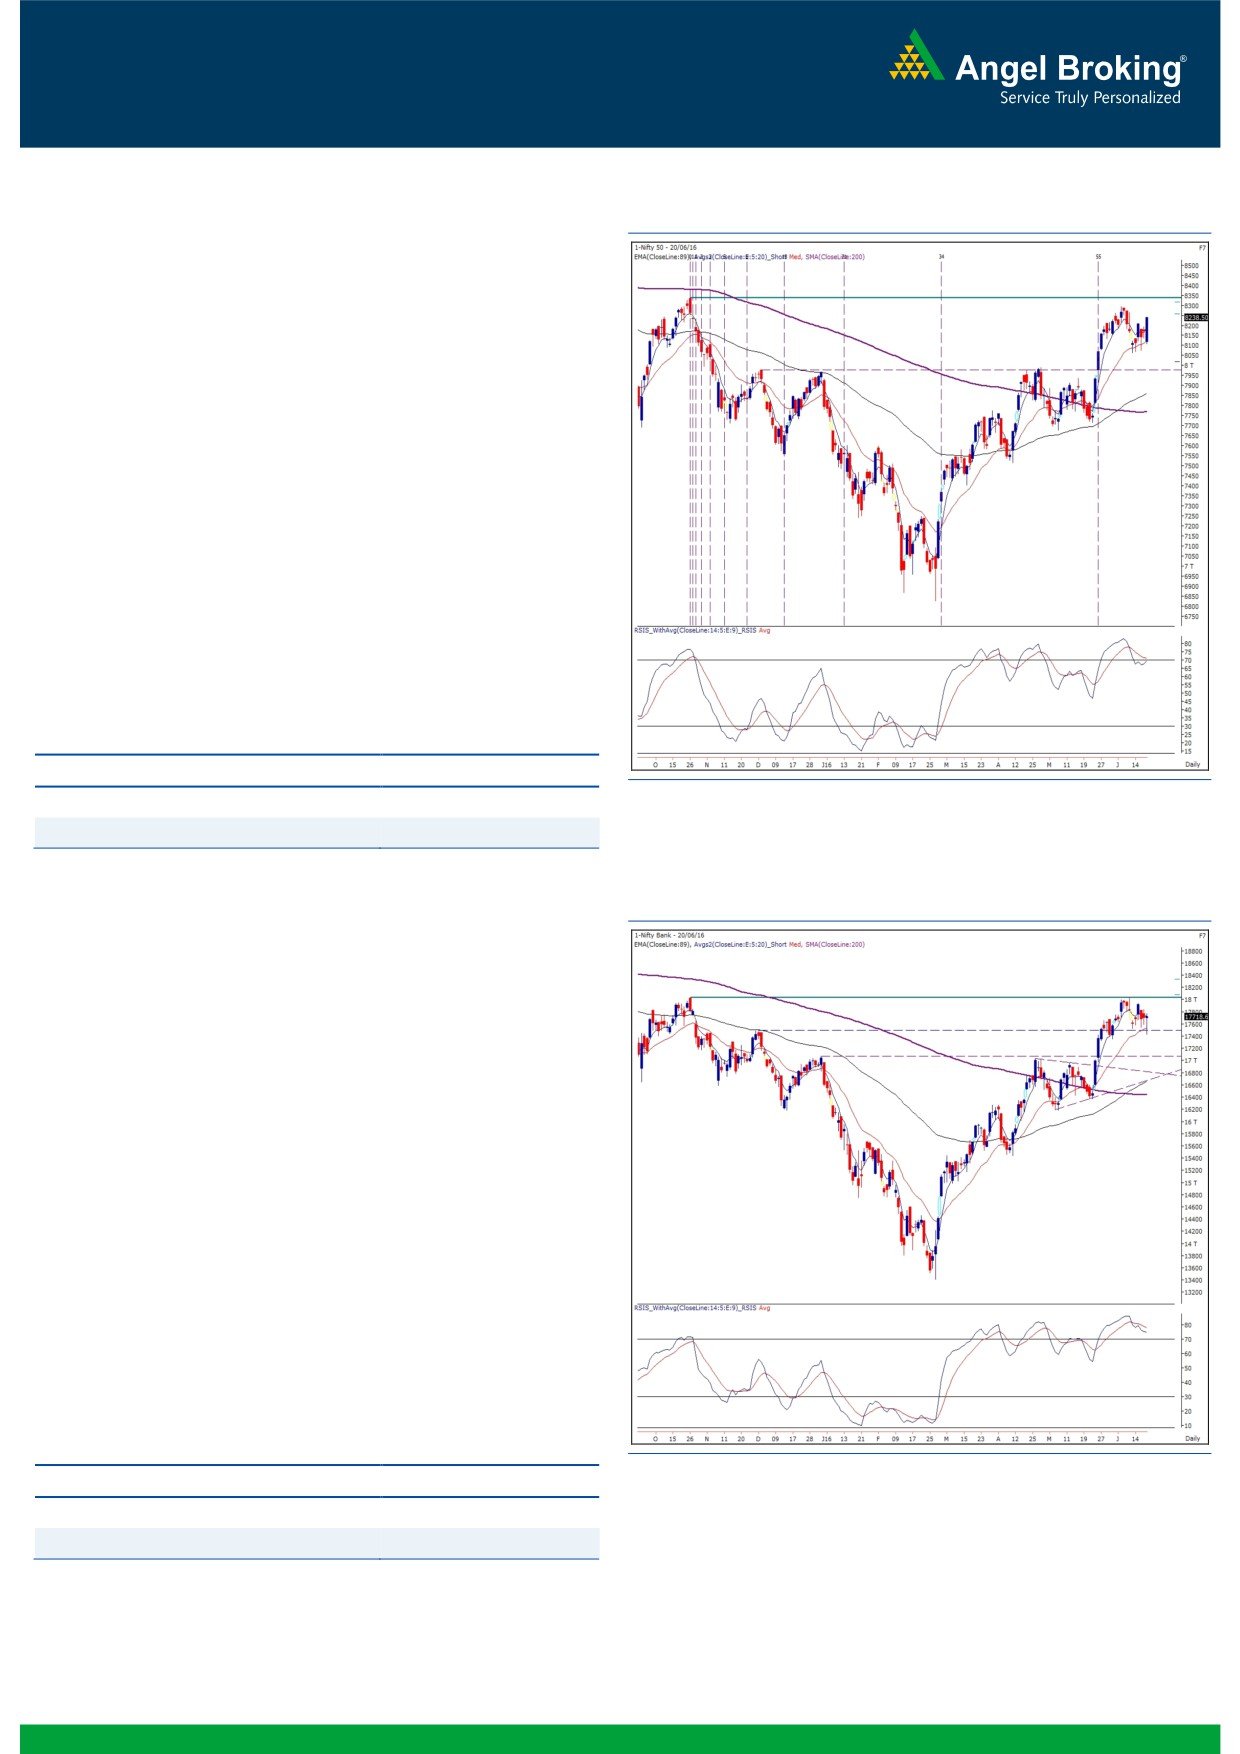
Exhibit 1: Nifty Daily Chart
The opening session of the week started on a pessimistic note
after the announcement of RBI Governor Raghuram Rajan's exit at
the end of his term. However, this was just a temporary reaction
to the announcement as the index shrugged off this negative
development and immediately joined its global peers. As a result,
we witnessed a smart recovery followed by a strong buying to end
the session to close convincingly above the 8200 mark.
Yesterday's vertical rally from early morning lows was a perfect
example of a famous quote 'Trend is your friend'. Our strategy of
using dips as a buying opportunity has been working well for us
and as expected, Nifty retested the 8250 mark. We continue with
our positive stance on the market and expect the index to move
towards 8290 - 8336 levels. On the flipside, 8210 - 8150 would
be seen as immediate support levels. Considering the
unfavourable risk to reward ratio in the index, traders are advised
to focus on stock specific moves.
Key Levels
Support 1 - 8210
Resistance 1 - 8290
Support 2 - 8150
Resistance 2 - 8336
Exhibit 2: Nifty Bank Daily Chart
Nifty Bank Outlook - (17719)
In yesterday's session, the Nifty Bank index opened gap down by
270 points; but recovered immediately to end the session
marginally in the positive territory.
On announcement of RBI Governor Dr. Raghuram Rajan's
decision to not continue his post after his term ends in September,
the Nifty Bank index opened with a gap down opening. However,
as the Dow Theory states that 'Price Discounts Everything'; the
index factored in the news in opening ticks and then recovered
the early losses before ending the session on a marginal positive
note. As we had also mentioned yesterday, the index is trading in
a broader range of 17350-18050 and only a breakout of the
range will lead to directional move in the index. Till then, traders
are advised to focus on stock specific trades with proper risk
management. The near term supports for the index are placed
around 17588 and 17350; whereas, resistances are seen around
17935 and 18050.
Key Levels
Support 1 - 17588
Resistance 1 - 17935
Support 2 - 17350
Resistance 2 - 18050
1
Technical & Derivatives Report
June 21, 2016
Comments
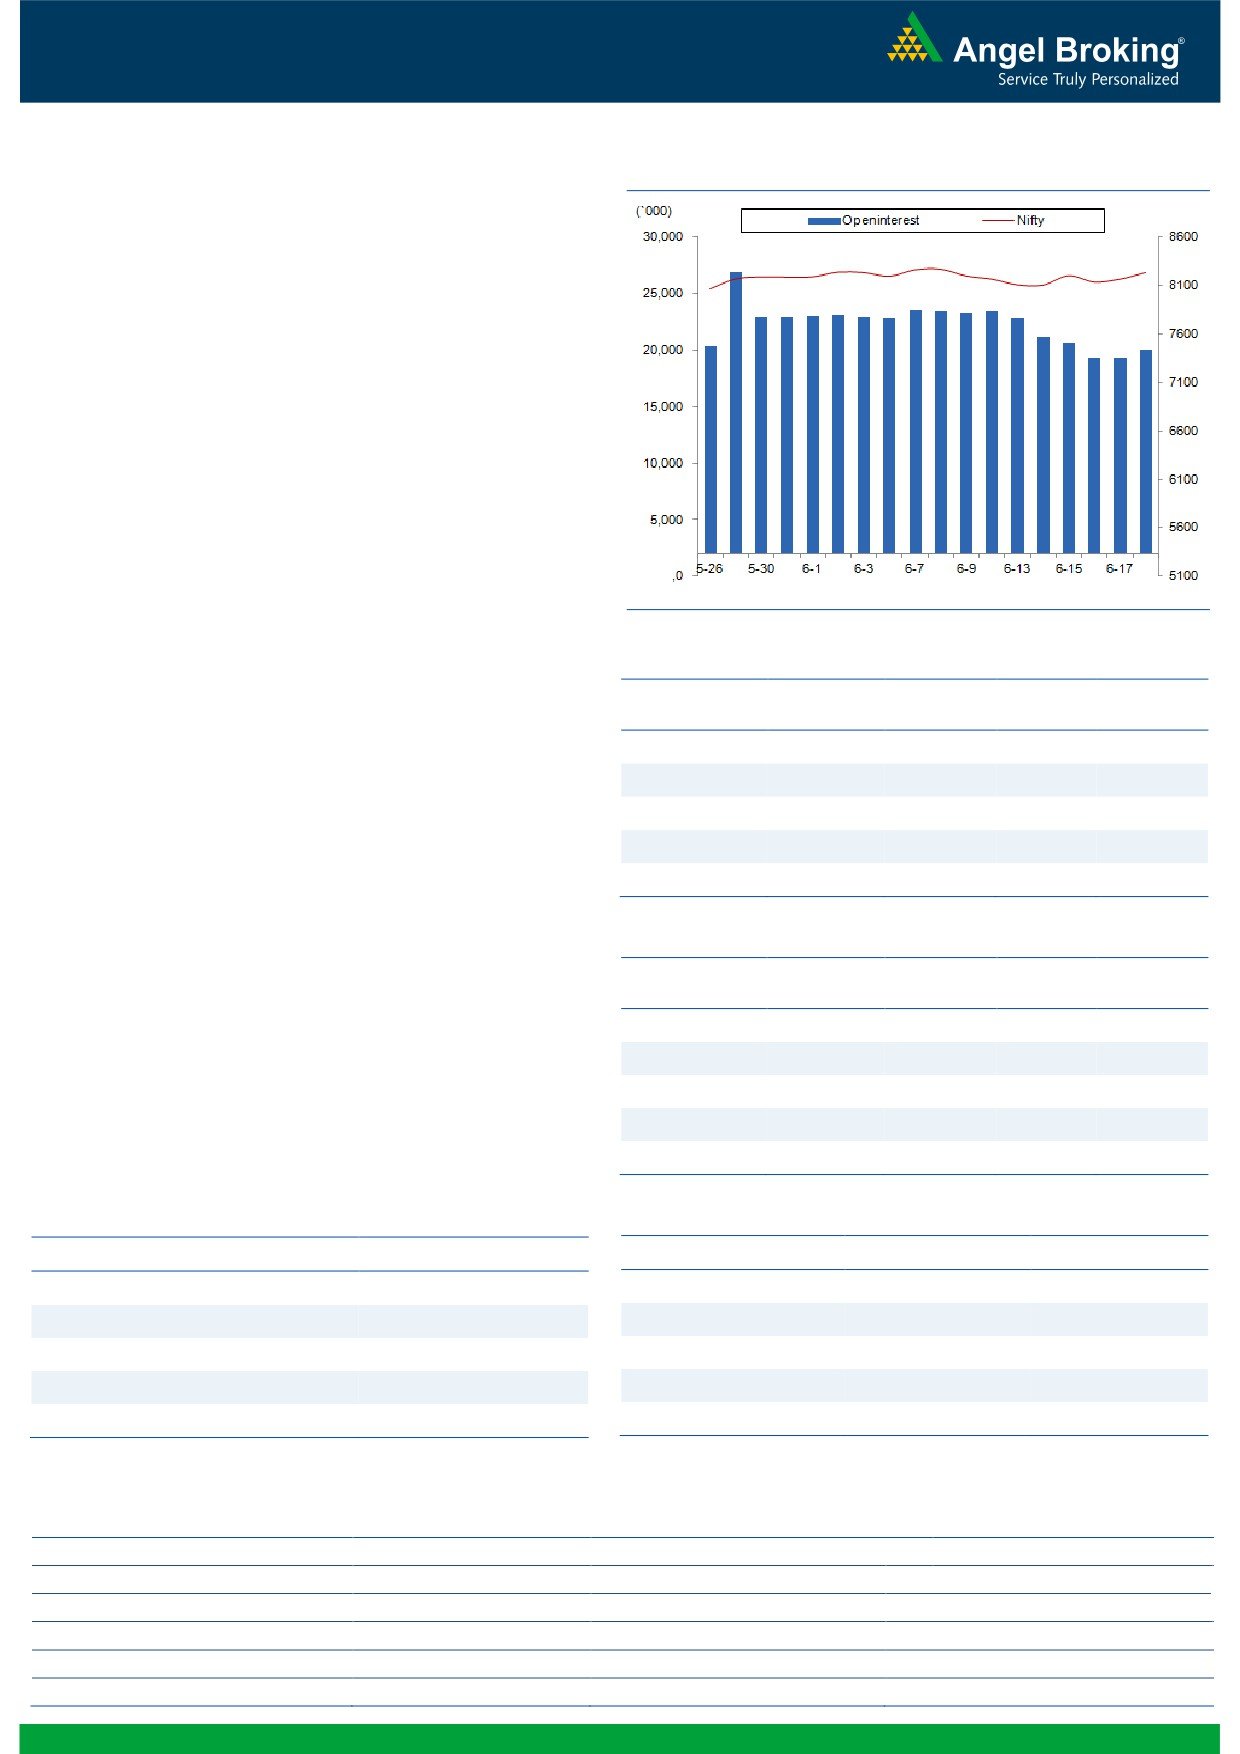
Nifty Vs OI
The Nifty futures open interest has increased by 3.78%
BankNifty futures open interest has increased by 21.42%
as market closed at 8238.50 levels.
The Nifty June future closed with a premium of 13.40
points against a premium of 4.20 points in previous
session. The July series closed at a premium of 41.95
points.
The Implied Volatility of at the money options has
increased from 16.44% to 17.40%.
The total OI of the market is Rs. 2,51,061/- cr. and the
stock futures OI is Rs. 68,481/- cr.
Few of the liquid counters where we have seen high cost
of
carry are UNITECH, MOTHERSUMI, IGL,
APOLLOTYRE and JPASSOCIAT.
Views
OI Gainers
Yesterday, despite the sharp recovery from lower levels,
OI
PRICE
FIIs were net sellers in both equity cash and index future
SCRIP
OI
PRICE
CHG. (%)
CHG. (%)
segment. They sold equities worth Rs. 537 crores. While
UPL
9042600
11.54
571.90
0.62
in Index Futures, they were net seller to the tuned of
BEML
1747500
7.87
872.50
3.93
Rs. 1336 crores with rise in open interest, indicating short
TORNTPHARM
202000
7.45
1347.00
-0.30
build-up in last trading session.
On Index Options front, FIIs sold worth Rs. 1055 crores
HAVELLS
5812000
7.11
363.10
1.28
with marginal change in open interest. In call options,
ABIRLANUVO
1335750
6.52
1038.75
-0.12
8400 strike added good amount of fresh positions;
whereas, unwinding was seen in 8200 and 8000 strikes.
OI Losers
While in put options, we witnessed huge OI build-up in
OI
PRICE
SCRIP
OI
PRICE
8100 and 8200 strikes with rise in IV’s. We believe its
CHG. (%)
CHG. (%)
buying which took place in these puts. Maximum OI in
JETAIRWAYS
5067000
-14.12
587.00
6.31
June series is visible in 8300 call and 8000 put options.
AMARAJABAT
685800
-9.93
862.05
-0.39
For the first time in June series, FIIs has formed good
IBREALEST
31258000
-8.82
97.60
-1.31
amount of short positions in index future, which doesn’t
BANKINDIA
20943000
-8.43
97.10
3.13
bode well for Bulls. However, we would like to wait for
HINDZINC
4118400
-6.13
177.00
2.49
follow up selling before initiating fresh shorts in index.
Historical Volatility
Put-Call Ratio
SCRIP
HV
SCRIP
PCR-OI
PCR-VOL
GODREJIND
31.84
NIFTY
1.15
0.85
JETAIRWAYS
47.38
BANKNIFTY
1.09
0.92
BHARATFORG
30.47
SBIN
0.95
0.68
MRF
26.08
RELIANCE
0.57
0.38
SKSMICRO
28.70
SUNPHARMA
0.35
0.34
Strategy Date
Symbol
Strategy
Status
May 30, 2016
TCS
Ratio Bull Call Spread
Active
June 06, 2016
NIFTY
Long Call
Exited at Cost
June 13, 2016
ONGC
Ratio Bull Call Spread
Active
June 20, 2016
MARUTI
Long Call Ladder
Active
2
Technical & Derivatives Report
June 21, 2016
FII Statistics for 20-June 2016
Turnover on 20-June 2016
Open Interest
No. of
Turnover
Change
Detail
Buy
Sell
Net
Instrument
Value
Contracts
( in Cr. )
(%)
Contracts
Change (%)
(in Cr.)
INDEX
INDEX
2379.46
3715.41
(1335.96)
238860
14418.39
5.93
344926
20201.28
34.98
FUTURES
FUTURES
INDEX
INDEX
26458.97
27513.47
(1054.50)
1163478
71095.99
0.46
3626653
216706.81
38.53
OPTIONS
OPTIONS
STOCK
4946.32
4656.30
290.02
1089340
54654.31
0.01
STOCK
FUTURES
570772
29807.26
10.04
FUTURES
STOCK
STOCK
3293.28
3299.47
(6.18)
112859
5896.51
1.74
OPTIONS
358228
18889.17
19.64
OPTIONS
TOTAL
37078.03
39184.66
(2106.62)
2604537
146065.21
0.80
TOTAL
4900579
285604.52
33.29
Nifty Spot = 8238.50
Lot Size = 75
Bull-Call Spreads
Bear-Put Spreads
Action
Strike
Price
Risk
Reward
BEP
Action
Strike
Price
Risk
Reward
BEP
Buy
8300
70.45
Buy
8200
75.05
36.70
63.30
8336.70
27.50
72.50
8172.50
Sell
8400
33.75
Sell
8100
47.55
Buy
8300
70.45
Buy
8200
75.05
56.40
143.60
8356.40
44.85
155.15
8155.15
Sell
8500
14.05
Sell
8000
30.20
Buy
8400
33.75
Buy
8100
47.55
19.70
80.30
8419.70
17.35
82.65
8082.65
Sell
8500
14.05
Sell
8000
30.20
Note: Above mentioned Bullish or Bearish Spreads in Nifty (June Series) are given as an information and not as a recommendation.
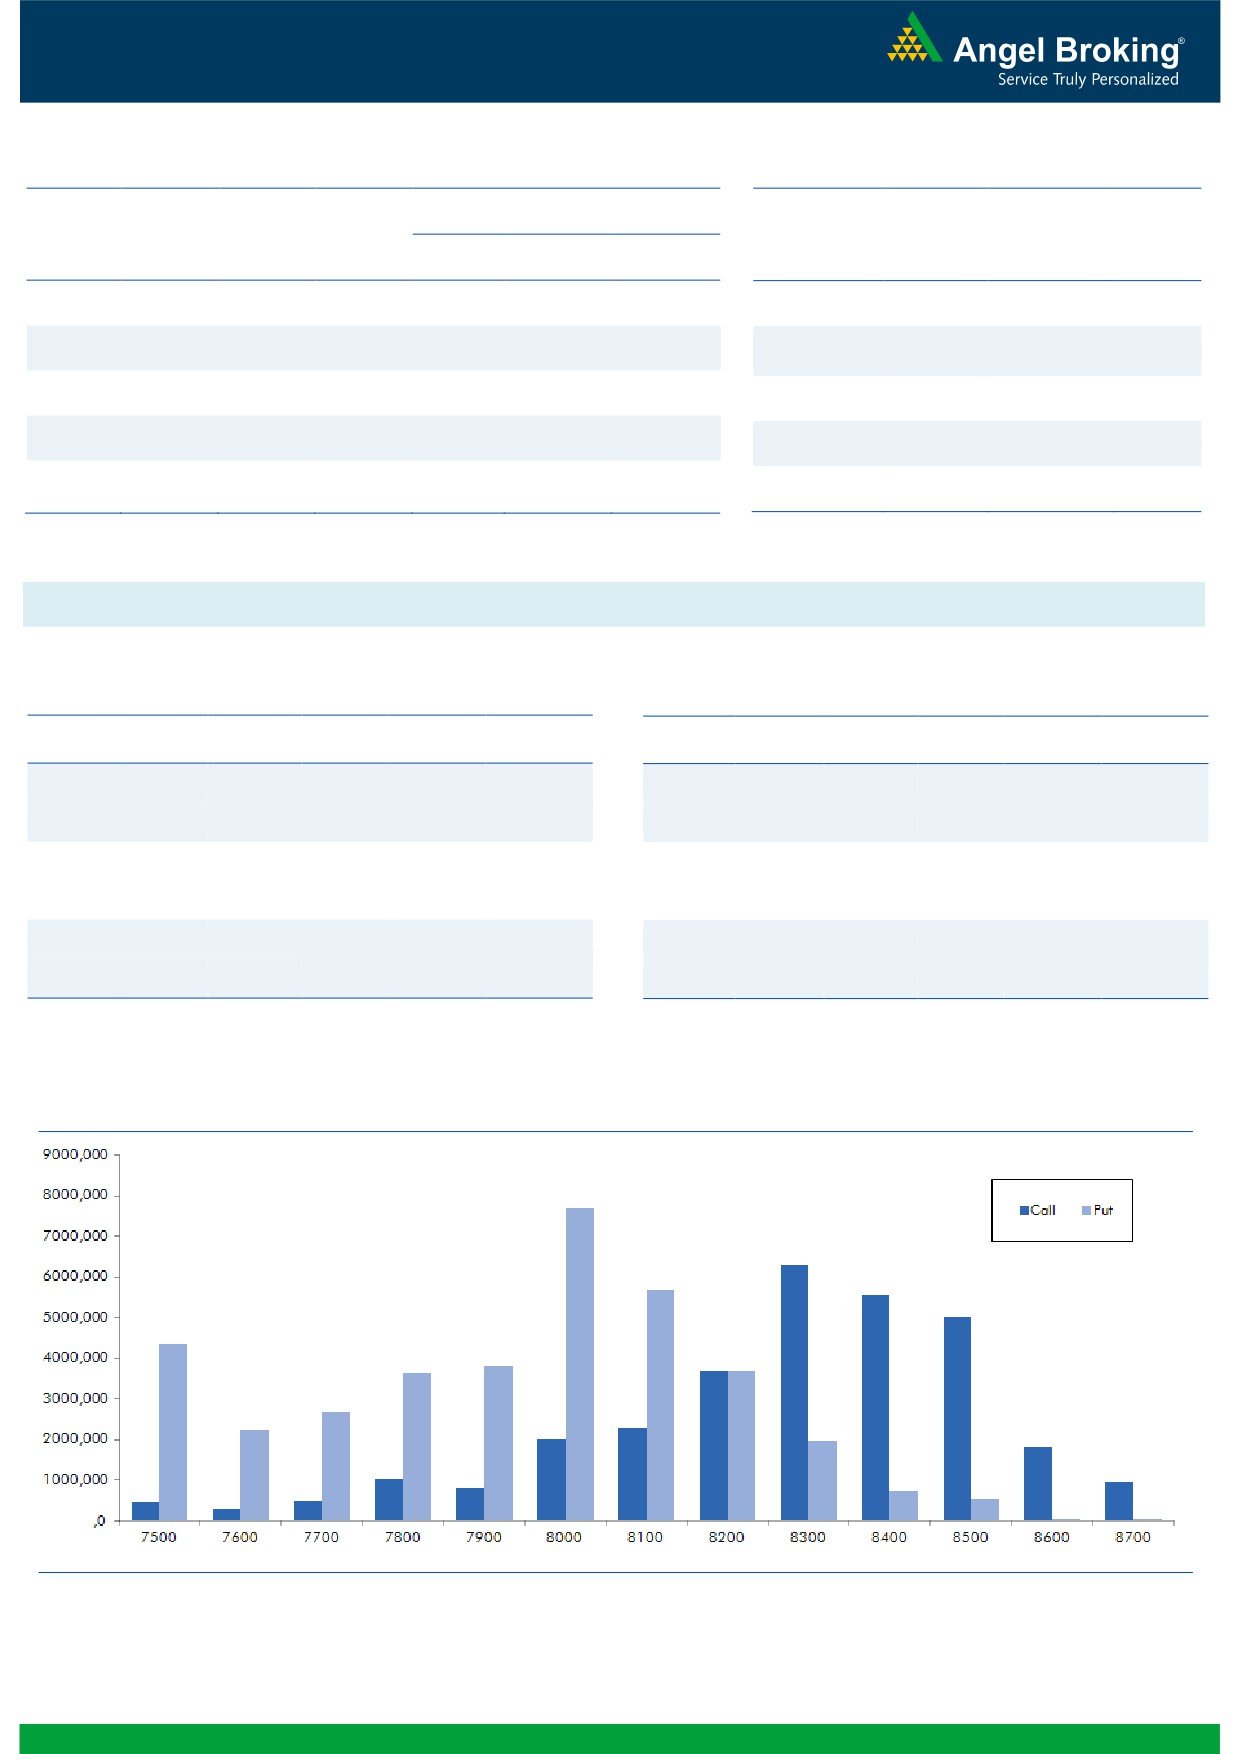
Nifty Put-Call Analysis
3
Technical & Derivatives Report
June 21, 2016
Daily Pivot Levels for Nifty Constituents
Scrips
S2
S1
PIVOT
R1
R2
ACC
1,525
1,548
1,561
1,583
1,597
ADANIPORTS
201
204
206
209
212
AMBUJACEM
231
237
240
245
248
ASIANPAINT
981
986
992
997
1,002
AUROPHARMA
711
725
733
747
755
AXISBANK
510
516
520
526
530
BAJAJ-AUTO
2,523
2,570
2,597
2,645
2,672
BANKBARODA
145
149
151
154
156
BHEL
119
121
123
126
127
BPCL
985
995
1,004
1,014
1,022
BHARTIARTL
349
357
361
369
374
INFRATEL
327
334
338
345
349
BOSCH
21,620
21,855
22,056
22,291
22,492
CIPLA
479
484
487
492
496
COALINDIA
308
310
312
314
315
DRREDDY
2,984
3,021
3,042
3,079
3,100
EICHERMOT
18,529
18,595
18,676
18,742
18,824
GAIL
379
382
387
390
395
GRASIM
4,214
4,267
4,304
4,357
4,394
HCLTECH
733
752
767
785
800
HDFCBANK
1,150
1,161
1,170
1,181
1,190
HDFC
1,195
1,211
1,223
1,239
1,251
HEROMOTOCO
2,963
3,004
3,048
3,089
3,133
HINDALCO
116
118
120
123
124
HINDUNILVR
866
873
877
884
889
ICICIBANK
231
235
237
240
243
IDEA
99
101
102
104
106
INDUSINDBK
1,077
1,090
1,102
1,115
1,126
INFY
1,168
1,188
1,200
1,220
1,232
ITC
352
355
358
361
364
KOTAKBANK
733
742
750
759
766
LT
1,443
1,475
1,492
1,525
1,542
LUPIN
1,431
1,446
1,461
1,477
1,491
M&M
1,321
1,336
1,345
1,360
1,369
MARUTI
4,035
4,084
4,115
4,163
4,194
NTPC
149
152
153
156
158
ONGC
208
211
213
216
218
POWERGRID
154
155
156
158
159
RELIANCE
959
975
984
999
1,008
SBIN
205
210
214
219
222
SUNPHARMA
728
734
740
746
752
TCS
2,564
2,611
2,640
2,688
2,716
TATAMTRDVR
307
314
318
324
328
TATAMOTORS
452
467
476
491
499
TATAPOWER
71
73
74
76
77
TATASTEEL
318
327
332
341
346
TECHM
525
535
542
551
559
ULTRACEMCO
3,234
3,302
3,338
3,406
3,443
WIPRO
540
548
554
562
567
YESBANK
1,046
1,061
1,070
1,084
1,094
ZEEL
443
446
450
453
456
4
Technical & Derivatives Report
June 21, 2016
Research Team Tel: 022 - 39357800
For Technical Queries
For Derivatives Queries
DISCLAIMER
Angel Broking Private Limited (hereinafter referred to as “Angel”) is a registered Member of National Stock Exchange of India Limited,
Bombay Stock Exchange Limited and MCX Stock Exchange Limited. It is also registered as a Depository Participant with CDSL and
Portfolio Manager with SEBI. It also has registration with AMFI as a Mutual Fund Distributor. Angel Broking Private Limited is a
registered entity with SEBI for Research Analyst in terms of SEBI (Research Analyst) Regulations, 2014 vide registration number
INH000000164. Angel or its associates has not been debarred/ suspended by SEBI or any other regulatory authority for accessing
/dealing in securities Market. Angel or its associates including its relatives/analyst do not hold any financial interest/beneficial
ownership of more than 1% in the company covered by Analyst. Angel or its associates/analyst has not received any compensation /
managed or co-managed public offering of securities of the company covered by Analyst during the past twelve months. Angel/analyst
has not served as an officer, director or employee of company covered by Analyst and has not been engaged in market making activity
of the company covered by Analyst.
This document is solely for the personal information of the recipient, and must not be singularly used as the basis of any investment
decision. Nothing in this document should be construed as investment or financial advice. Each recipient of this document should
make such investigations as they deem necessary to arrive at an independent evaluation of an investment in the securities of the
companies referred to in this document (including the merits and risks involved), and should consult their own advisors to determine
the merits and risks of such an investment.
Reports based on technical and derivative analysis center on studying charts of a stock's price movement, outstanding positions and
trading volume, as opposed to focusing on a company's fundamentals and, as such, may not match with a report on a company's
fundamentals.
The information in this document has been printed on the basis of publicly available information, internal data and other reliable
sources believed to be true, but we do not represent that it is accurate or complete and it should not be relied on as such, as this
document is for general guidance only. Angel Broking Pvt. Limited or any of its affiliates/ group companies shall not be in any way
responsible for any loss or damage that may arise to any person from any inadvertent error in the information contained in this report.
Angel Broking Pvt. Limited has not independently verified all the information contained within this document. Accordingly, we cannot
testify, nor make any representation or warranty, express or implied, to the accuracy, contents or data contained within this document.
While Angel Broking Pvt. Limited endeavors to update on a reasonable basis the information discussed in this material, there may be
regulatory, compliance, or other reasons that prevent us from doing so.
This document is being supplied to you solely for your information, and its contents, information or data may not be reproduced,
redistributed or passed on, directly or indirectly.
Neither Angel Broking Pvt. Limited, nor its directors, employees or affiliates shall be liable for any loss or damage that may arise from
or in connection with the use of this information.
Note: Please refer to the important ‘Stock Holding Disclosure' report on the Angel website (Research Section). Also, please refer to the
latest update on respective stocks for the disclosure status in respect of those stocks. Angel Broking Pvt. Limited and its affiliates may
have investment positions in the stocks recommended in this report.
5